Adding a Chart or Table
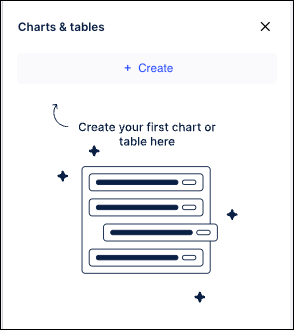
You are able to define the criteria and add new charts and tables to the side panel. These charts and tables can then be accessed quickly from the Charts & tables panel without having to reenter the criteria each time. The system automatically determines if it shows a histogram or a table based on the property type.
Click the Create button.
Select either “Object property” or “Event property”.
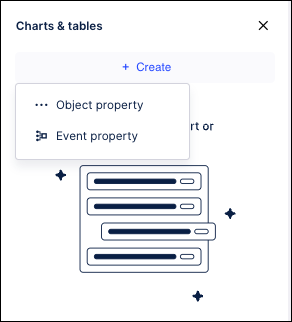
For an Object property, you get a list of all object types used in the process model.
For an Event property, you get a list of all available events in the process model.
For either type, there is a Search bar that filters the list based on the characters you enter.
When an object or event is selected, you can see a list of associated properties with indicators of their type - numeric, string, or date.
Select a property and the new chart or table displays at the top of the panel. The type of chart or table is based on the type of the selected property:
Numeric: Histogram
Date: Histogram
String: Table
Removing charts and tables
To remove a chart or table from the pane, just hover it and click the X button in the top right corner. The chart or table is removed from the panel.