Types of charts and tables
Histogram chart
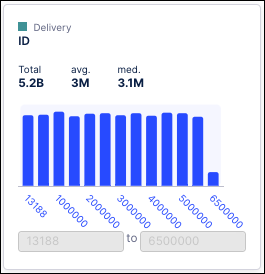
The histogram chart shows numeric or date properties for an object or event. This chart reacts based on filters and updates based on the information displayed.
Each histogram chart shows the numeric or date values on the X-axis and the number of objects on the Y-axis. When you hover over a bar in the histogram, you will see both the X value (property value) and the Y value (object count) in a popup, along with more detailed information. For numeric properties, the total, average and medium are displayed at top of the histogram, but no aggregations are shown for a date property.
Table
The table option is used to show string properties and can be used for filtering. Each table shows exactly two columns: the selected property value(s) and a metric.
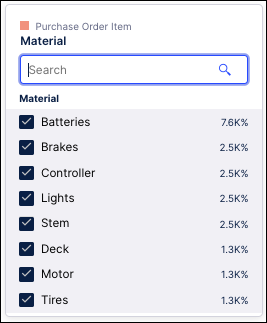
Below the header is a Search field used to filter the first column of the table. You can enter the name of the property you want to filter by and any corresponding names appear in the dropdown.