Event node details in Process Explorer
The event node pop up in Process Explorer provides additional details about a specific event, such as how frequently it occurs, an overview of all events that occurred immediately before or after this event, or how long it takes an event to be completed (similar to the Event Explorer). By clicking on an event node in Process Explorer, users can see the details of the selected event on the Occurrences tab, a list of events immediately preceding this event on the Objects from / Objects to tab, and a range of object-centric performance metrics on the Synchronization tab.
Note
In a multi-object Process Explorer, the Occurrences tab and the Objects to / Objects from tab show a breakdown of the events in each event log. Clicking the downward arrow will expand that specific event log to show the details for events that occurred in that event log.
For events that are shared among the different objects, the Synchronization tab shows the object-centric performance metrics evaluated for a specific event. Clicking the downward arrow will expand a specific metric related to that event.
Occurrences
The Occurrences tab shows usage details for this event, including how often this event occurred in a process and what percentage of processes are included in this event. In the Select Filter section, there are a series of buttons that allow you to filter your process graph based on criteria such as how many processes included this selected event, how many processes do not include the event, how many times a process started with this event, and how many times a process ended on this event.
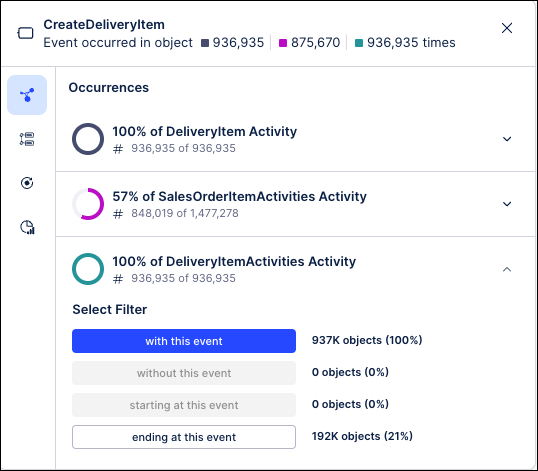
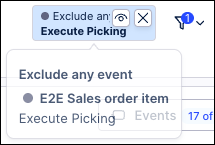
Clicking one of these buttons will close the details window and apply the selected filter to your process graph. To remove the applied filter, hover over the filter in the upper right corner and click the X to remove it.
Cases from/to or Objects from/to
The Cases from / Cases to tab shows a breakdown of the events that most commonly preceded and followed the selected event. The Preceding Events tab shows a list of all events that occurred immediately before this event and the number of objects in which this occurred. The Following Events tab shows the same overview for all events that occurred immediately following the selected event. On both tabs, the events are displayed in descending order by default, but can be re-sorted by clicking on the Objects header and selecting a different sort order from the dropdown.
Note
This tab will be titled “Objects from / Objects to” in a multi-object Process Explorer.
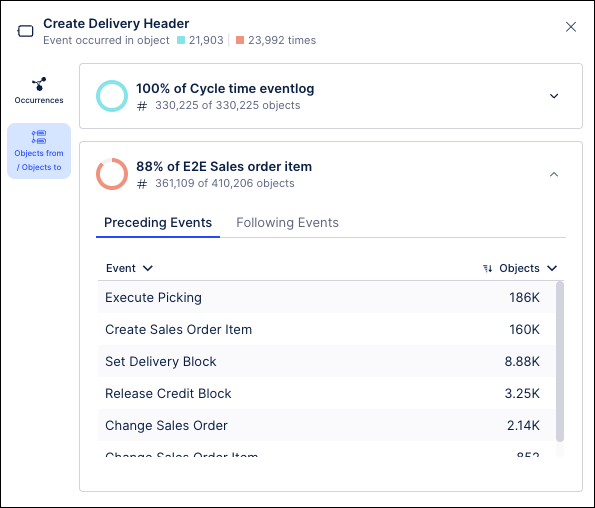 | 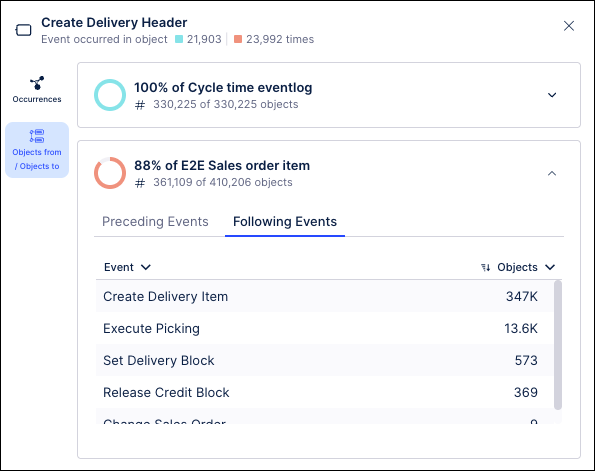 |
Preceding Events tab | Following Events tab |
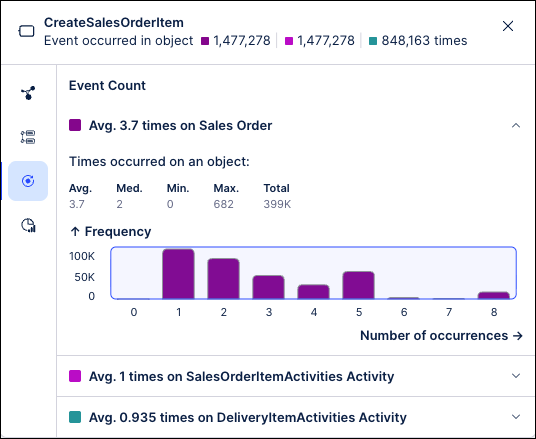
Event Count
The Event Count tab displays how often an event occurs for a specific object. This tab includes an expandable section for each object that includes all the corresponding count metrics for this event, including the average number of times it occurs, the maximum number of times it occurs and the total number of occurrences for this object. Each section also includes a graph showing the frequency with which every number of occurrences happens for this object, such as how often this event occurred four times or how often is occured twice.
Synchronization (Multi-object Process Explorer only)
The Synchronization tab shows object-centric performance metrics, which allow you to view the range of event lead times, execution times, and synchronization times for all objects in a process. These metrics include:
Event Lead Time: Total duration from when the earliest input object becomes available to the completion of that specific event. Event Lead Time can be thought of as the total amount of time needed for the preparation and execution of all steps in the process.
Synchronization (Sync) Time: Time between when the first object and last object arrive at the shared event. Sync Time captures the delay caused by waiting for all involved objects to be ready.
Execution Time: Amount of time from when all input objects have executed their last events to when the execution is complete. During this period, all objects are ready and nothing is blocked on the data side, yet no action occurs.
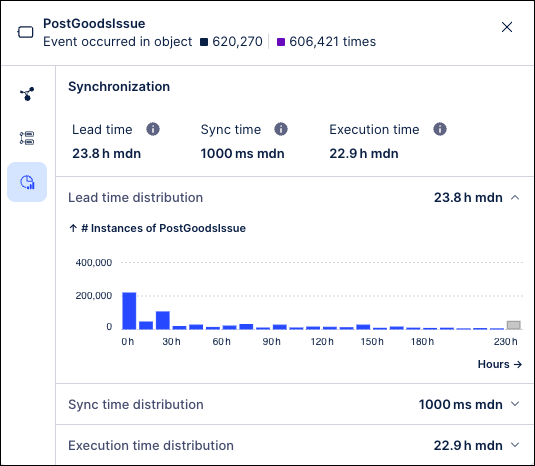
These metrics are computed for all shared events in the process and show the range of times for each metric as well as how frequently each value occurred across the events in this process. In addition, these metrics provide the average, median and trimmed median values.
The example below illustrates how the object-centric performance metrics are calculated for a Dispatch event instance. In this example, the event includes a Sales Order (o1), three Sales Order Items (i1, i2, i3) and one Delivery (d1). In this visualization, the vertical axis represents time and each circle represents one of the input objects required to execute this particular Dispatch instance. The circle is filled when the corresponding object is "ready" after executing its last event prior to the shared event.
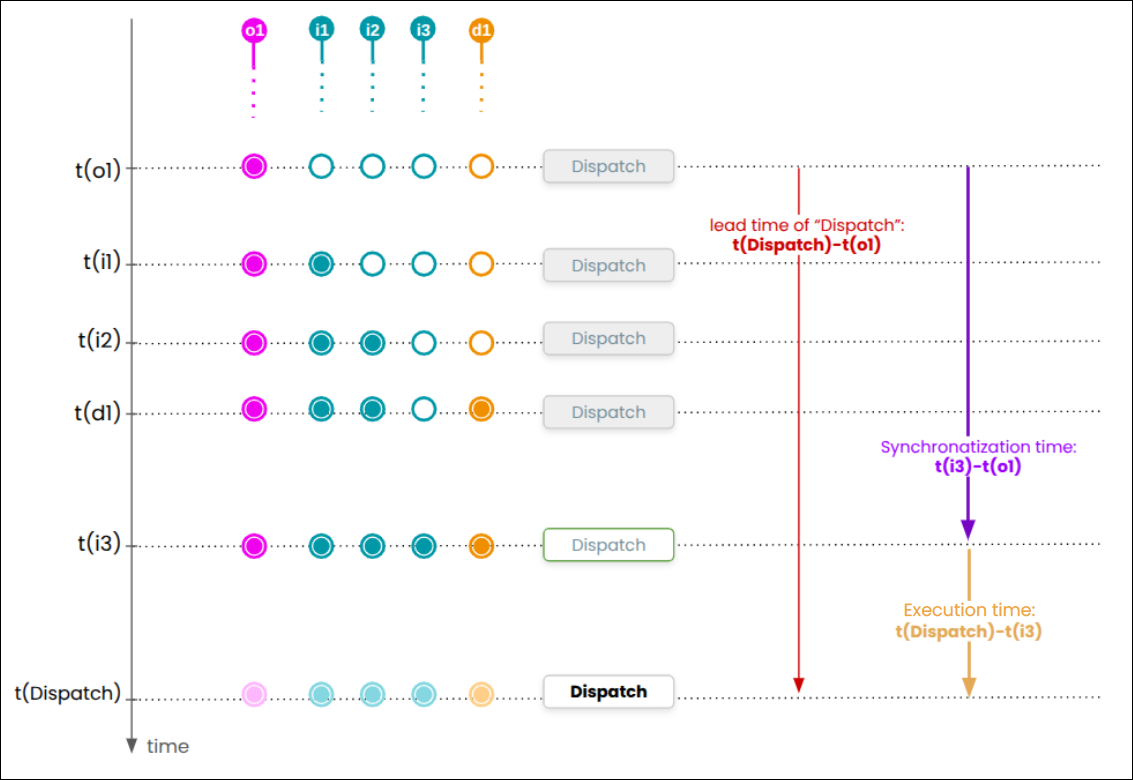 |
So based on this example, the Synchronization metrics are calculated as follows
The Event Lead Time (shown in red) indicates the time from when the first object (Sales Order o1) is ready until the Dispatch is complete at time t(Dispatch).
The Idle Time (shown in yellow) is the unproductive gap between when the last object Order item (i3) arrives and when Dispatch occurs at time t(Dispatch).
The Sync Time (shown in purple) measures how long it took for all five objects to complete their corresponding last event prior to Dispatch. This is the time span from the first object's arrival (Sales Order o1) until the last object's arrival (Sales Order Item i3).