Multi-object Process Explorer
In the multi-object Process Explorer, the process is visualized as objects and their corresponding events. An activity impacting multiple objects is shown only once and the objects intersect at these common activities.
Note
A multi object Process Explorer can only be used if the underlying data model is an Object-Centric data model.
Process Explorer automatically turns into the multi-object mode, once the View is built on an object-centric data model.
As in the Multi-Event-Log case, several event logs can be configured to be available in Process Explorer.
Activities that are shared between different event logs are merged in the graph.
The activity popup shows which event logs flow through the activity and allows for filtering on each of them.
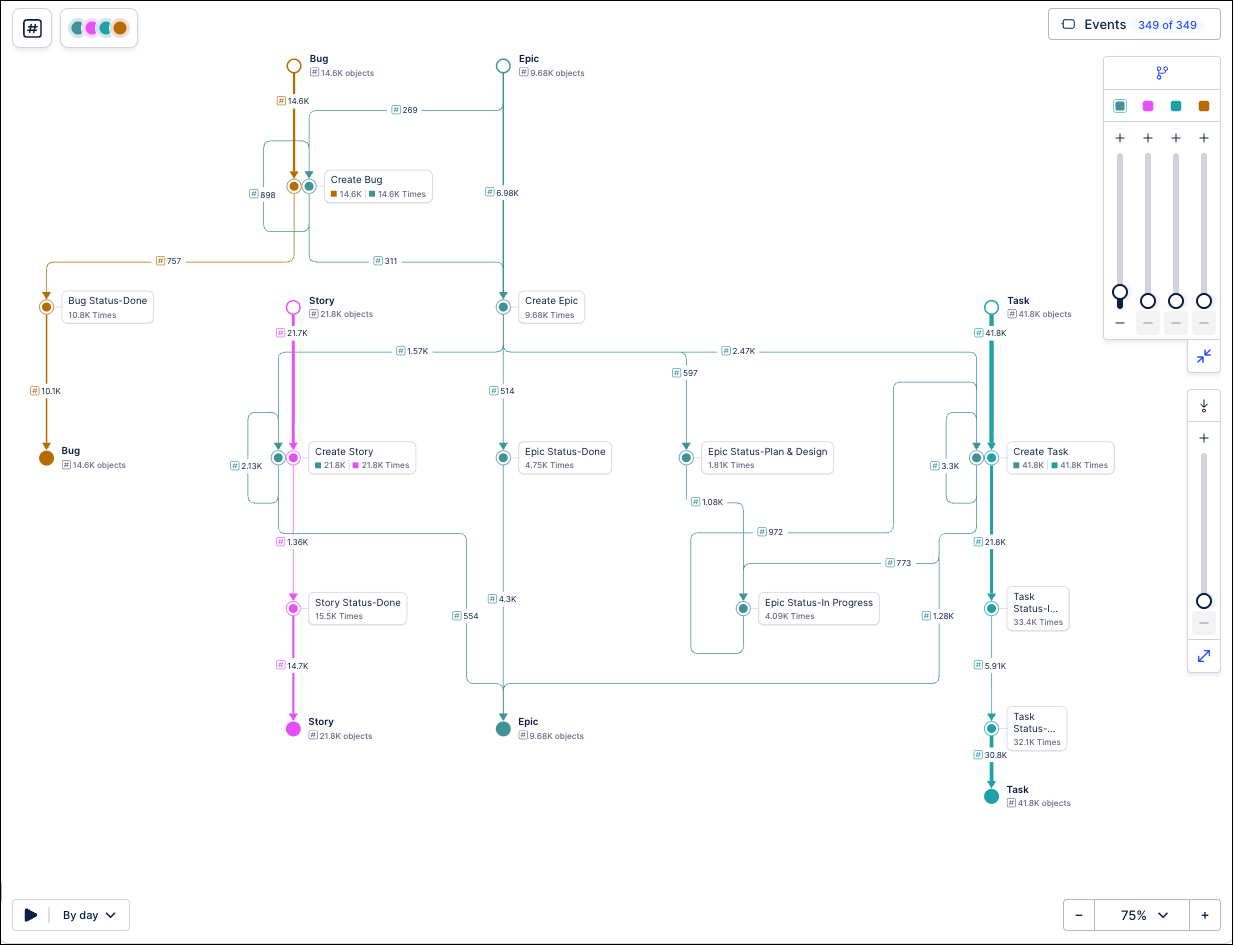
The event counts are displayed broken out by object type, with the total count of the current metric shown for each object type next to the colored square corresponding to that object type in the process flow
The following diagram is an example of a multi-object Process Explorer:
 |
And for a video overview:
The global slider allows you to explore events by adding and removing nodes and edges from your process graph. Using the global slider, you can add the next most frequent event from across all object types based on the number of object instances that interact with the event. This makes it faster to explore across multiple object types by making adjustments across all of them simultaneously rather than making updates using the individual sliders for each object type. You can still use the individual object type sliders to add or remove elements for those specific object types and your changes will be reflected on the global slider. This allows you to switch between using the global slider and the individual object sliders to adjust your process graph.
Note
Adding the next most frequent event may result in more events being added in order to connect the new event being added to the existing process graph.
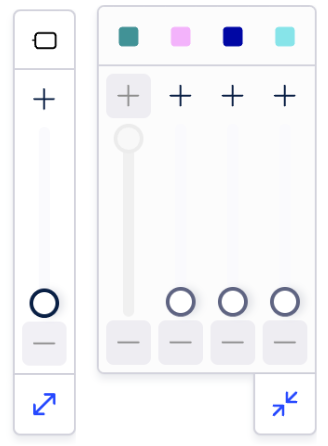 |
The global slider works in conjunction with the individual object sliders so that changes made using one method are reflected in the other. So if you make changes using the global slider, that change is also made to the respective object slider. The same is true for changes made using the object slider that will also be adjusted on the global slider.
Adding or removing events using these slider methods work as follows:
Global slider
When incrementing using the global slider, the next most frequent event from across all object types is added to the graph. The individual slider for the object type of the event being added is also incremented to reflect this.
When decrementing the global slider, the most recently added event (by either the global slider or the object slider) is removed from the graph.
Object slider
When increasing using an object slider, the next most frequent event for that object type is added to the graph. The global slider value is also incremented to reflect this change.
When decrementing an object slider, the last event for that object type that was added (by either the global slider or the object slider) is removed from the graph. This event is also removed from the global slider’s sorting and the global slider is adjusted accordingly.
Connecting multi-object processes automatically
When working with the multi-object Process Explorer, the sliders interface also contains a button that automatically sets your process graph to its minimum connected state. Clicking this button will adjust each of your available sliders to the minimum state required to connect these objects through shared events.
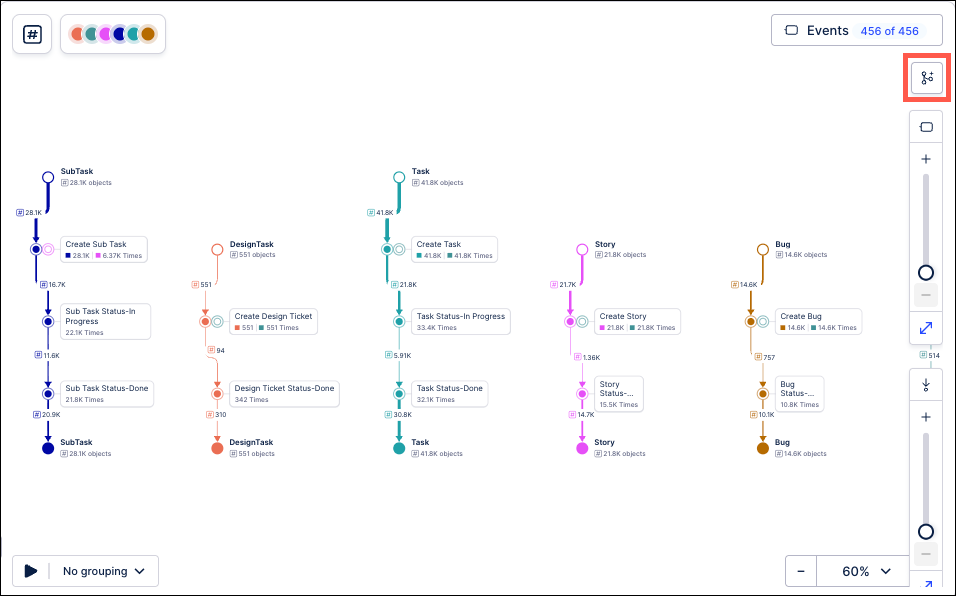
This button is designed to find the minimum requirements to connect objects. If your process graph is in a more complex state than the minimum, clicking this button will simplify your graph down to the minimum state. If there is not a possible state where all displayed objects are connected because an object does not contain any events shared with other objects, this button will adjust the process graph to the state with the fewest disconnected objects.
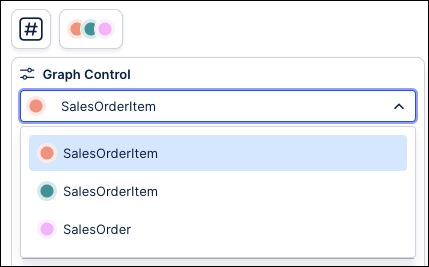
For a Process Explorer with multiple event logs assigned, use the object selection at the top of the interface to choose which event logs to include. Check the boxes of which objects you want to use in the control panel.
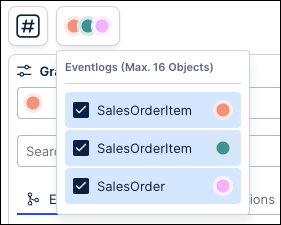
The selected event logs are shown in the dropdown at the top of the graph control.
 |
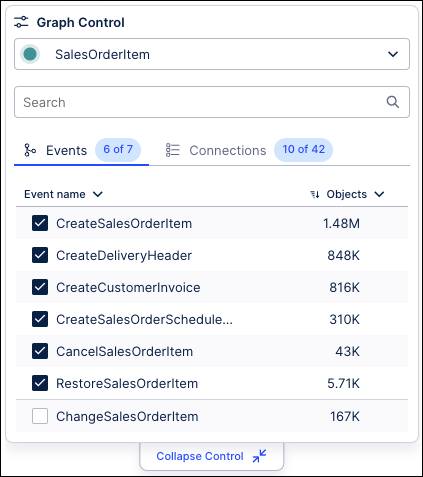
Select an event log from the dropdown and then select which events to include in the process graph. The graph is updated automatically whenever an event is added or removed from the graph control.
 |