Creating and managing Key Performance Indicators (KPIs)
In Process Designer, Key Performance Indicators (KPIs) are measurable values used to monitor, evaluate, and improve the performance of business processes. By embedding KPIs into the process modeling environment, stakeholders gain real-time insights into performance, efficiency, and compliance, allowing for data-driven decision-making and continuous improvement. This integration enhances transparency across departments, supports accountability, and facilitates faster identification of bottlenecks or deviations.
An example of a KPI could be “Average Order Processing Time” for a sales or logistics process. This KPI measures the average time it takes from receiving a customer order to completing the delivery or fulfillment. By attaching this KPI to the relevant process, users can monitor whether the process meets performance benchmarks (e.g., within 48 hours), identify inefficiencies, and initiate improvements directly within the process context.
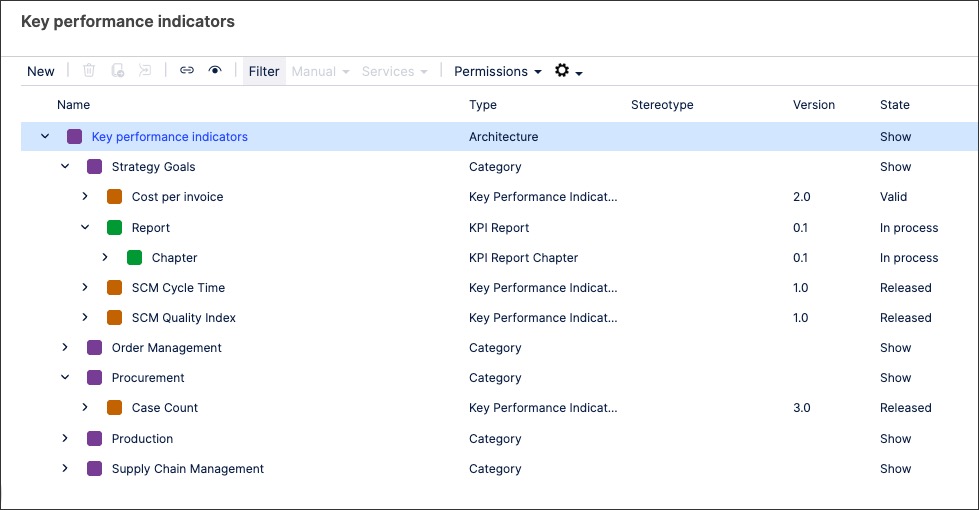
When creating and managing KPIs in Process Designer, you can create the following levels: Architecture, Category, KPI, and KPI Report.
To create KPI objects in Process Designer editor mode as an architect:
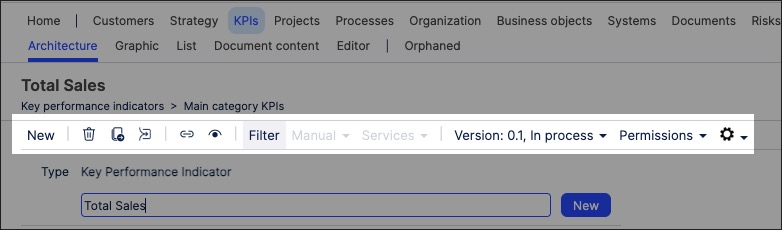
Click KPIs - Architecture.
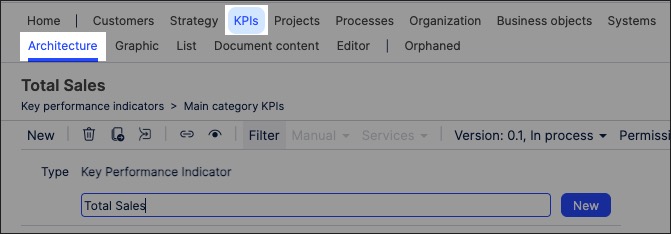
Select the category to associate the KPI to.
Add a KPI name and click New.
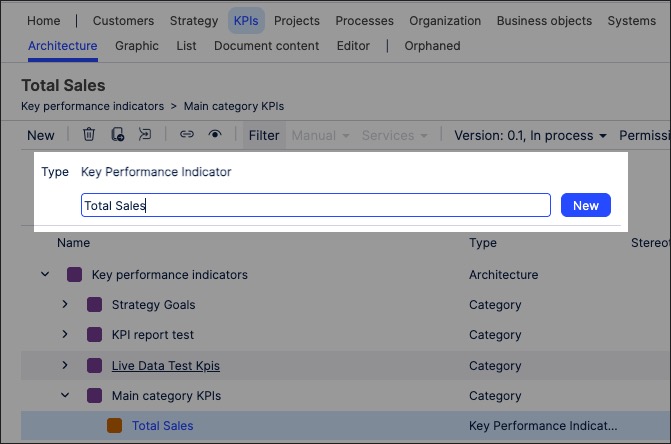
The KPI is created and set to version 0.1 with the state 'In progress'.
With the side panel open, configure the KPI attributes. This includes the units and values.
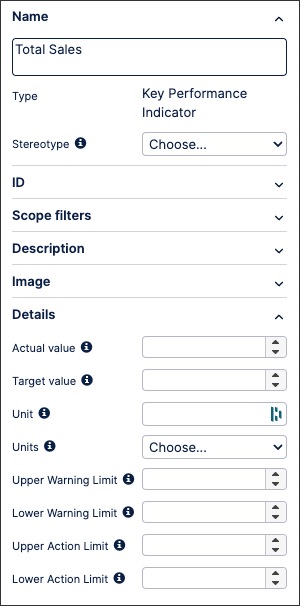
The KPI is now available and can be linked to within a process or task.
You can manage existing KPIs by returning to the KPI screen and either editing the KPI details or by using the toolbar:
Once created, you can link to KPI within a process or a task. This associates that KPI to that process step.
To link a KPI to a process or task in Process Designer:
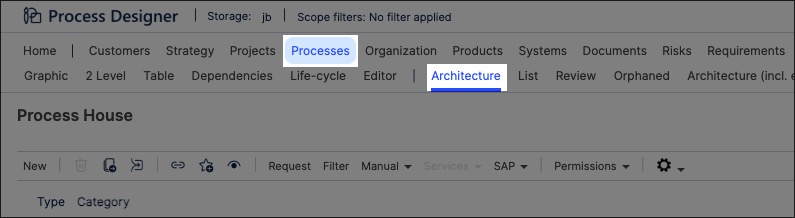
Click Processes - Architecture.
Select the main or sub process you want to link the document to, opening the process graphic.
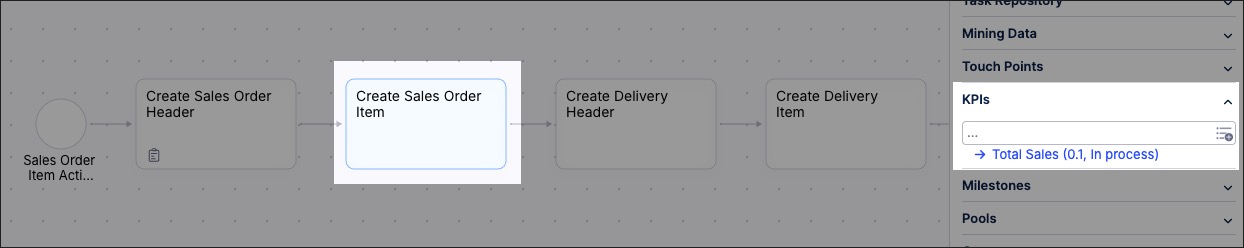
Click the process step or task you want to link the document to, opening the side panel.
Scroll to KPIs and select the KPI you want to link.
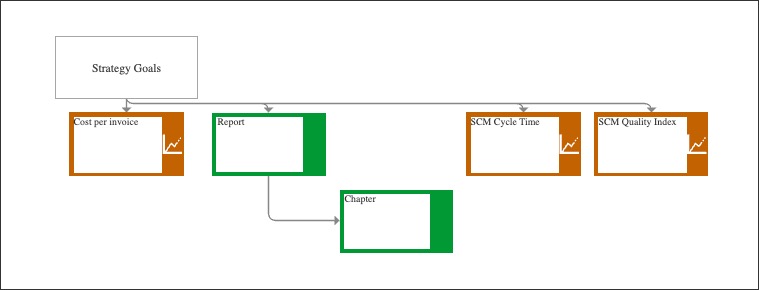
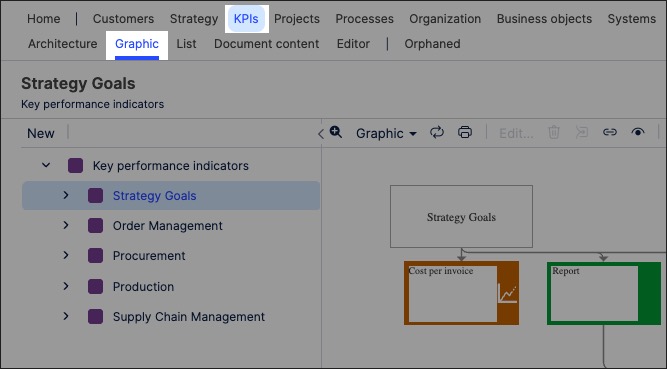
You can also create KPI graphics using the content you've previously created. This enables you to visually map out the structure and contents of your organization's KPIs.
In this example, the KPI graphic shows all the KPIs under the 'Strategy Goals' category:
To create a KPI graphic in Process Designer editor mode as an architect:
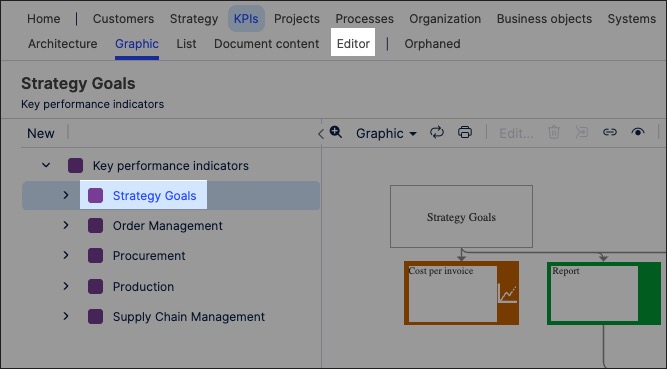
Click KPI - Graphic.
Select the object that you want to create the graphic for and then click Editor.
In this example, we're selecting the Strategy Goals graphic to edit:
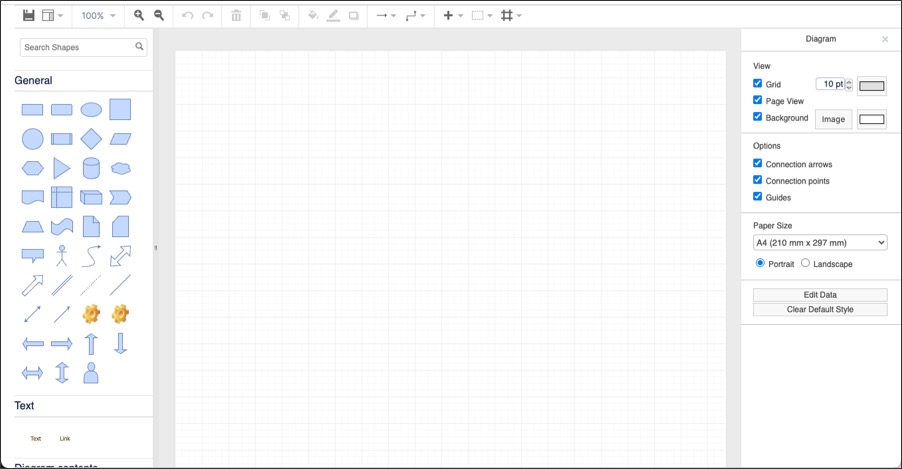
The editor loads and is pre-loaded with the related repository objects from the layer you selected.
Use the drag and drop editor to create the graphic, utilizing the graphic editor features.
Click Save.
Graphic editor features
When creating graphics using the editor, you have the following features available:
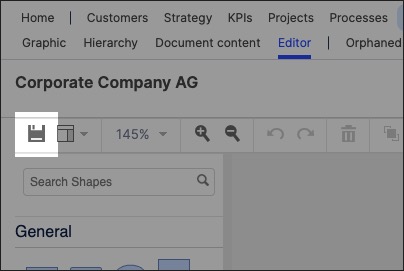
Toolbar: This controls the following features:
Save: Save the current graphic, updating the graphic displayed in the Hierarchy area.
View: Display and hide the format panel, graphic outline, and layers panels.
Zoom / view controls: Controls the view of the editor.
Undo/redo: Effective for the last three changes.
Delete: Removes the existing graphic element.
Front / back layering: Moves the selected element forwards or backwards.
Fill / line / shadow: Configure the colors and shadow for the selected elements.
Connections / waypoints: Add connections between elements and choose the connection style.
Add link / image: Add external elements to the graphic, such as interactive links and uploaded images.
Flow: Automatically organize the selected elements based on how they should flow into each other (such as horizontally or vertically).
