Throughput time filtering in Process Explorer
Throughput time filtering allows you to filter your analyses by throughput time (TPT). Using this feature, you can filter your View from the Process Explorer to show cases where the processing time between two selected activities is within the specified throughput time range. This allows you to analyze the TPTs between any two events in the process, which can help to identify insights. The same filtering can be achieved by applying the throughput time as a process filter.
In your View, hover over the first event you want to select and then click the "Calculate throughput time" icon.
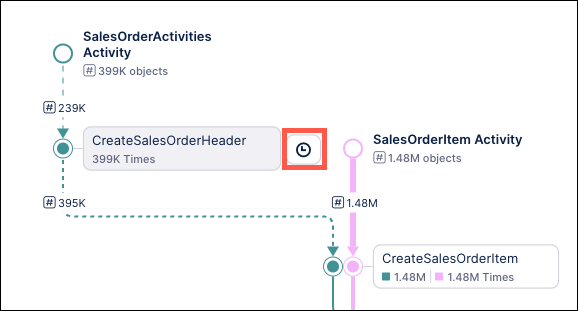
The arrow displays beginning with the first selected event.
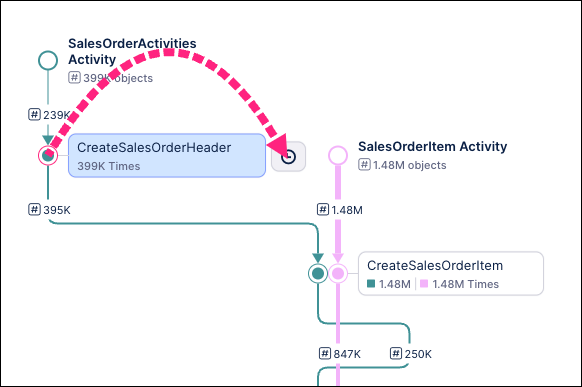
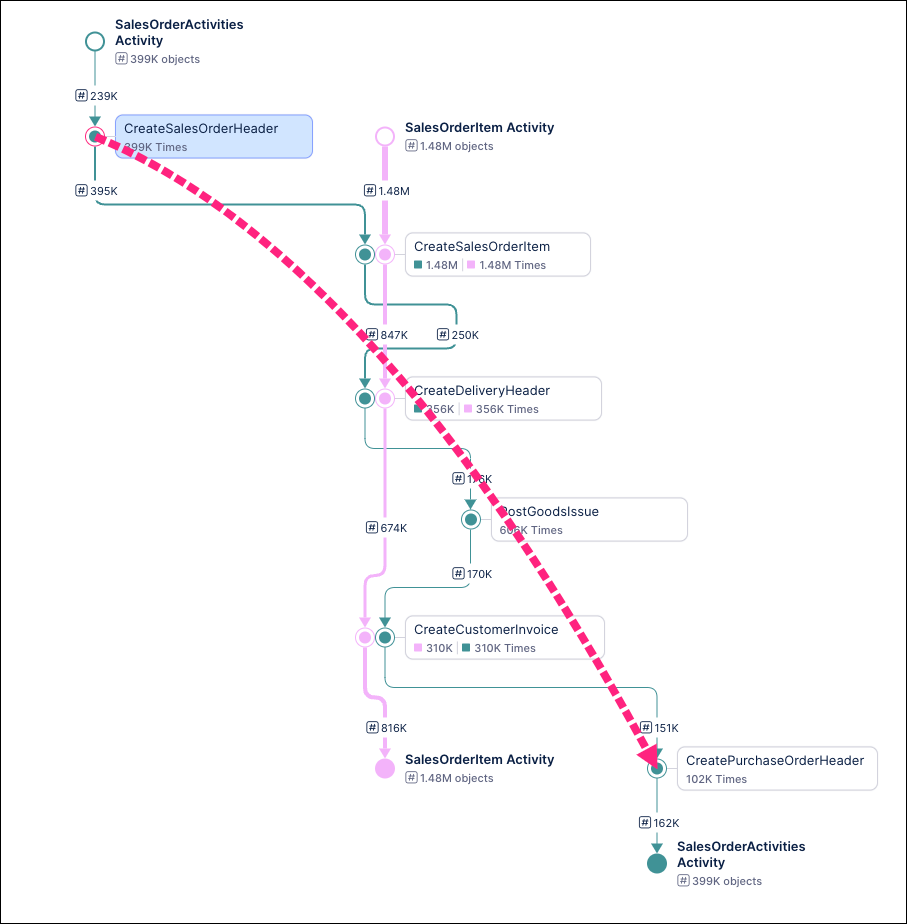
Drag the arrow to the second event you want to select for filtering.
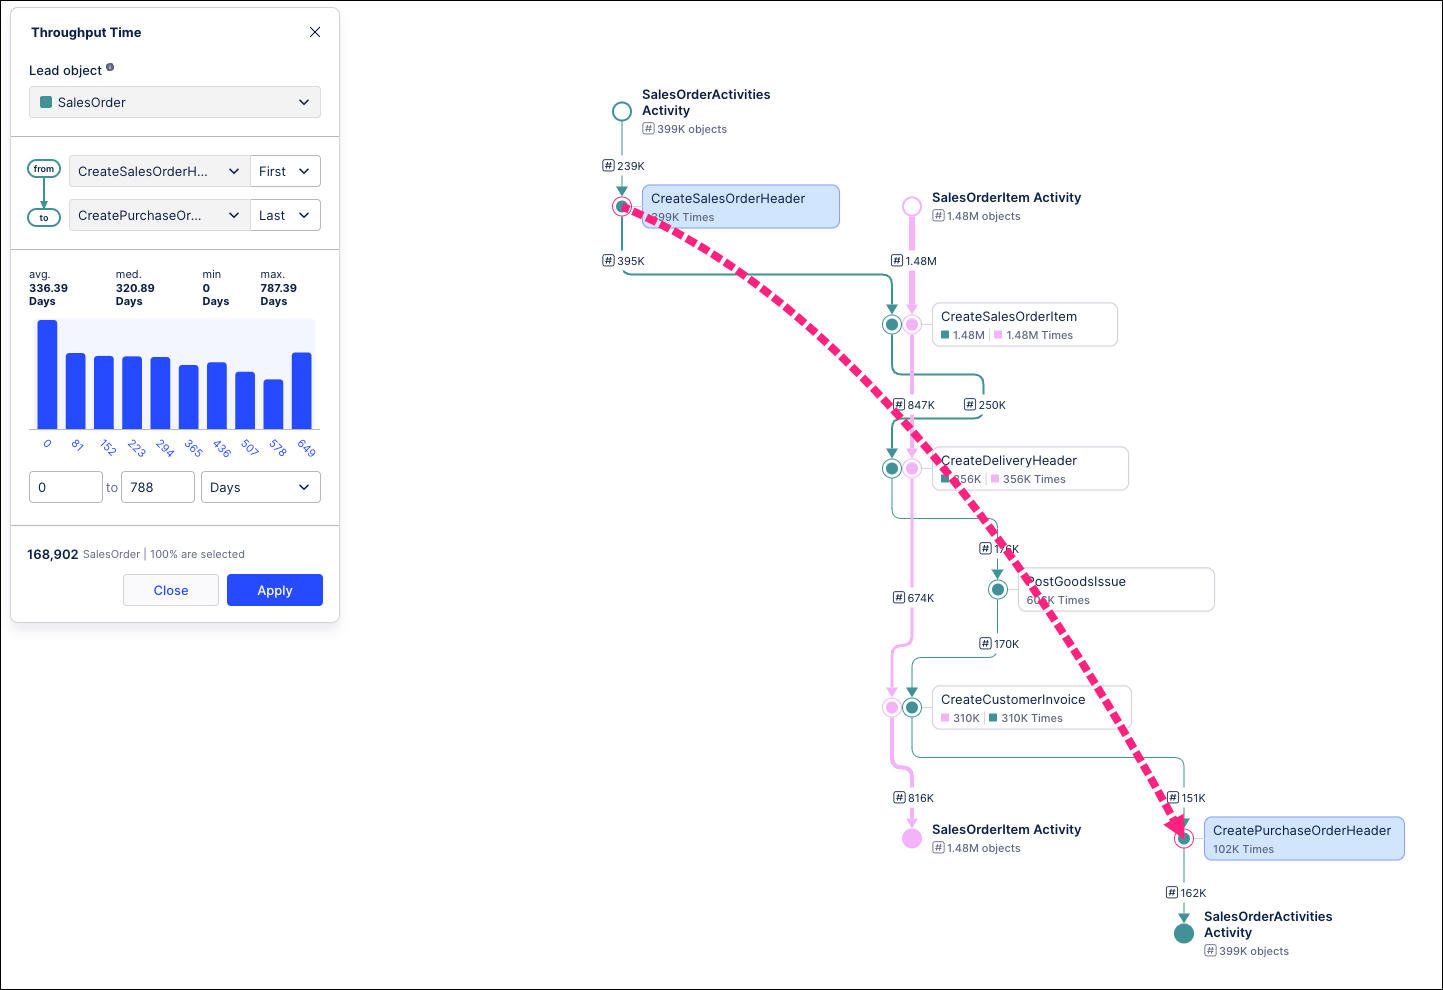
Once the second event is selected, the Throughput Time filter displays with the two selected events populated and the range of TPT times shown.
In the Throughput Time filter, you can use the dropdown to change the lead object for this View.
Note
The throughput time between the selected events will be calculated from the perspective of the selected lead object.
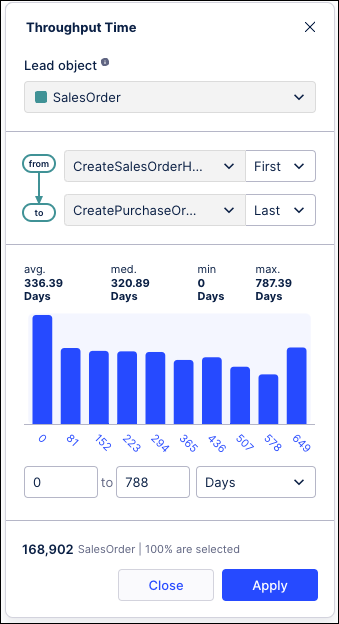
The from and to fields show the two events you selected from your View. Use the dropdowns to the right to indicate if you want to use the first or last occurrence of the event if they occur multiple times during the process.
The time fields show the average, median, minimum and maximum throughput time in days between the two selected events. Use the filter fields below the bar graph to set the time range covered by this filter.
Note
The time range can be set using days, hours, minutes, seconds or milliseconds.
For example, in the screenshot below the TPT filter is updated to only show cases where the throughput time between the “CreateSalesOrderHeader” and “CreatePurchaseOrderHeader” events is between 0 and 365 days.
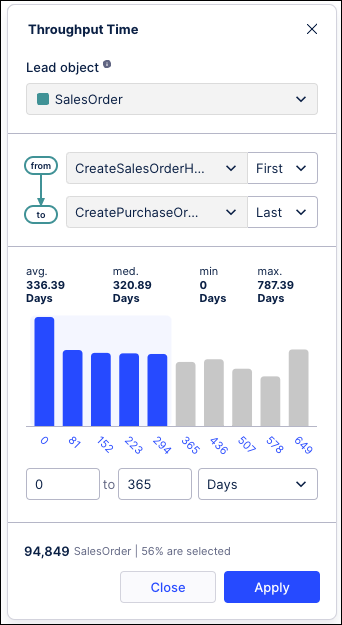
Also note that the total number of cases and the percentage selected metrics below the time fields are updated based on the filter criteria.
Click Apply to update your View based on the selected filter.
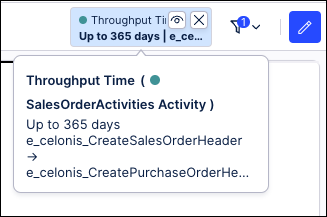
The View is refreshed based on your filter criteria. The applied filter is shown in the upper right above the View. Hover over the filter chip to see the currently applied filter criteria.
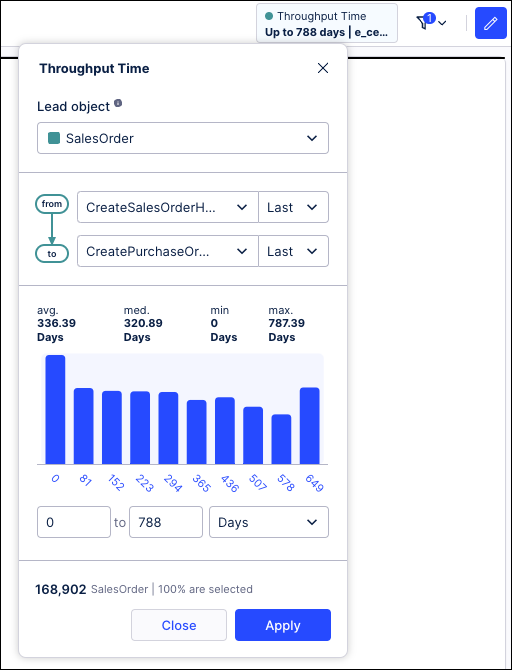
To update the filter criteria, click on the filter in the upper right to open the Throughput Time filter window, change your filter criteria and click Apply to update your View.
To remove the filter, click the X on the filter in the upper right corner of the chip.
In your View, hover over the first event you want to select and then click the "Calculate throughput time" icon.
The arrow displays beginning with the first selected event.
Drag the arrow to the second event you want to select for filtering.
Once the second event is selected, the Throughput Time filter displays with the two selected events populated and the range of TPT times shown.
In the Throughput Time filter, the from and to fields show the two events you selected from your View. Use the dropdowns to the right to indicate if you want to use the first or last occurrence of the event if they occur multiple times during the process.
The time fields show the average, median, minimum and maximum throughput time in days between the two selected events. Use the filter fields below the bar graph to set the time range covered by this filter.
Note
The time range can be set using days, hours, minutes, seconds or milliseconds.
For example, in the screenshot below the TPT filter is updated to only show cases where the throughput time between the “CreateSalesOrderHeader” and “CreatePurchaseOrderHeader” events is between 0 and 365 days.
Also note that the total number of cases and the percentage selected metrics below the time fields are updated based on the filter criteria.
Click Apply to update your View based on the selected filter.
The View is refreshed based on your filter criteria. The applied filter is shown in the upper right above the View. Hover over the filter chip to see the currently applied filter criteria.
To update the filter criteria, click on the filter in the upper right to open the Throughput Time filter window, change your filter criteria and click Apply to update your View.
To remove the filter, click the X on the filter in the upper right corner of the chip.