Color mapping event nodes in Process Explorer and Variant Explorer
Process Explorer and Variant Explorer both offer the ability to add custom coloring to the activity and event nodes in your process graphs. This feature allows you to design and select custom color schemes that can be applied to the nodes in your process graph by assigning colors to individual activities or events to signify a specific meaning. For example, you could choose to color specific events or activities based on the department responsible for those actions or color any nodes you want to monitor in red as an alert or warning.
To create a color mapping for your Process Explorer or Variant Explorer:
Go to yourStudio view and enter the Edit View.
Select the explorer in which you want to add color mapping.
On the Settings tab, go to the Coloring section and click on “Event Coloring”.
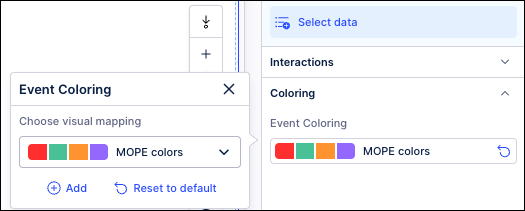
Click Add.
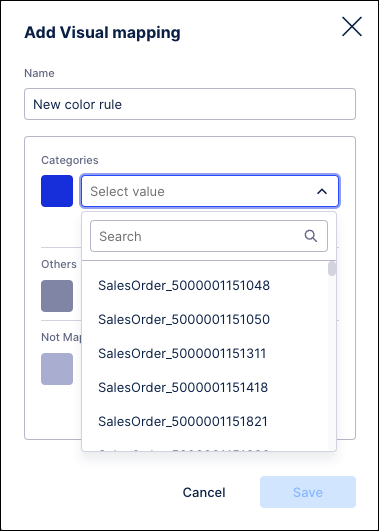
In the Add Visual mapping window, enter a name for this color rule.
In the Categories section, select an event or activity from the dropdown.
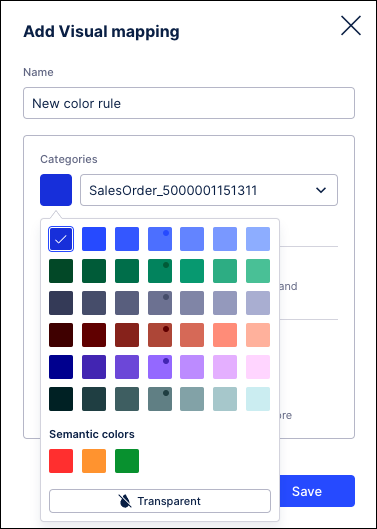
Click the color swatch to the left of the dropdown to assign a specific color.
Click the Add link to save this selection and add another.
Repeat these steps to assign additional values to this color mapping.
Click the text icon to manually enter a name for the selected event or activity.
Click the trash can icon to remove the selected color assignment.
In the Not Mapped section, enable the toggle switch to retain the default colors for any remaining unmapped events.
Click Save when finished. The new color mapping is added to the Event Coloring section and can now be assigned to explorers.
Go to your Studio view and enter the Edit View.
Select the explorer in which you want to assign a color mapping.
On the Settings tab, go to the Coloring section and click on “Event Coloring”.
Use the dropdown to select the color mapping you want to apply to the selected explorer. The selected explorer is refreshed and the mapped colors are applied.
To remove the color mapping and return to the default colors, click on “Event Coloring” and then click the Reset to default link. The selected explorer is refreshed and the default color mapping is applied.
To make changes to a color mapping, click the Event Coloring dropdown and then click the edit icon (pencil) next to the mapping name. If you make any changes to a color mapping, those changes will be applied automatically to any explorers where that mapping is assigned.
To delete a color mapping scheme, click the Event Coloring dropdown and then click the delete icon (trash can) next to the mapping name. If you delete a color mapping, any explorer where that mapping is assigned will be refreshed and the default color mapping will be applied.
The Legend will display at the bottom of the process graph next to the Zoom controls, even if there are no color mappings applied. The Legend will show what events have been mapped to each color for the event coloring assigned to the explorer component. For color mappings that utilize threshold or gradient values, the Legend will show the values assigned as a range of colors. The color swatches to the right of the assigned KPI colors will indicate the event log where the mapping has been assigned.
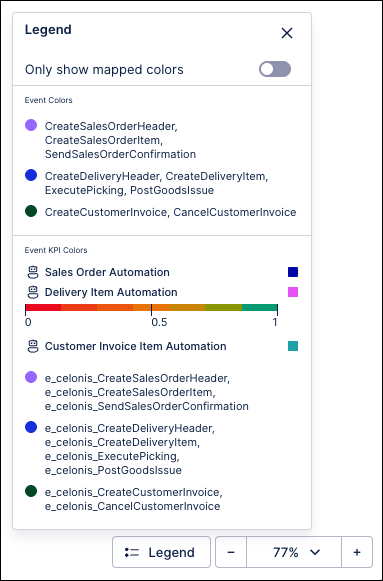 |
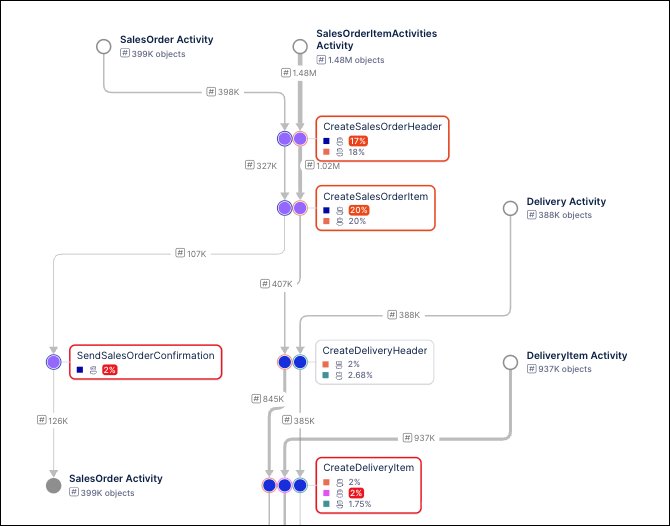
The Only show mapped colors toggle can be used to gray out the events using the default colors to make it easier to identify the mapped elements within the process graph. When this setting is enabled, only the events or activities that have colors assigned will be colored, while all elements of the process graph using default colors will be displayed in gray.
 |