Object Link
Description
The Object Link feature is used to define and manage relationships between instances of different object types within an OCPM data model for analysis of graph data and networks.
This functionality is essential for modeling complex inter-object dependencies, such as linking materials to related materials (as in a bill of materials) or associating a purchase order item with a corresponding delivery order. This means, Object Link is one of the essential features to building the digital twin of your organization.
Once configured, Object Links provide a framework to model and analyze flows between object instances as a graph. By explicitly modeling the relationships between object instances, an Object Link does not require the presence of traditional cases or events. These explicit relationships are provided as dedicated mapping tables, which build a graph or network that can be accessed, traversed, and analyzed via Object Link framework.
To use Object Link, the source data used to generate the graph must be marked in the data model editor, after which the following functions are available:
LINK_FILTER filters along the links of the Object Link graph.
LINK_OBJECTS returns all objects of an input column that are part of the Object Link graph.
LINK_SOURCE / LINK_TARGET / LINK_ATTRIBUTES allows to access the source or target row from Object Link links.
LINK_PATH creates an activity table containing a case for each traversed path in the Object Link graph.
LINK_PATH_SOURCE / LINK_PATH_TARGET allows to access link attributes of
LINK_PATHresults.
There are two different types of Object Link:
Object Link: Recommended configuration as it provides more features, and is compatible with OCPM setups. For more information, see Configuring Object Link.
Signal Link: Deprecated legacy configuration that is no longer actively supported. For more information, see Configuring Signal Link.
Configuring Object Link
Object Link is used to model relationships between objects. These relationships are explicitly defined as links in one or more separate tables, called mapping tables, where each row represents one link. Mapping tables must contain columns with identifiers for the rows of the tables you want to connect, at least one for the outgoing part of a link and one for the incoming part of a link. Additionally, the tables you are linking must also contain a column with these identifiers. All identifiers for each connected table must be unique.
The following two figures show an Object Link configuration via a mapping table and the resulting Object Link graph:
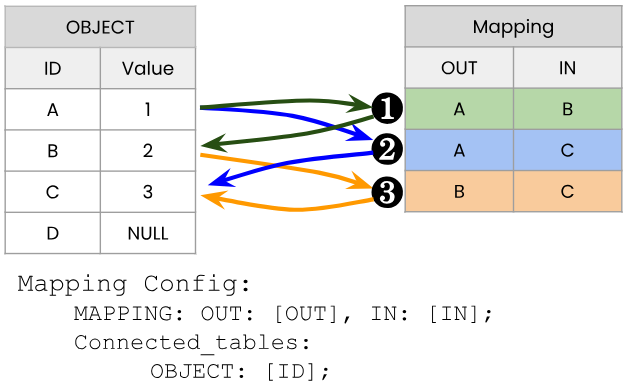
Object Link configuration with a mapping table. Every row in the mapping table corresponds to one link in the graph.
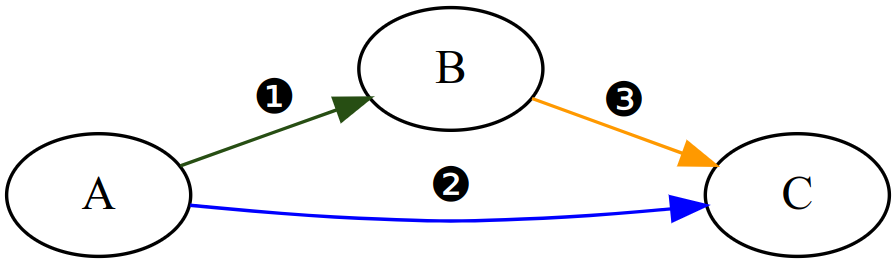
The graph that was created based on the Object Link configuration. Note that object D is not part of the Object Link graph as it is not mentioned in the mapping table.
Warning
As mentioned earlier, connected tables must have unique identifiers. To fulfill this condition, multiple columns can be specified to identify the connection. For example, if column ID of Object contains a duplicated identifier, an error will be emitted. As a solution, a set of columns can be used as identifiers.
The following figure shows the configuration with two mapping columns with multiple connected tables:
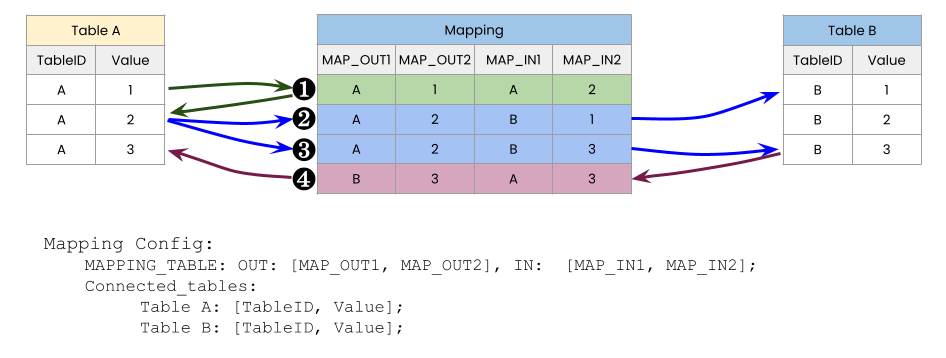
This results in an Object Link configuration with multiple connected tables utilizing multiple outgoing and incoming columns as identifiers in the mapping table:
Object Link can be configured in the data model editor via the Object Link tab. If the Object Link tab is not present, request Object Link from the service desk.
Warning
Once Object Link is configured the data model must be reloaded for the changes to take effect.
Configuring Signal Link
Warning
Signal Link is deprecated, and is no longer actively supported.
A Signal Link is configured in the data model editor via the Object Link tab (if not present, request Object Link from the service desk), and is used to model relationships between activities instead of objects, and unlike Object Link, only signals can be used to create the configuration, mapping tables are not supported.
Other differences between Signal Link and Object Link include:
The LINK_PATH operator does not support Signal Link, only Object Link.
The behavior of the LINK_FILTER operator differs for Signal Link and Object Link.
For more information, please refer to the respective documentation of the operators.
Signals are identifiers within rows that indicate which rows of tables are linked. To create the Signal Link configuration with signals, we need to define the columns that identify the outgoing signals and incoming signals of a table, as in Object Link. The columns must be of the same data type, and if two activities have an identifier in common, they will be connected by a link. Signal Link can also be configured in the data model editor via the Object Link tab.
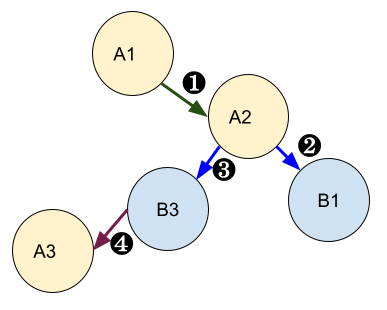
The following figure shows an example with the same graph as before, but with Signal Link and on activity tables.
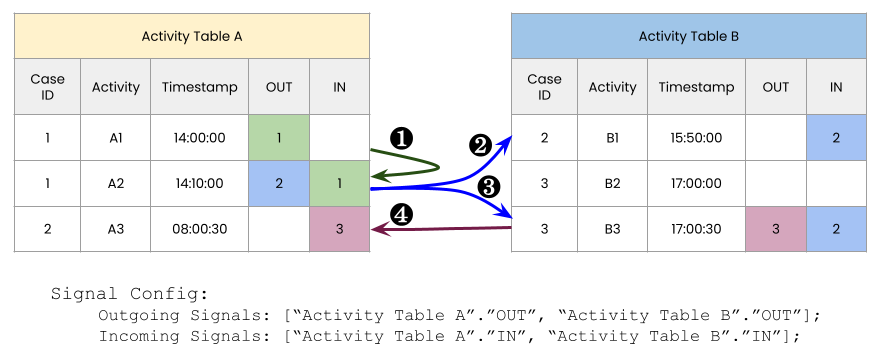
One data model with two activity tables and three signals. The arrows between the tables show the links in the graph.