Analysis - World map
Analysis - Maintenance only
Effective August 1st 2025, Analysis features can no longer be purchased as part of a Celonis Platform license. Celonis continues to maintain Analysis (by fixing bugs and ensuring that performance remains strong) but no further feature development will take place.
You can migrate your existing Analysis assets to our enhanced Studio Views, giving you access to our intuitive View creation capabilities. To learn how to migrate your existing Analysis to Studio Views, head to: Migrating Analysis to Views.
And for an overview of our enhanced Studio features, see: Studio feature availability matrix.
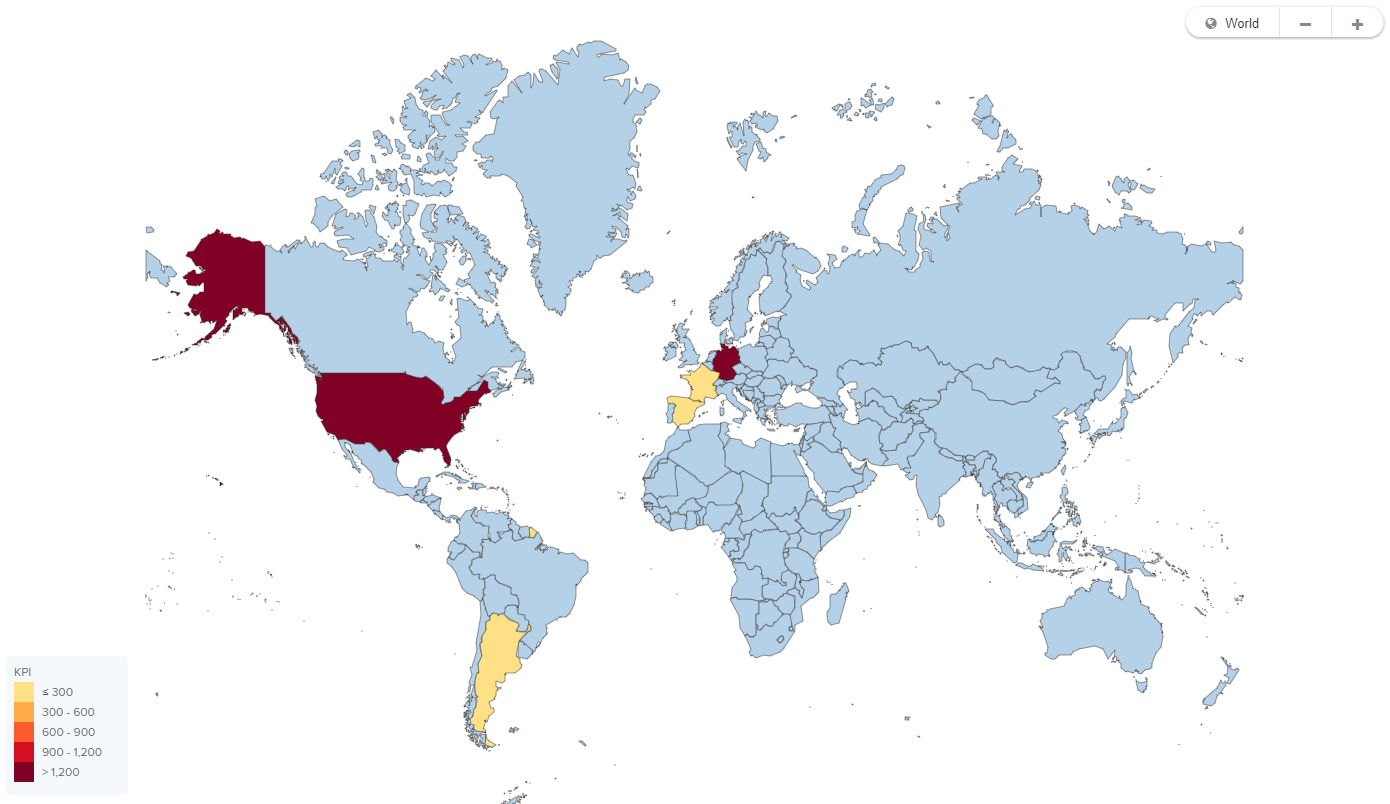
You can use the world map to visualize geo-locations of your process data.
You can explore data points and answer questions such as 'which vendors are close by and have a good on-time delivery rate?'
You can compare regional differences and discover insights from the local context.
Please note that the maximum number of locations that can be shown on the world map is 1000
World map options
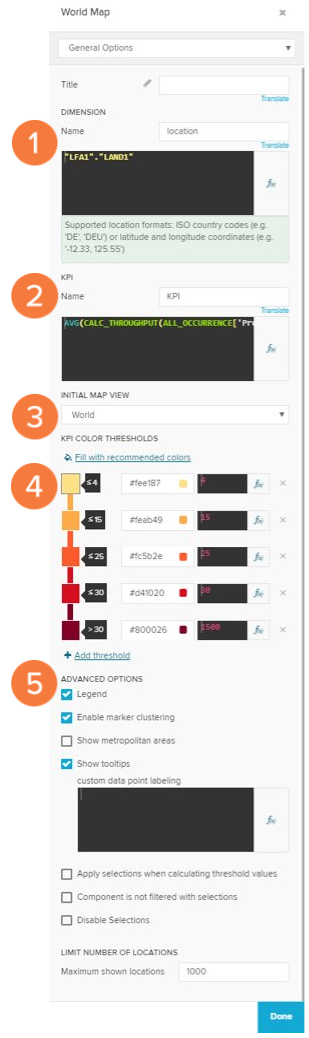
The general options for the world map are:
Location dimension. This dimension expects location as input either as country code ('DE','US') or as geo-coordinates ('48.1,11.6').
The KPI you are interested in.
You can switch between different default map views (world, europe,..).
Define the color thresholds that are going to be shown on the world map.
Advanced options for further configuration of the map.