Add KPI Splits
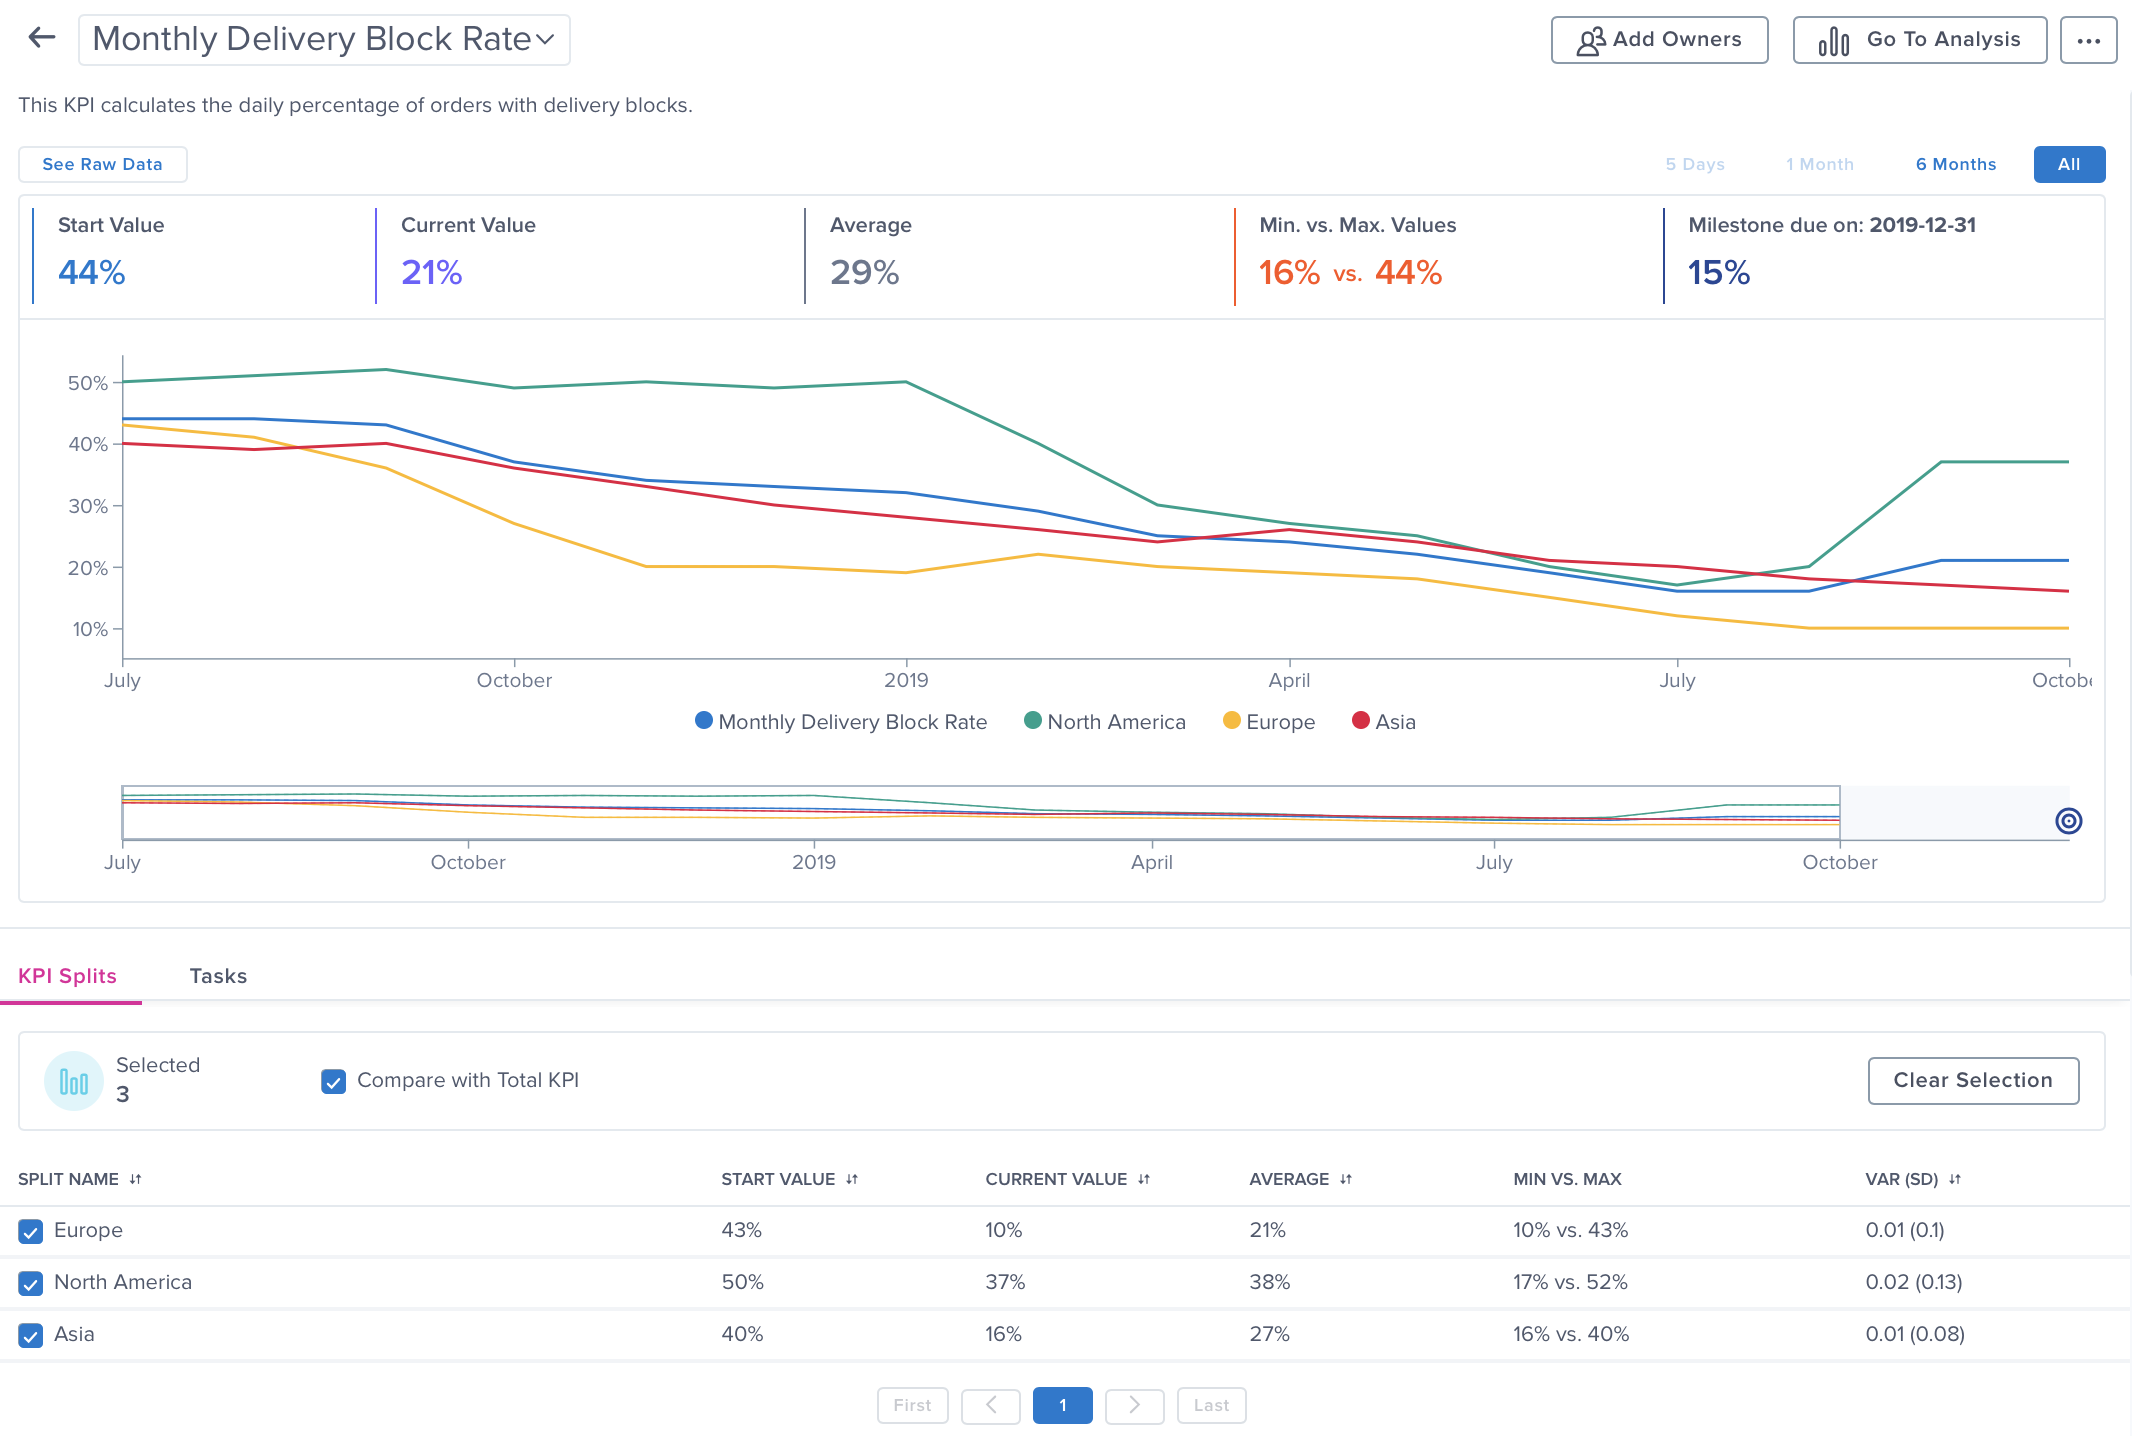
When looking at a KPI, it can be very interesting to look at the KPI breakdowns and benchmark different splits against each other to identify root causes of the overall KPI fluctuation.
In Transformation Center, you are able to see the relevant statistics per breakdown in the lower section of the KPI detail page and select the splits you would like to additionally visualize in the chart.
Users with analyst/admin roles and KPI editing permissions are able to set up KPI splits.
 |
How to Add KPI Splits
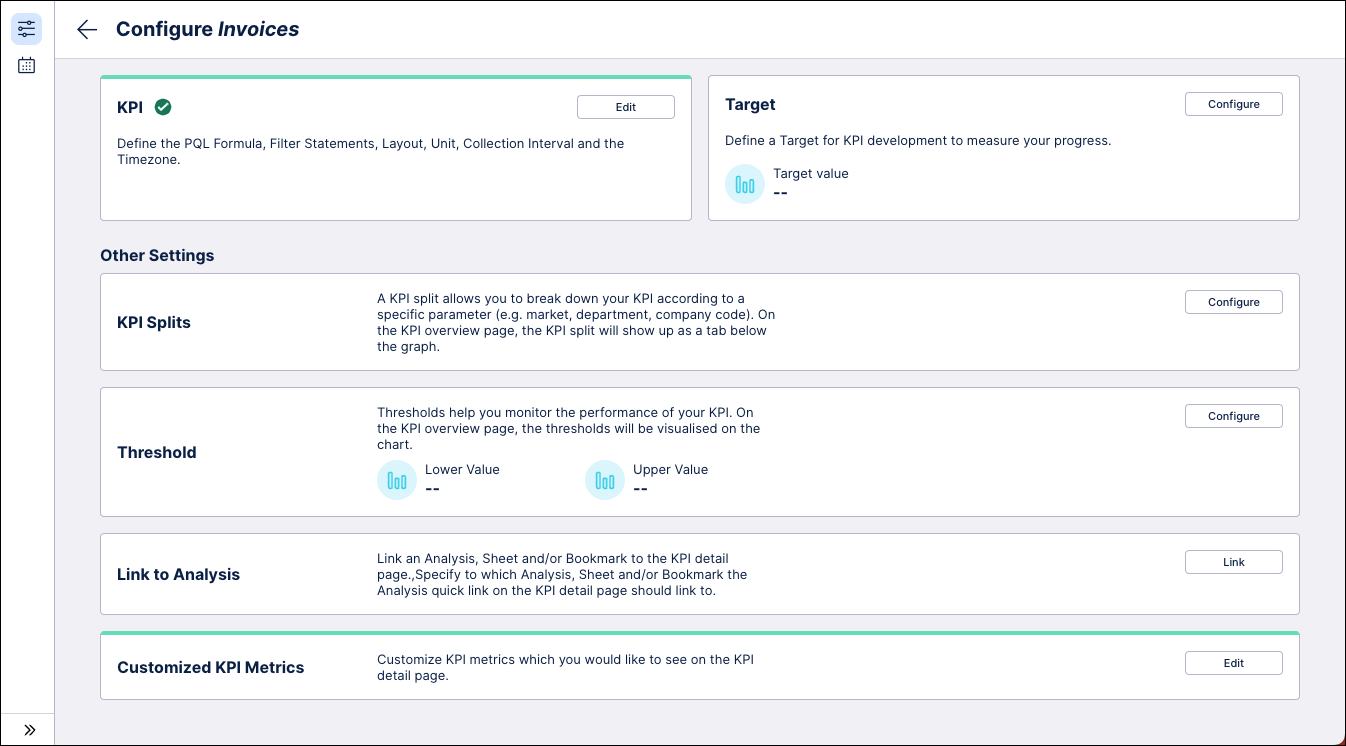
Go to the KPI configuration.
Click the Configure button in the KPI Splits section.
Adding KPI splits for Dynamic KPI
Choose the data model column based on which you want your split to be created. In the case of a dynamic KPI, all items in the column will be added to the split automatically.
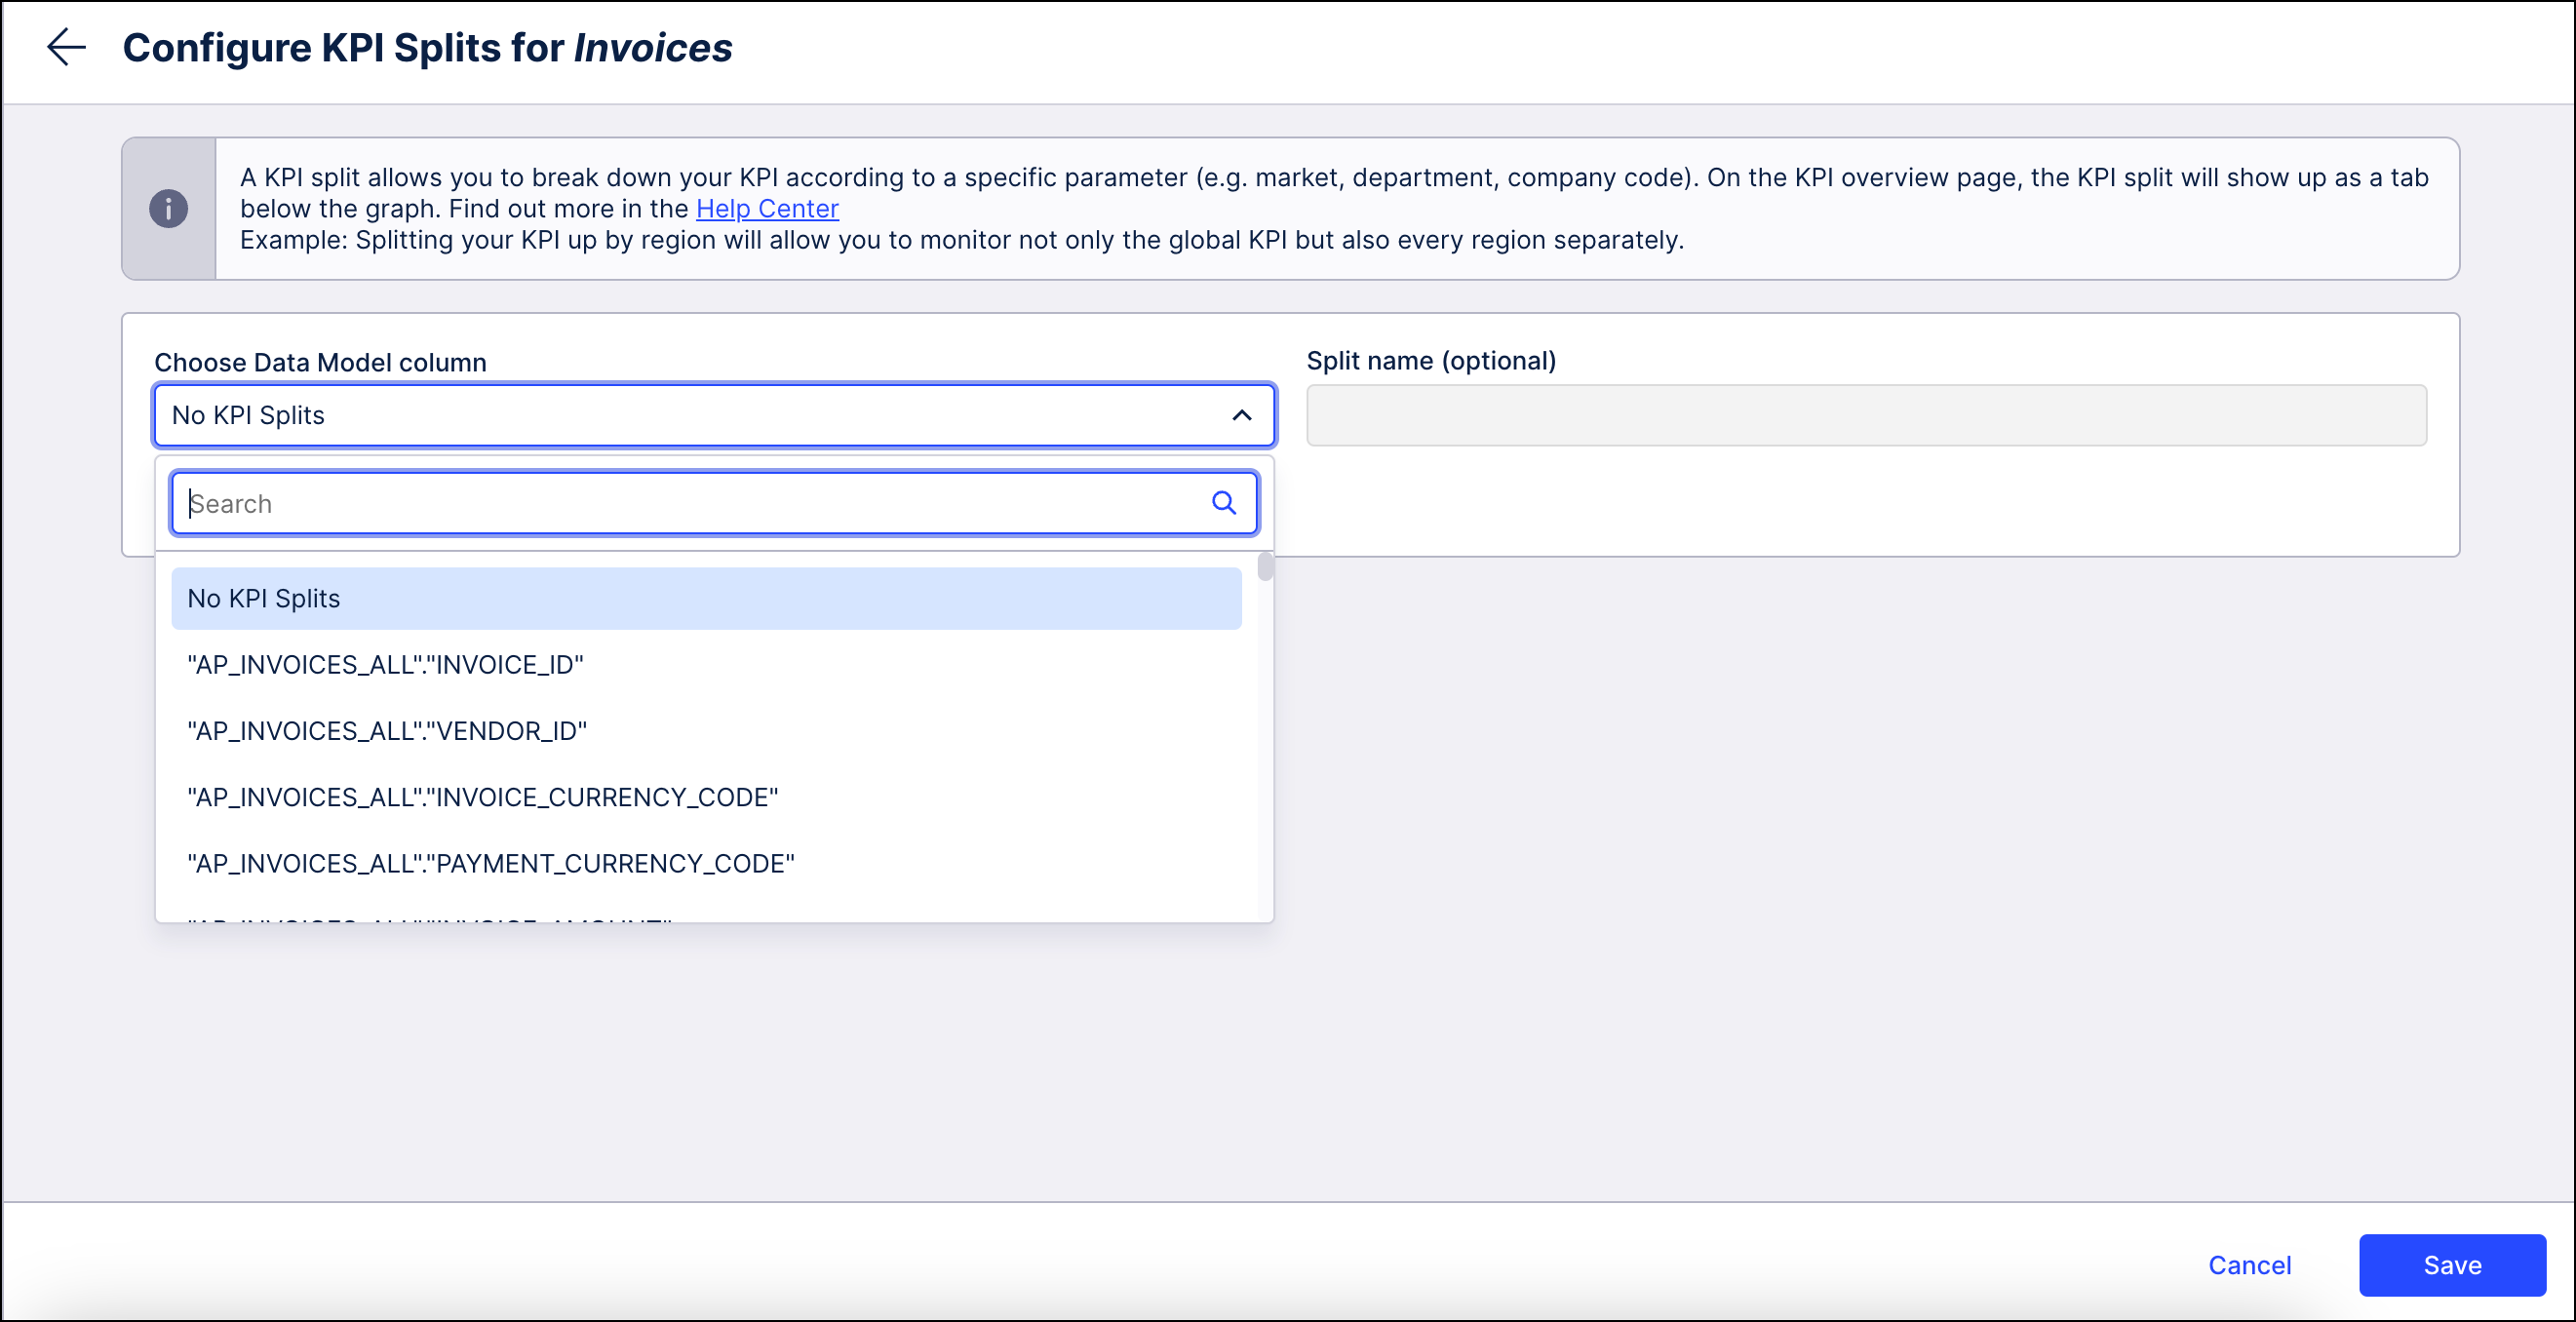 |
Add a name for the split (optional) and then click Save.
Adding KPI splits for Logbook KPI
Choose the data model column based on which you want your split to be created.
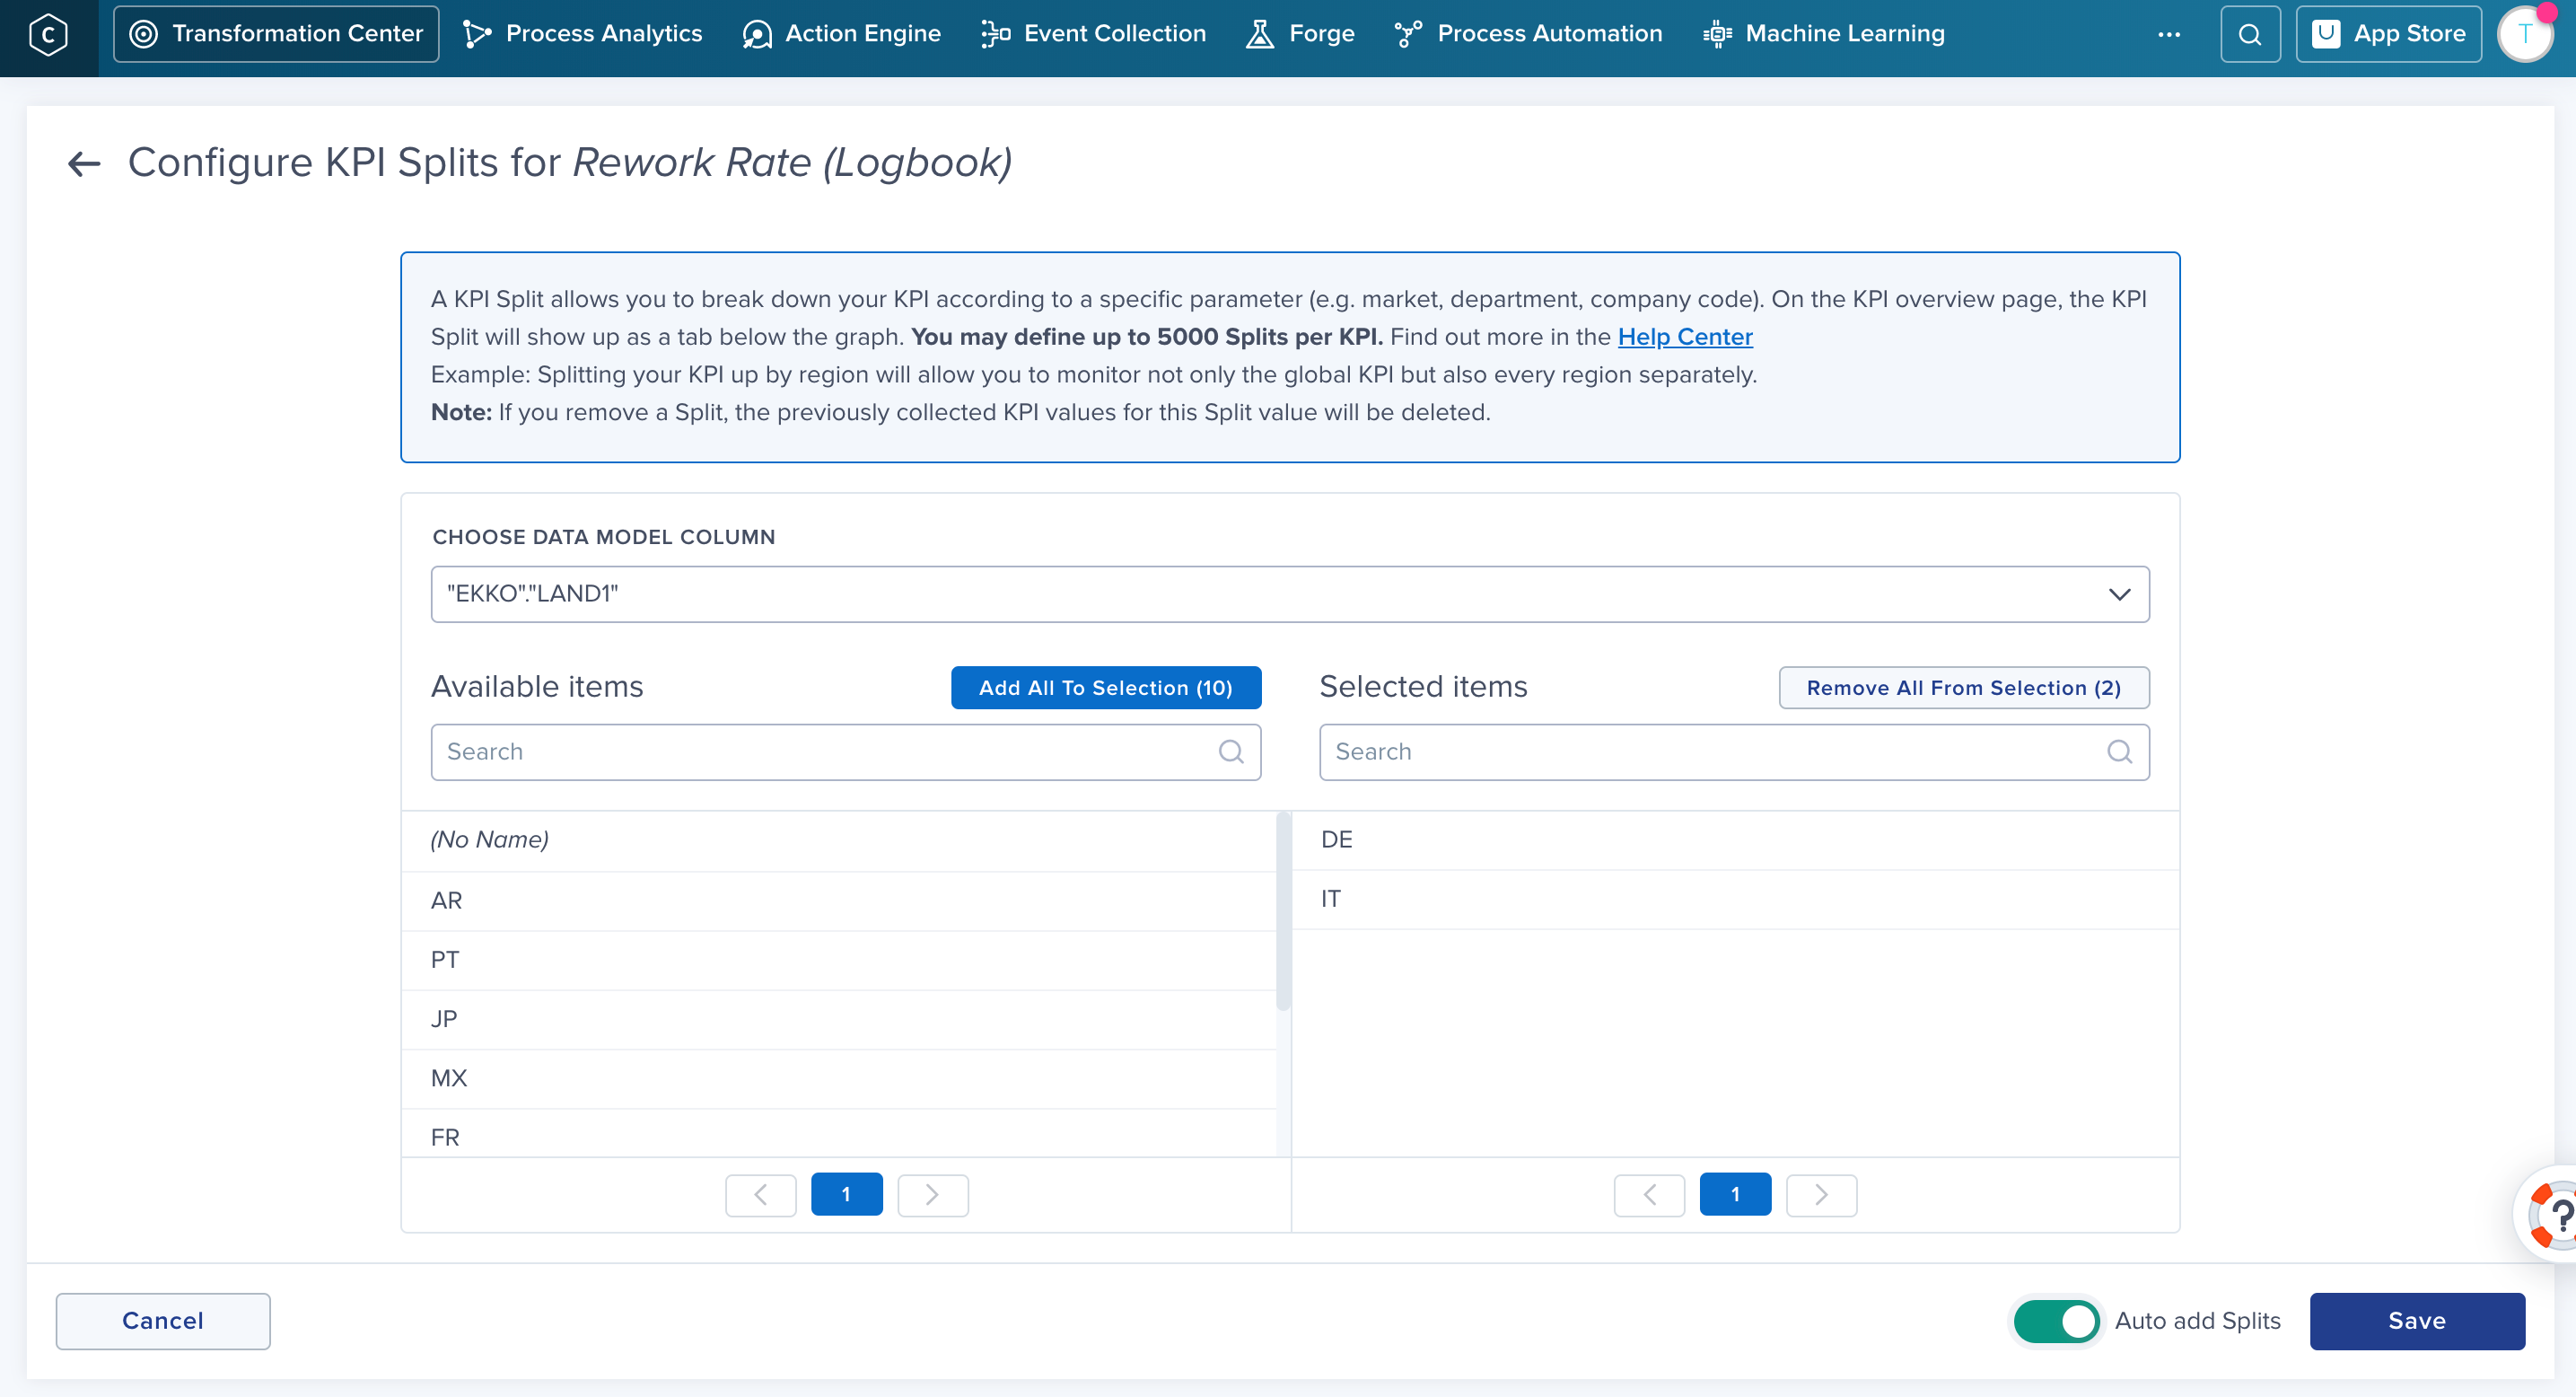 |
For a Logbook KPI, you can include up to 5000 items from the selected column.
Tip
Toggle the Auto add splits option to on to include new items automatically.