August 2025 Release Notes
STUDIO Improved chat experience in Process Copilot (2025-08-28)
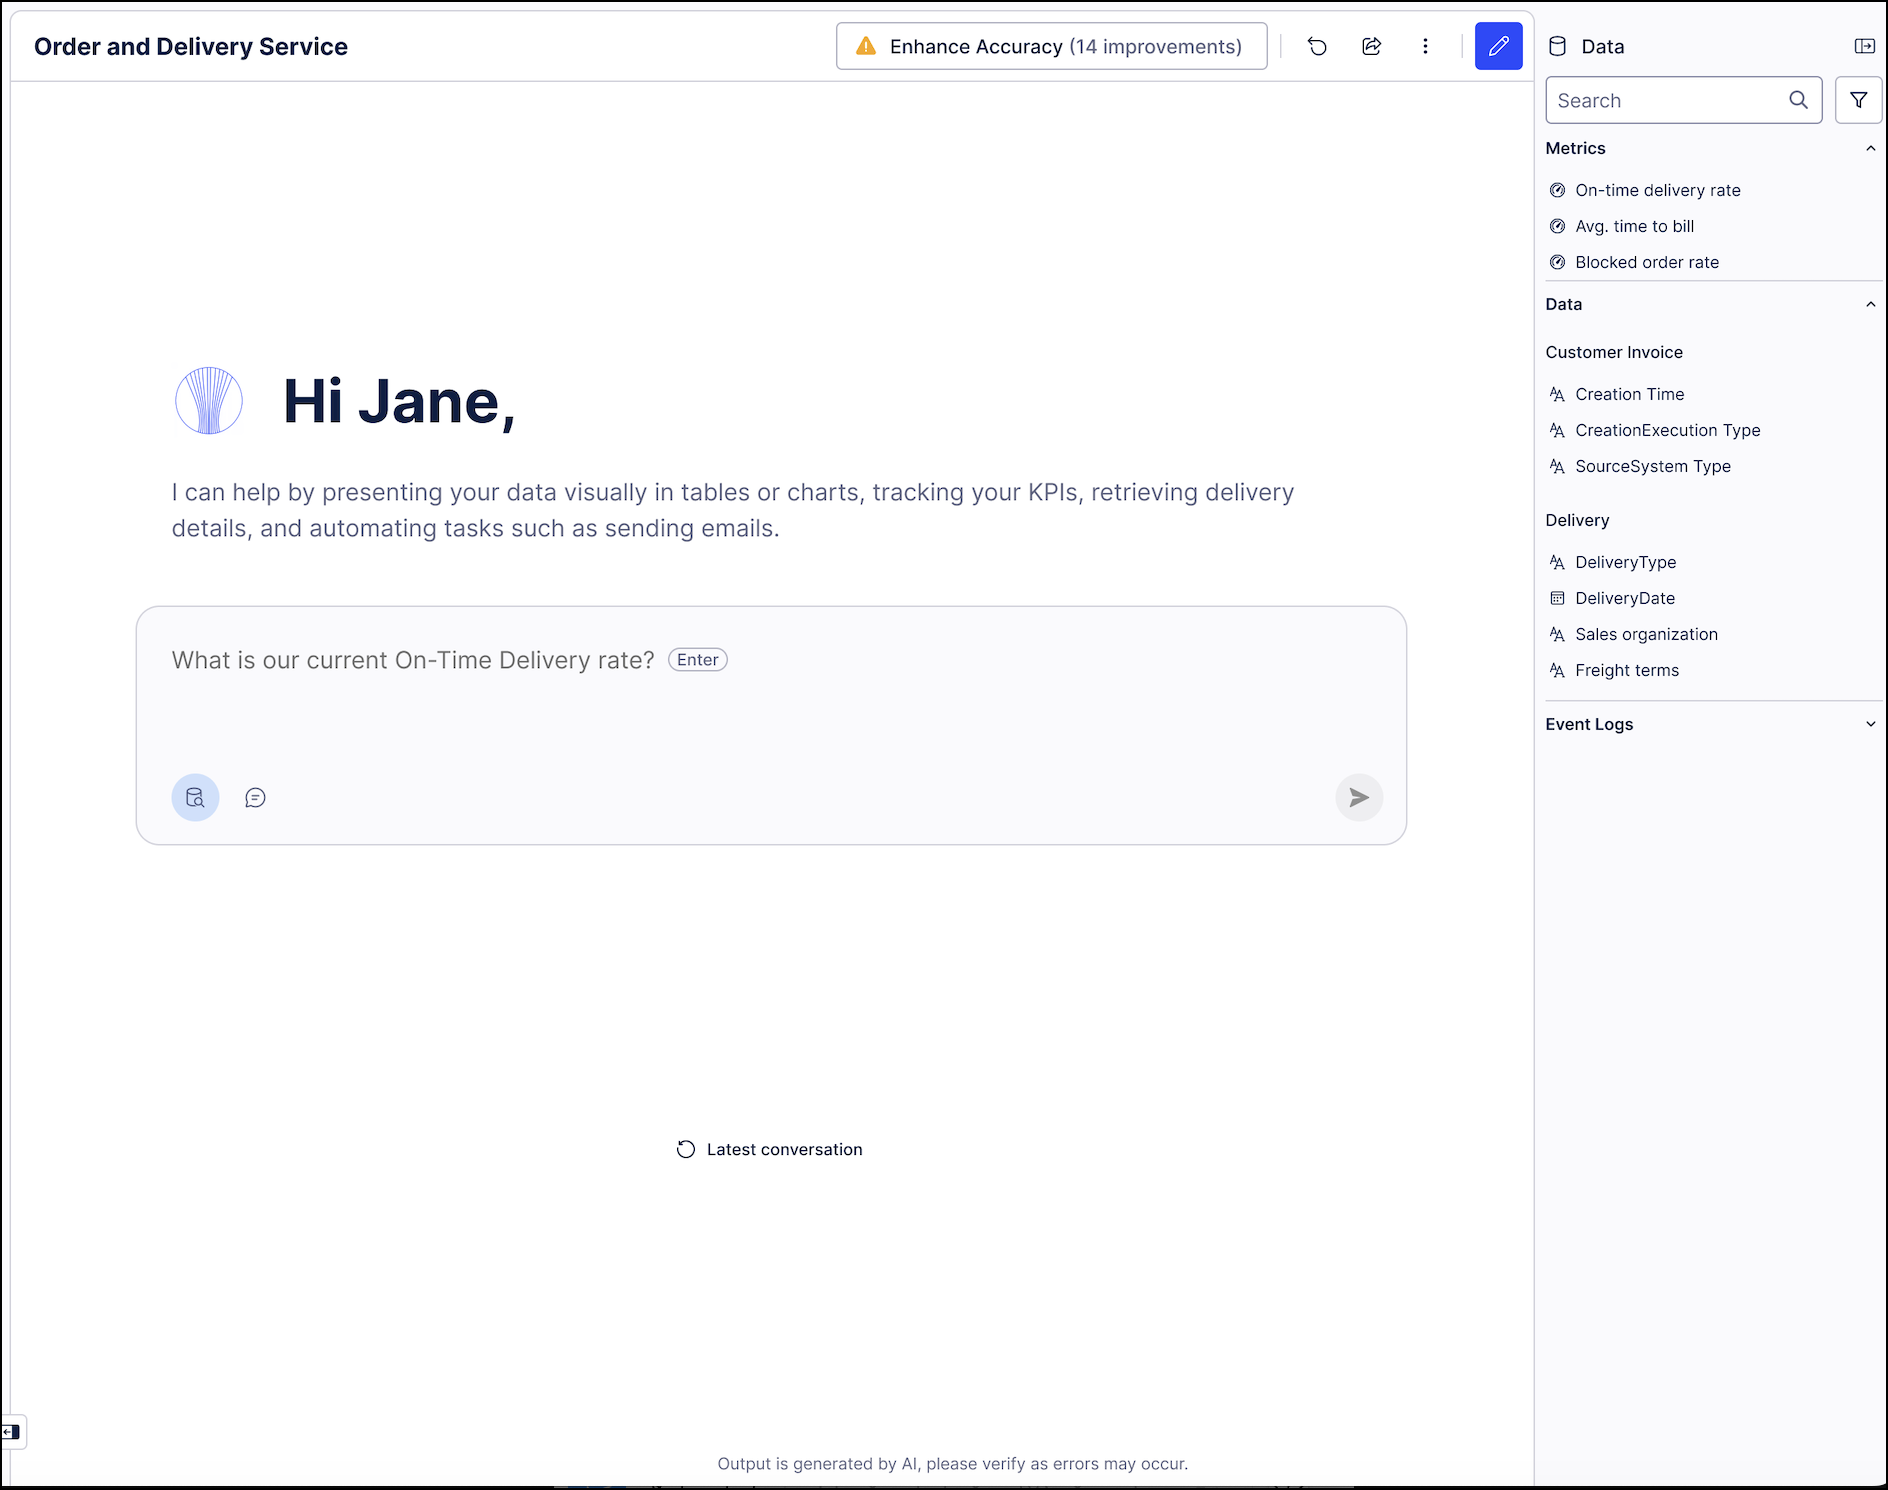
The Process Copilot chat screen has been updated to help users better understand what each Process Copilot can do and help users engage more effectively from the start.
What is changing and how does it help?
Previously, many users struggled with knowing how to effectively interact with a Process Copilot, often asking questions outside its capabilities. These updates make the Process Copilot's purpose, data access, and capabilities immediately clearer, improving usability and reducing confusion.
 |
With this release:
Each Process Copilot shows a clear, customizable task summary on the welcome screen;
Example questions are central to the updated experience and rotate in the prompt input for easy access;
Users can quickly check what data the Process Copilot is configured to use via a new action button in the prompt input;
Low-value UI elements like prompt templates, generic intros, and KPI cards have been removed for a cleaner interface.
These updates make it easier for users to get value from their Process Copilots without needing additional guidance or setup.
DATA INTEGRATION Inactive Data Model suspension (2025-08-28)
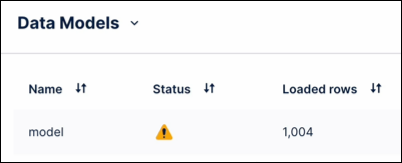
With this release, Data Models that haven't been referenced in PQL for 40 days or more will be suspended, preventing unnecessary load on the Celonis Platform. When a Data Model is suspended, the data can still be accessed through assets and PQL but the data is no longer up-to-date.
Once a Data Model has been suspended, you can then manually reactivate the load. When a PQL query then gets triggered, in can take up to an hour until the Data Model load restarts.
Before a Data Model is suspended, both Analysts with 'Manage Data Pool' permissions and the original creator of the Data Pool are sent email notifications informing them of an upcoming suspension. These notifications are sent seven days, two days, and then shortly before the Data Model is suspended.
STUDIO Boxplot chart component added to Views (2025-08-28)
You can now display your data in a Studio View using either horizontal or vertical boxplot charts.
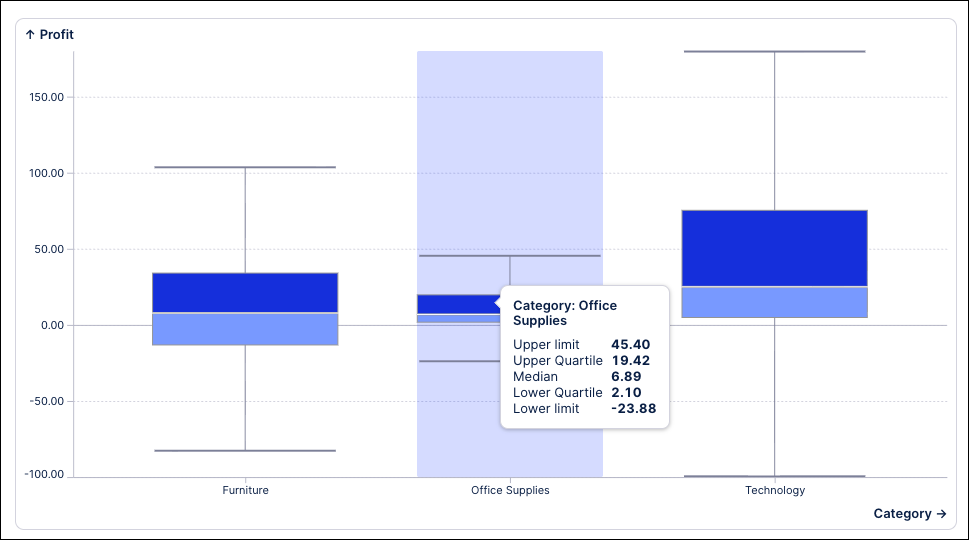
A boxplot chart (sometimes called a box-and-whisker plot) visualizes the distribution of numerical data, making it especially useful for comparing multiple groups. Boxplot charts offer a quick, high-level view of a dataset’s symmetry, skewness, spread, and outliers. With a glance, you can see where most of the values cluster and easily compare patterns between different groups.
In Studio Views, boxplot charts are configured using a minimum of one metric and one dimension. In this example, the boxplot shows the distribution of profit (Y-axis) across product categories (X-axis):
For more information about creating and configuring a boxplot chart for your Views, see: Boxplot.
STUDIO PQL editor added to select Knowledge Model entities (2025-08-28) - Public Preview
This feature is currently available as a Public Preview only
During a Public Preview, only eligible customers can access this feature. Additionally, there may be minor updates to the functionality and design of these features when they are released in General Availability.
For more information about our Public Preview releases, including the level of Support offered with them, see: Feature release types.
You can now use the PQL editor when creating and editing the following PQL-based Knowledge entities: Auto-generated attributes, calculated attributes, filters, and KPIs.
These improvements make working with PQL queries faster, clearer, and more powerful across the platform. They also bring the following benefits:
Pre-save validation: Calculated attributes are now validated before saving.
Improved readability: Display data appears in the sidebar for quick reference.
Enhanced variables: Easily access and apply enhanced variables during PQL query editing.
Flexible entity creation: No more single-column restrictions when creating new entities.
To learn more about creating Knowledge Models, see: Knowledge Models
And for an overview of the PQL editor, head to: PQL editor
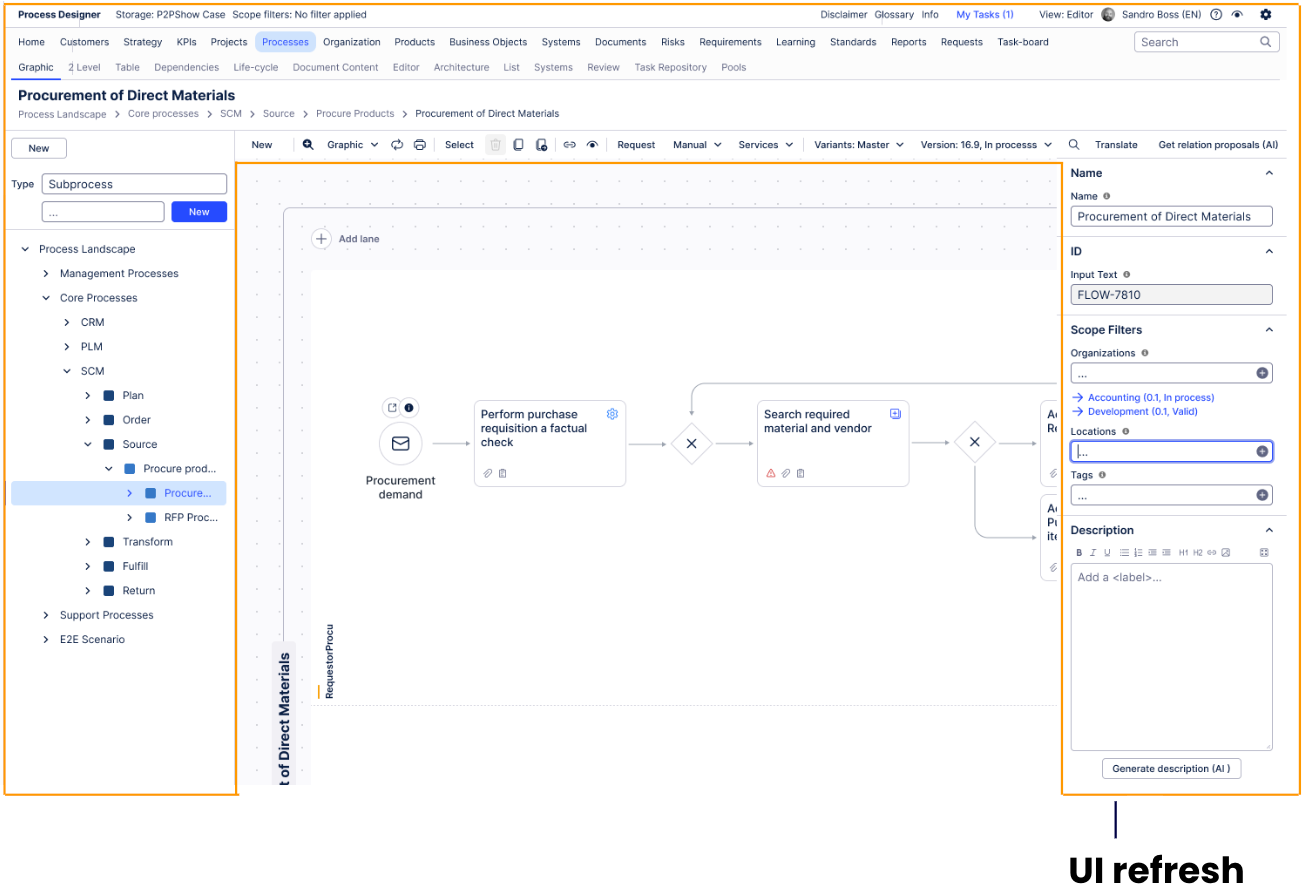
PROCESS DESIGNER Improved BPMN 2.0 conformance and user experience (2025-08-26)
We're introducing a new editor for Process Designer, which will offer an improved modeling experience and BPMN 2.0 conformance. This new editor will support pools, lanes, message flows, and annotations. It will also allow for inline editing and indicating type, markers and related objects. Users can choose which editor to use, with no migration to the new editor needed. For details on activating the new editor, see Improved modeling experience (Canvas app) (Public Preview) below.
 |
In addition to the new editor, we're releasing a refreshed look for Celonis Process Management. This new look will ensure CPM is more aligned with the rest of the Celonis Platform. This is a cosmetic change and will not affect existing functions or information architecture.
Note that customers with existing customization set up for their CPM workspace will remain untouched.
The new look affects the following areas:
 |
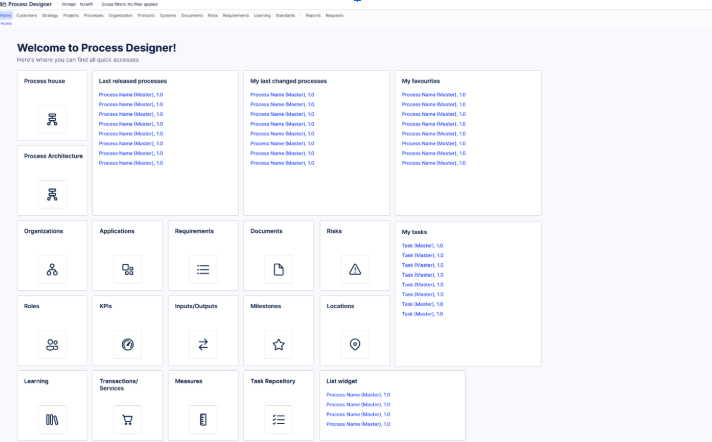
Homepage
The default icons for the homepage tiles will be updated to a new, modern set.
 |
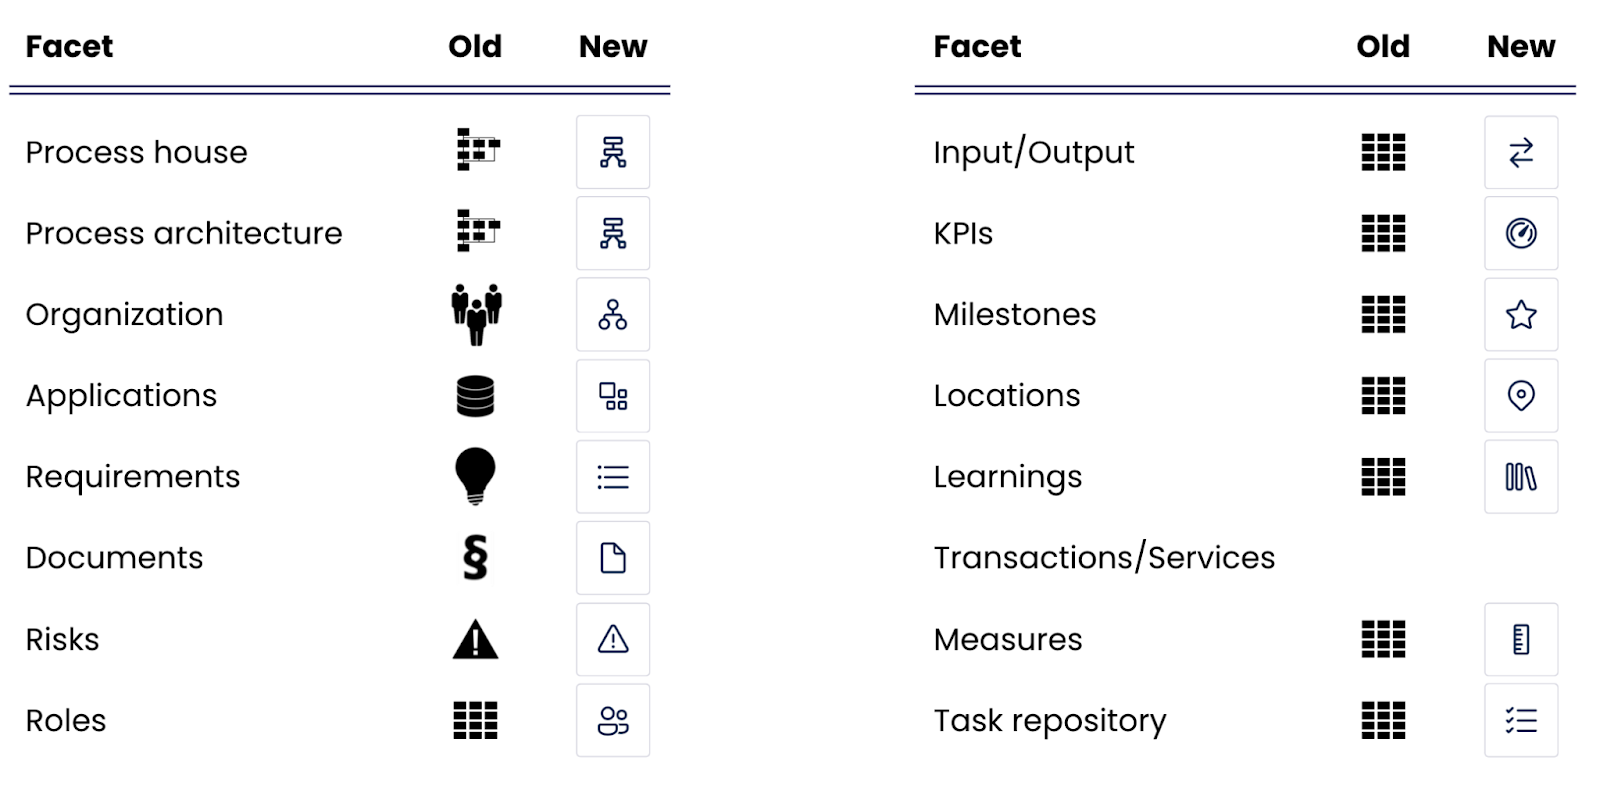
Below is an overview of how the icons have been modernized:
For accessibility, we recommend existing customers update colors and fonts on your homepage. This ensures a consistent user experience.
Page
Background color: #eaeaea
Tile
Background color: #FFFFFF
Text color: #0A1F44
New customers will not have homepage tile colors automatically assigned. Customers can still customize tiles as desired.
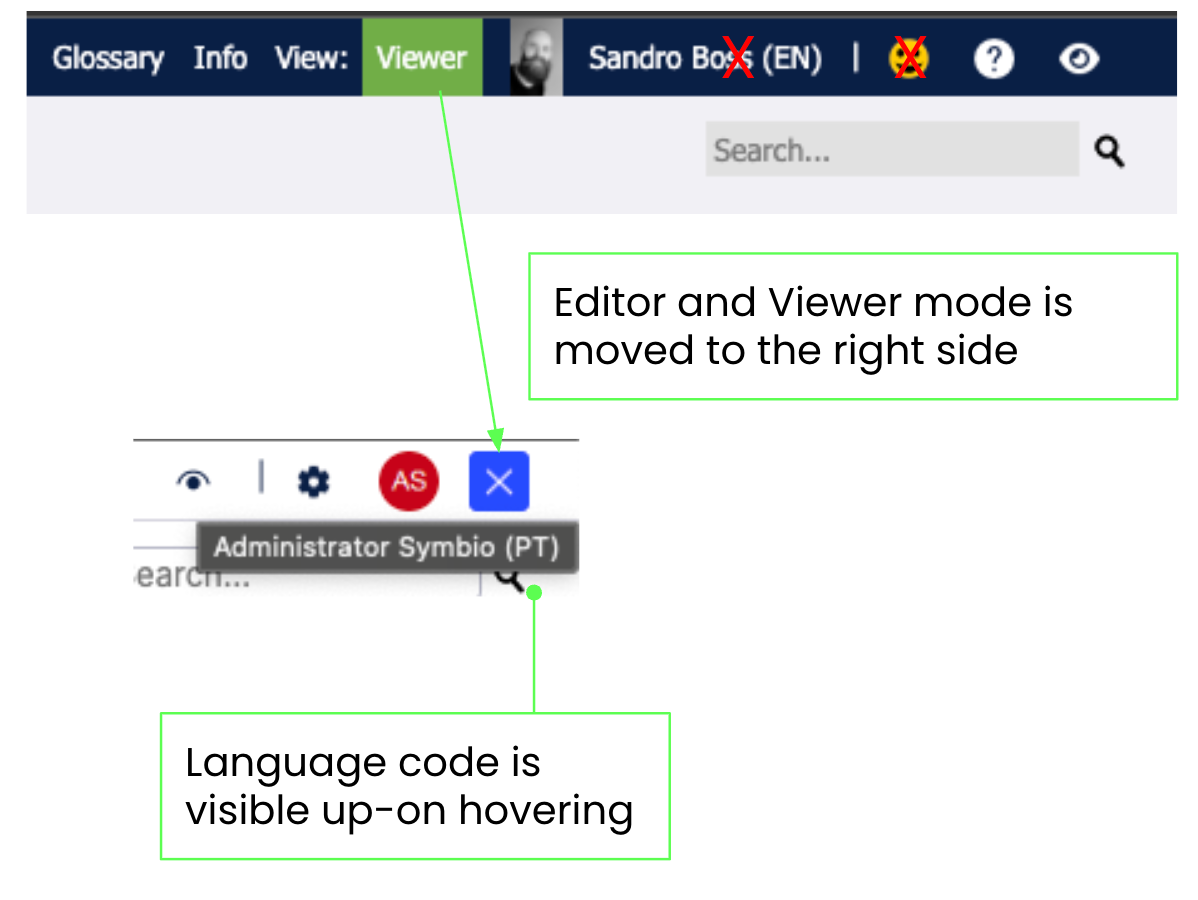
Navigation
The Editor and Viewer modes are now conveniently located on the right side of the screen, allowing you to toggle between building and viewing your models. This streamlines your workflow by keeping key functions readily accessible. You can enter either mode by clicking either the pencil or X icon on the top right of the screen.
 |
We've improved accessibility for color customization. Previously, customizations were not applied to icons in the menu. This made them difficult to read. To fix this, we have now made its so that icons have a white background.


Mandatory fields are no longer displayed in orange, but in solid black.
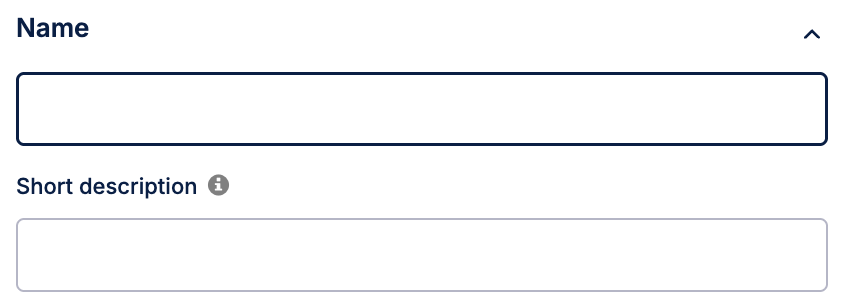 |
This feature is currently available as a Public Preview only
During a Public Preview, only eligible customers can access this feature. Additionally, there may be minor updates to the functionality and design of these features when they are released in General Availability.
For more information about our Public Preview releases, including the level of Support offered with them, see: Feature release types.
The new modeling experience for process facets enables you to build BPMN 2.0 compliant diagrams more efficiently.
Model collaborations using pools, lanes, and message flows.
Work faster with inline text editing and clear visual indicators for element types and markers.
Add clarity with annotations.
This feature is only available to Celonis Process Management customers that already use Process Navigator. Admins can activate it by doing the following:
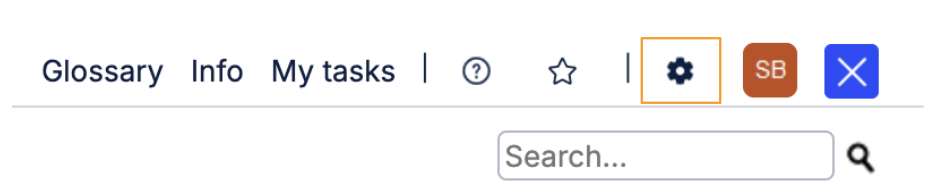
Log into Process Designer. In the top navigation, click the gear icon to access the Admin area.
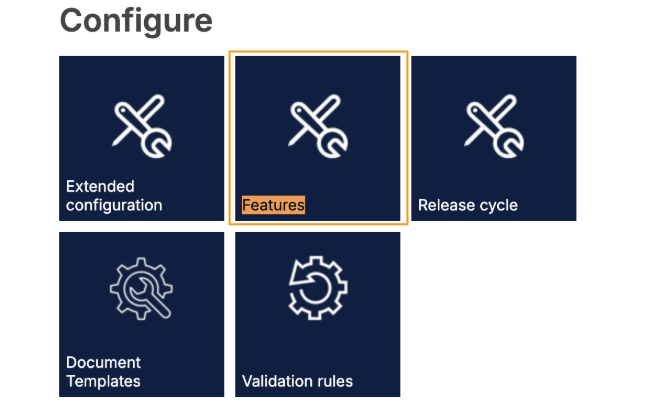
Under Configure, click the Features tile.
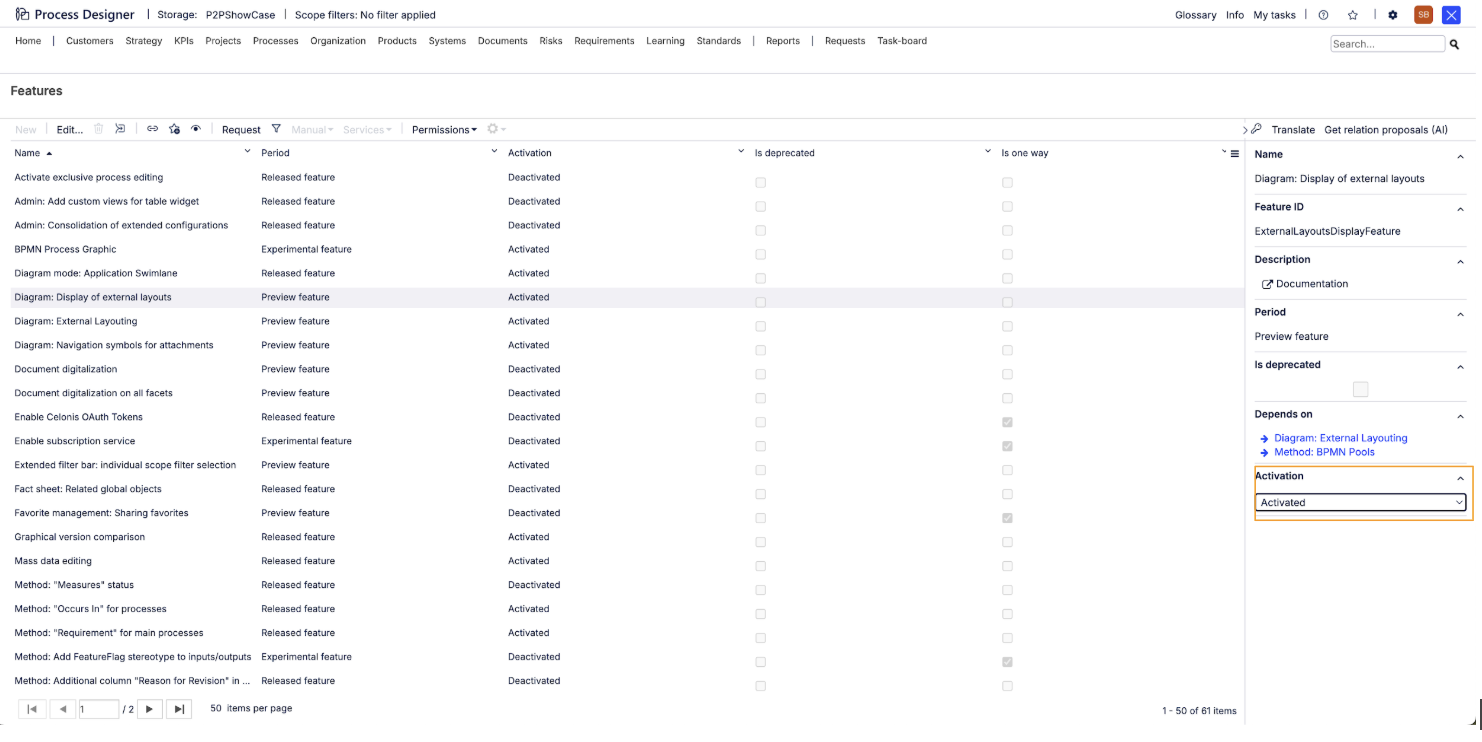
In the features list, search for Method: BPMN Pools; Diagram: External Layouting; and Diagram: Display of external layouts and set each one to Activated.
Note
Bulk editing, Navigation, Black Box Pools, Groups, and re-ordering gateway conditions are not yet supported.
Access
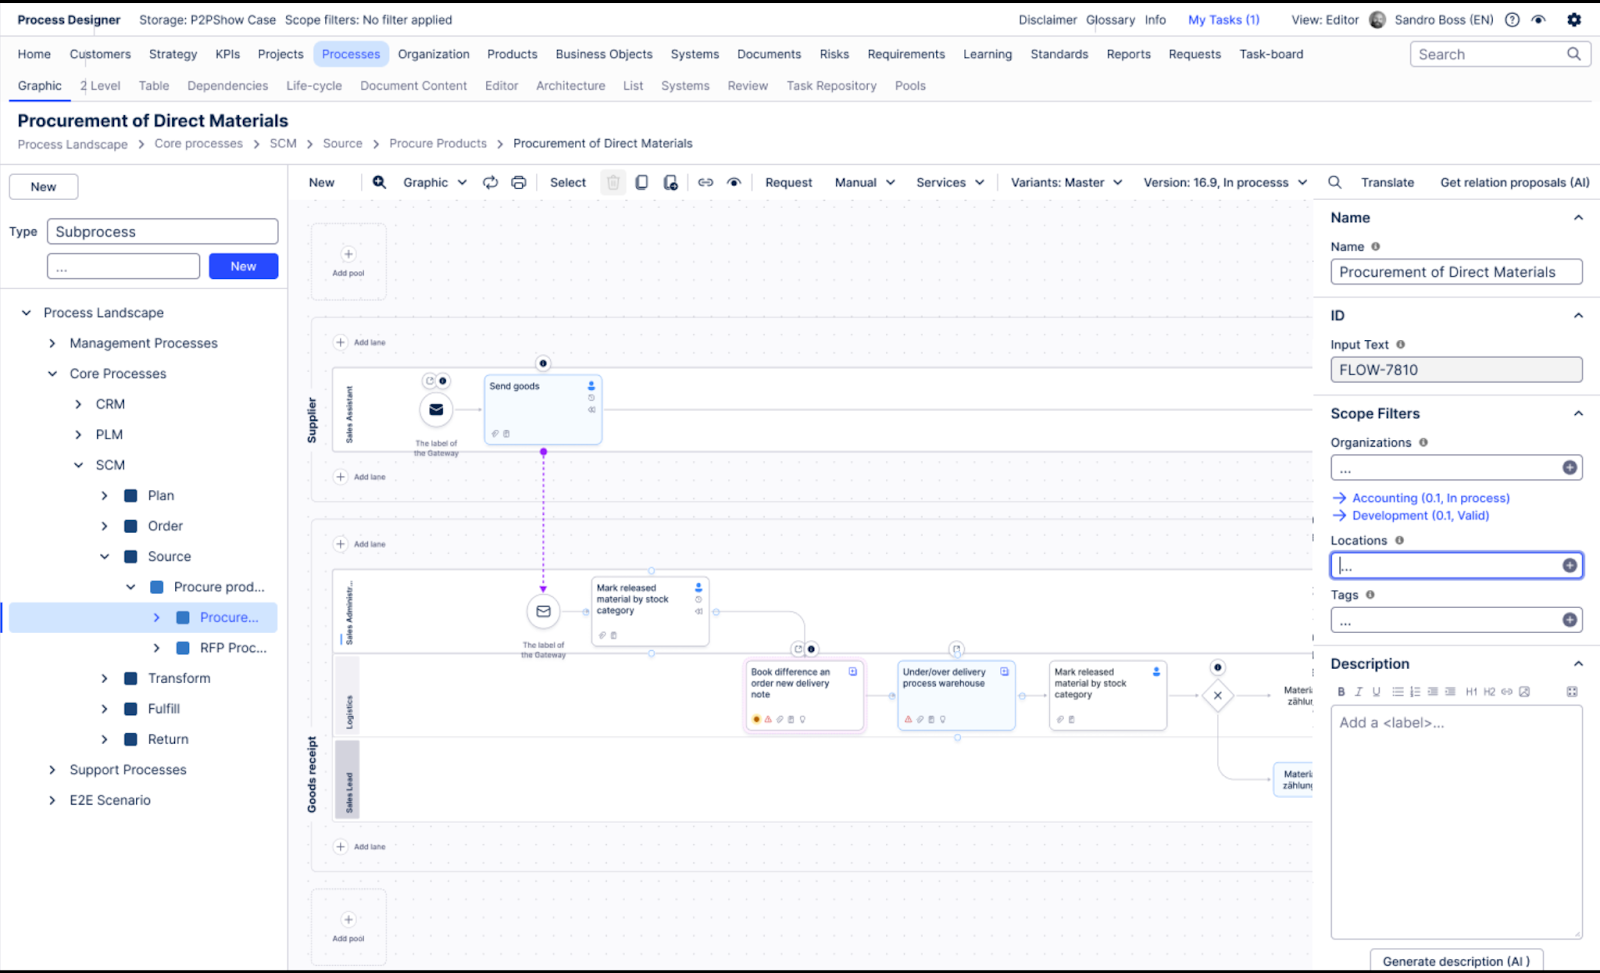
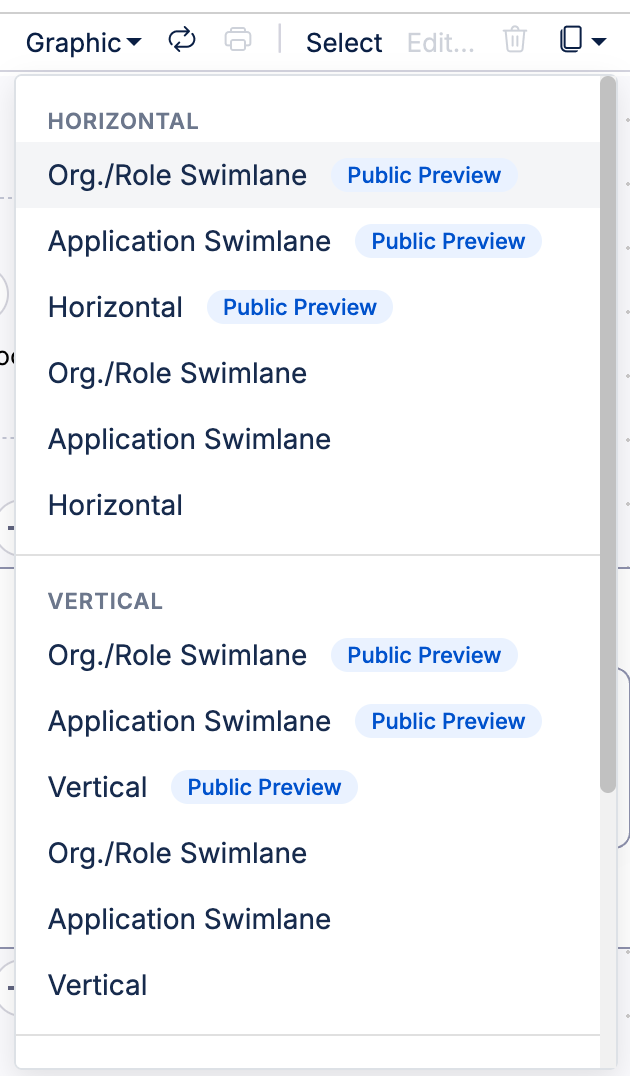
To access the public preview of our new modeling experience, go to a subprocess and open the Graphics dropdown. You'll see a list of views. Those included as part of the new modeling experience are labeled Public Preview.
 |
Features
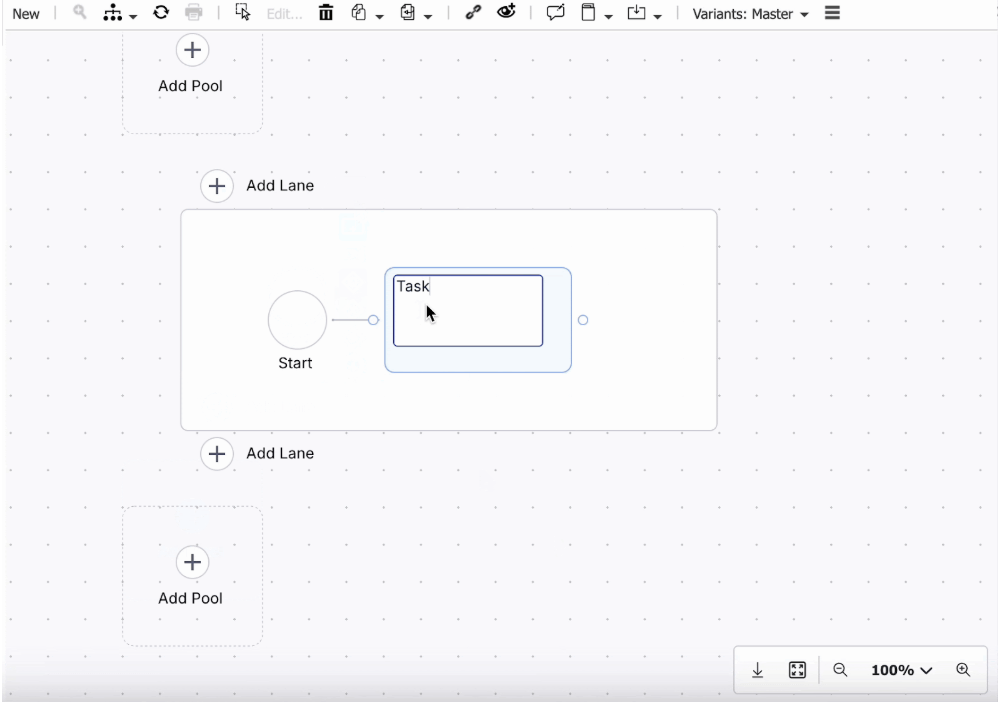
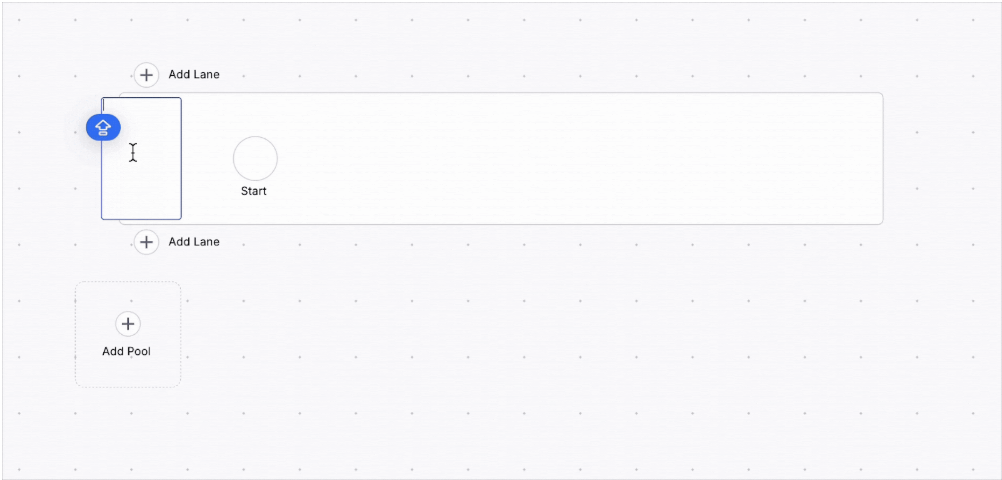
Edit shape labels
Authors can edit shape labels faster than ever. Direct, click-to-edit functionality streamlines your modeling process.
 |
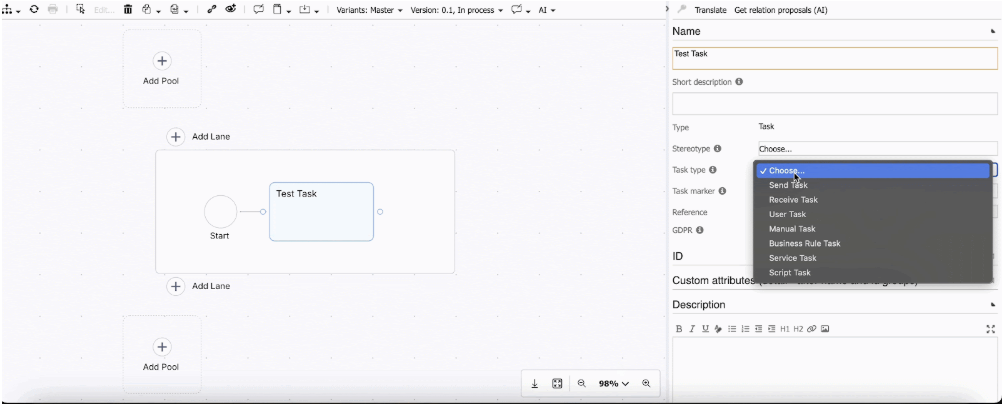
Enhanced task view
With the enhanced task view, authors can now see task types, markers, and related object information directly within the task itself.
 |
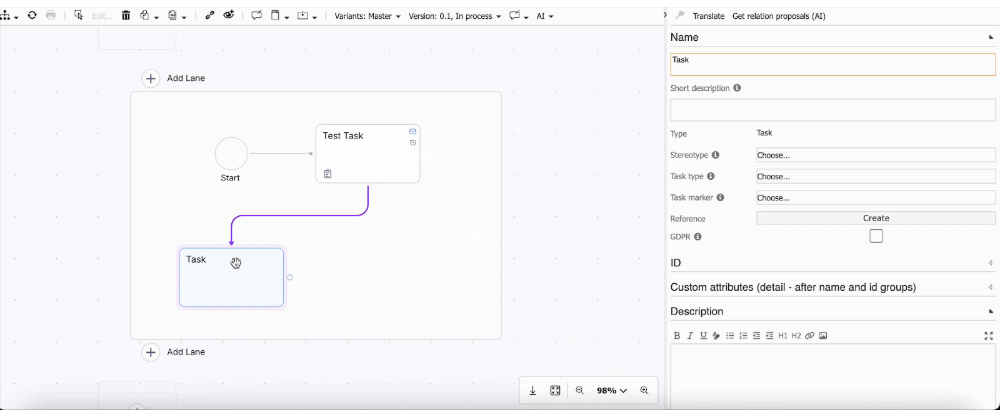
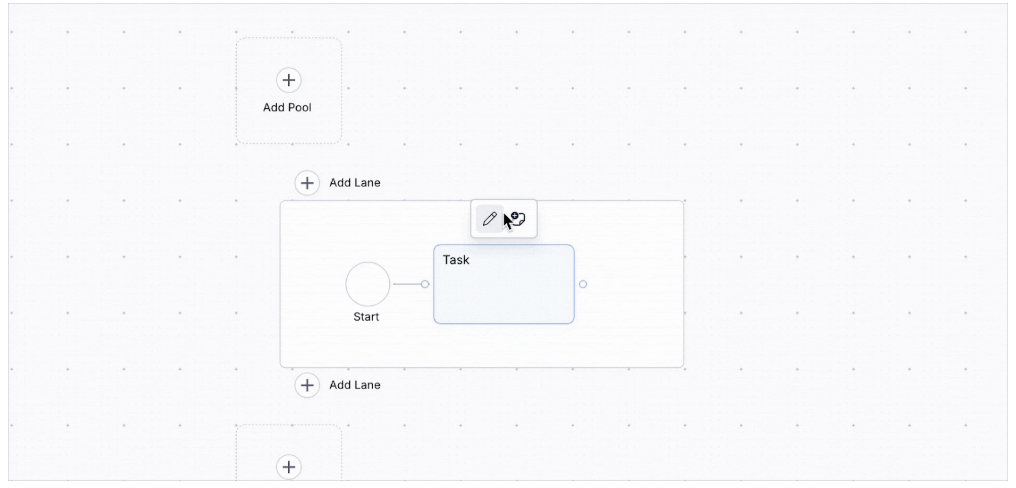
Draw edges between objects
Hover over the source object's port, click, drag to the target, and release to instantly visualize connections.
 |
Assign roles to swimlanes
Authors can assign existing roles to swimlanes to make the responsibility of activities clear.
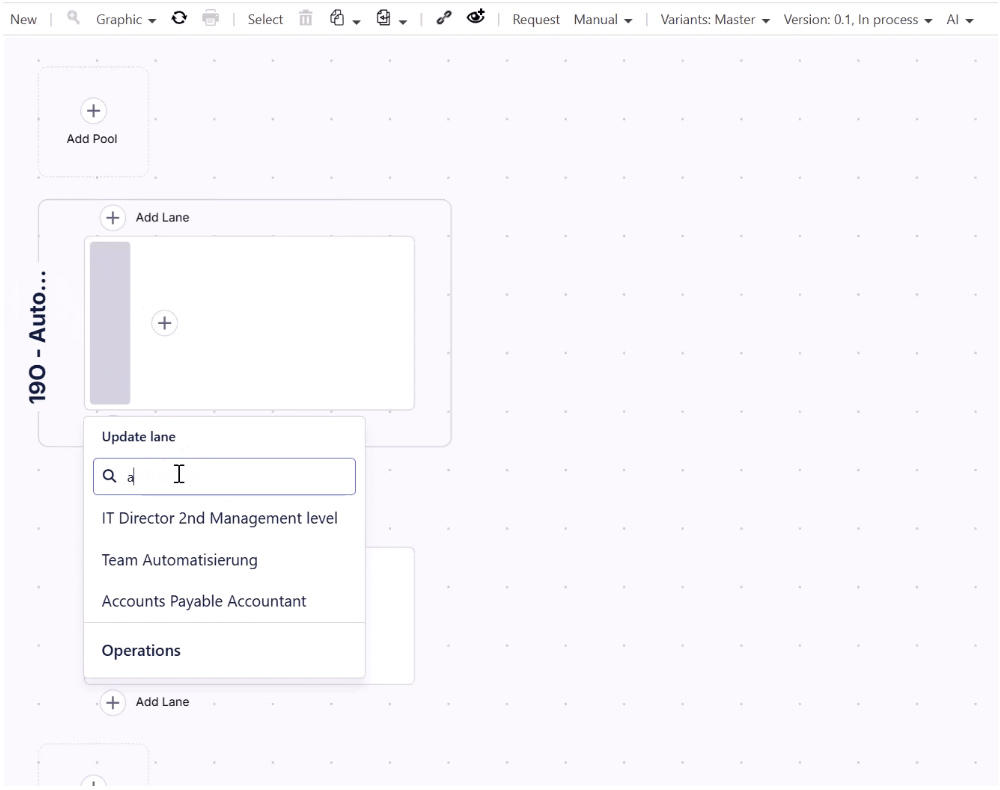 |
Edit labels for pools and lanes
Authors can edit labels for pools and lanes without using a reference. Double-click on the shape to provide a name.
 |
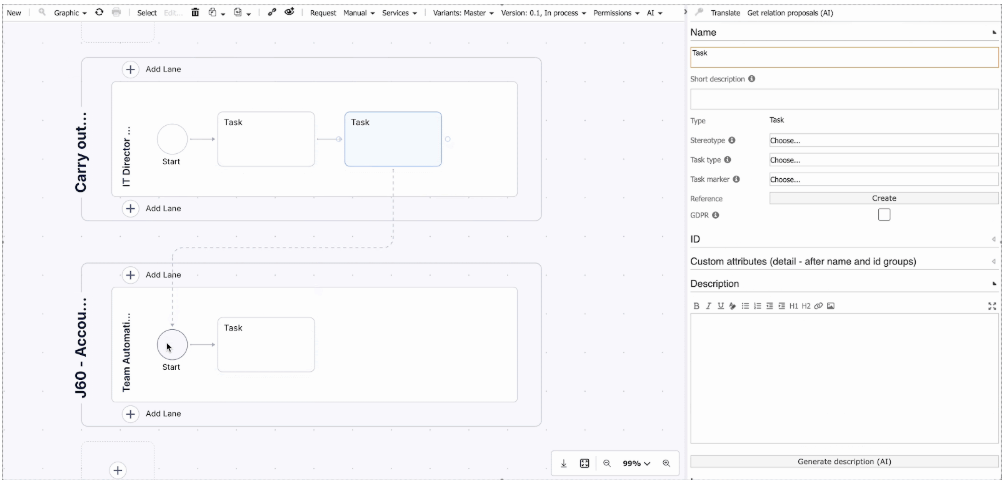
Draw message flows between different pools
Authors can draw message flows between objects in two different pools. The message flow can be configured further to be an initiating and non-initiating message flow. For this click on the message flow and change its type.
 |
Store annotations
Authors can store annotations to a specific shape to share relevant information.
Other changes
Improved search performance, in particular by adding Request Name and Description as searchable attributes
Application Service (System facet) can now be filtered by scope
Added “Reviewer” property to the version “Change state” and “Edit attributes” dialogs. Reviewers can now be set and changed in these dialogs.
Improved behavior for life cycle diagram shapes when changing a state from Valid to Request to Expire
API New endpoints for Intelligence APIs (2025-08-26)
This feature is currently available as a Private Preview only
During a Private Preview, only customers who have agreed to our Private Preview usage agreements can access this feature. Additionally, the features documented here are subject to change and / or cancellation, so they may not be available to all users in future.
For more information about our Private Preview releases, including the level of Support offered with them, see: Feature release types.
The Intelligence API has been updated with two new endpoints: POST for KM Data Query and POST for KM Record Data Query. These new endpoints resolve issues resulting from URL length limitations when sending query parameters such as “filterExpr”. Following this update, you can now send all your query parameters (including lengthy filter expressions, pagination, and other components) within the request body instead of breaking large queries into multiple smaller requests.
This allows you to:
Make single, comprehensive requests for large datasets.
Simplify your integration logic by removing the need for complex manual batching and result aggregation.
Note
This solution supports only the new OData semantics as legacy filtering methods are no longer supported. Filter expressions are limited only by PQL and payload length.
To get early access to these new endpoints, contact your account team. For more information, see Process Intelligence APIs on the Celonis Developer Center.
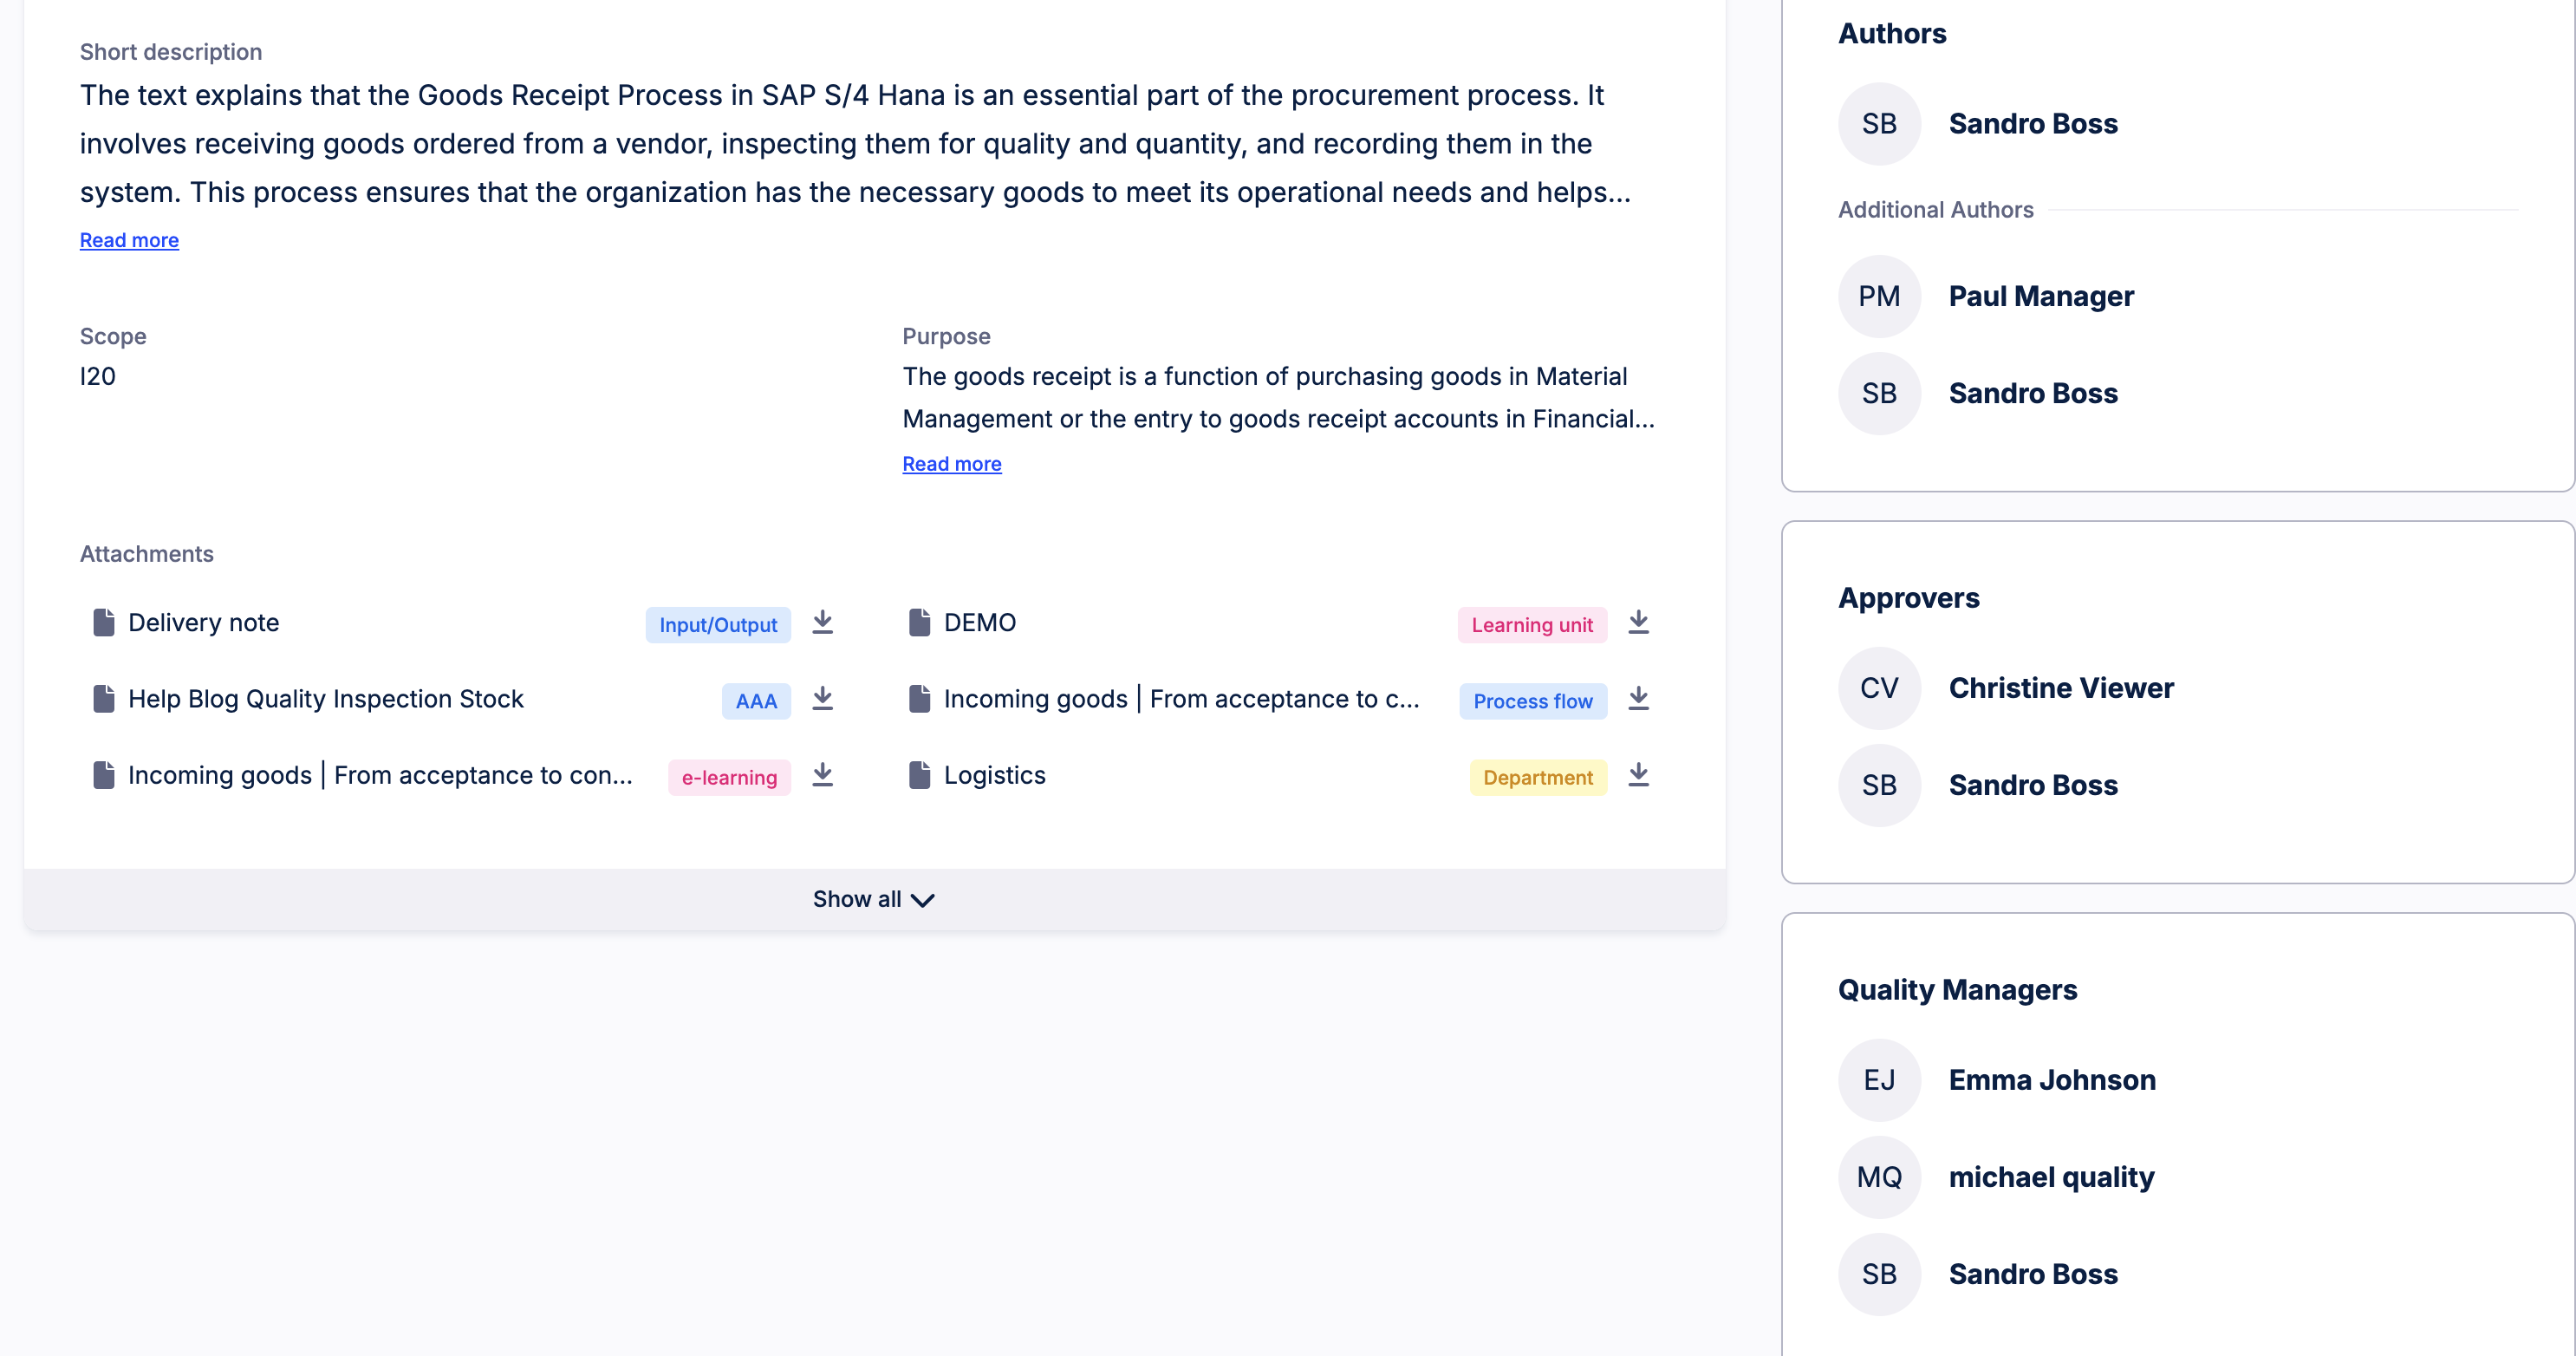
PROCESS NAVIGATOR Approver role in Process Journal (2025-08-22)
You can now see the Approver for a specific process when viewing it in the Process Journal.
 |
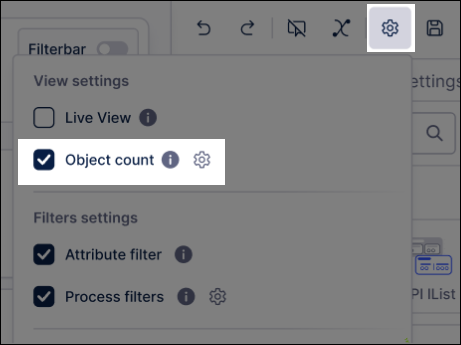
STUDIO Configuring object count in Views (2025-08-21)
When using object-centric data models, you can now enable and configure an object count for your Studio Views from the View Settings menu:
 |
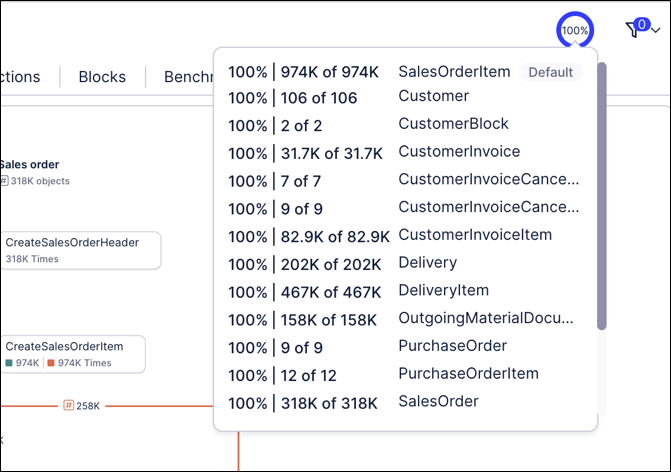
This indicator shows you the percentage and total numbers of objects available in the current View, which updates based on the filters applied to the data. The object count is based on the lead object in the default event log for the perspective.
For more information about object counts, see: Case count / object count.
STUDIO Predefined filters added to containers and tabbed containers (2025-08-21)
You can now configure predefined filters for containers and tabbed containers in your Studio Views. These are filters that are applied to the data when the View is being created or edited, with the published version of the View then showing already filtered data.
You can now set predefined filters on a Knowledge Model level, for the whole View, a tab within a View, and on individual components (such as containers and tabbed containers).
For more information about filtering your Studio Views, see: Filtering Views.
STUDIO Date picker component added to Views (2025-09-03)
You can now configure a date picker component for your Studio Views, displaying a calendar that saves the users input as a variable. This variable can then be combined with other Studio components, such as text boxes, to dynamically update your View.
For example - a single date picker is used to update the variable in the text box:
For more information, see: Date Picker.
PI GRAPH Delete object type or event type along with all dependencies (2025-08-20)
When you delete a custom object type or event type, its dependencies will also be deleted. The following items for an object type or event type will be automatically deleted:
Object-to-object relationships, including one-to-many and many-to-many, both outgoing and incoming from other objects;
Event-to-object relationships;
Transformations that belong to the object type or event type;
Transformations for deleted many-to-many relationships, which are handled in a relationship script;
Occurrences in perspectives.
The following items will also be identified, but will need to be deleted manually:
Transformation code for deleted one to many relationships, which are handled in attribute scripts.
Transformation code for deleted event to object relationships, which are handled in attribute scripts.
In addition, you will need to locate and delete any PQL statements you created using the object type or event type, such as in scripts or in KPIs within Knowledge Models.
STUDIO Y-axis autoscale enhancements in charts (2025-08-20)
You can now enable Y-axis autoscaling for your Studio charts, allowing you to dynamically adjust the Y-axis based on the visible data range.
When configuring a chart, select Data Settings - Y-axis autoscale:
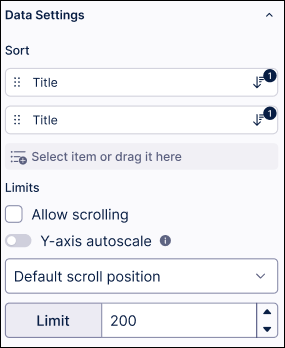
When this setting is disabled, the Y-axis remains fixed to provide a consistent view of the entire dataset, ensuring smooth scrolling and easier data comparison.
For more information about creating and configuring charts for your Studio Views, see: Charts.
STUDIO Knowledge sidebar added and quick metadata updates enabled (2025-08-19)
When creating Views in Studio, you can now use the two new features - the Knowledge sidebar and quick metadata updates:
Knowledge sidebar: This new feature helps you more quickly and easily configure your View components. The Knowledge sidebar supports:
Drag & drop data: Quickly populate components by dragging dimensions and metrics right from the sidebar.
Drag & drop filters: Apply saved filters instantly by dragging them from the sidebar into your component editor.
Quick metadata updates: You can now easily change the display name, format, and units directly from any data chip’s context menu without needing to open the PQL editor.
For an example of how to use these features, see this video:
STUDIO Show and hide Knowledge Model entities (2025-08-18)
You can now show and hide Knowledge Model entities from the user interface using the View Options panel. This removes the reference to the entity from the user interface only, making it easier for you to view and manage the data and variables that you need.
Hidden entities are only removed from the Knowledge Model interface. As such, they are still available within the Knowledge Model and retain their usage within Studio assets that reference the Knowledge Model.
STUDIO Parameterized View Modules using variable mapping (2025-08-14) - Private Preview
This feature is currently available as a Private Preview only
During a Private Preview, only customers who have agreed to our Private Preview usage agreements can access this feature. Additionally, the features documented here are subject to change and / or cancellation, so they may not be available to all users in future.
For more information about our Private Preview releases, including the level of Support offered with them, see: Feature release types.
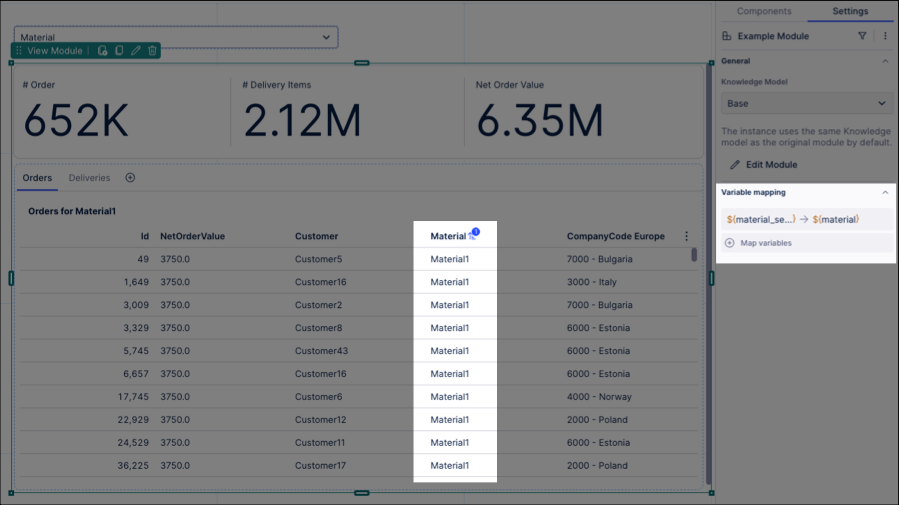
You can now parameterize your Studio View Modules using View variables, allowing you to change the context of the data based on where the View module is embedded.
Instead of adding a single customer ID, date range, or business unit into the View, you can pass them as View Variables. This means that one View Module can be used across multiple Views and adjusted based on the context. View Variables allow you to apply filters or adjust logic at runtime, rather than duplicating the View and adjusting it as need. This keeps the Data Model lean and avoids redundant maintenance.
In this example, we've created a View variable for material types and then mapped this to a module variable:
To learn more about parameterizing your View Modules, see: View modules.
DATA INTEGRATION Partitioned extractions of large tables (2025-08-13)
You can now use partitioned extractions of large tables when extracting data from your Salesforce, SAP, ServiceNow, and JDBC databases to the Celonis Platform.
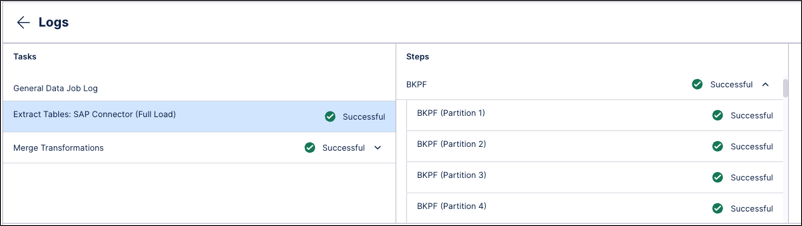
By enabling partitioned extractions, you can chunk your data jobs into smaller batches which can then be extracted either in parallel or sequentially. These batches are then merged into a single table in the Celonis Platform and function in the same way as tables extracted in full. By partitioning your data jobs, you're able to both reduce the extraction time and limit the chances of failure (often caused by high data volumes).
In this example, a large table is extracted in several chunks and then merged via a transformation. This is captured in the Data Job logs.
For more information, see: Enabling partitioned extractions of large tables.
AUTOMATION OAuth for on-prem clients (2025-08-13)
To enhance the security of our on-prem clients (OPC), we added support for the OAuth 2.0 protocol as a more secure authentication method. By leveraging the OAuth 2.0 protocol, we allow you to rotate OAuth client secrets as well as control the scope of permissions.
Existing installations of the OPC will continue to run until the deprecation of application keys for the OPC by December 31st 2025. In order to leverage OAuth 2.0 protocol these clients will need to be upgraded. New installations will automatically have OAuth 2.0 enabled by default.
To learn more about upgrading and installing the OPC, see Installing.
PI GRAPH New SQL Sandbox for testing transformation data in OCDM (2025-08-07)
The new SQL Sandbox in the Objects and Events module allows you to safely test and validate your transformation data in a separate editor without impacting your source tables. Any commands performed in the SQL Sandbox are for testing purposes only and will not modify the source data within your transformation tables. Previously, your data could only be validated by either creating new objects and transformations for testing purposes or using objects in an existing transformation and then removing the SQL expressions before saving.
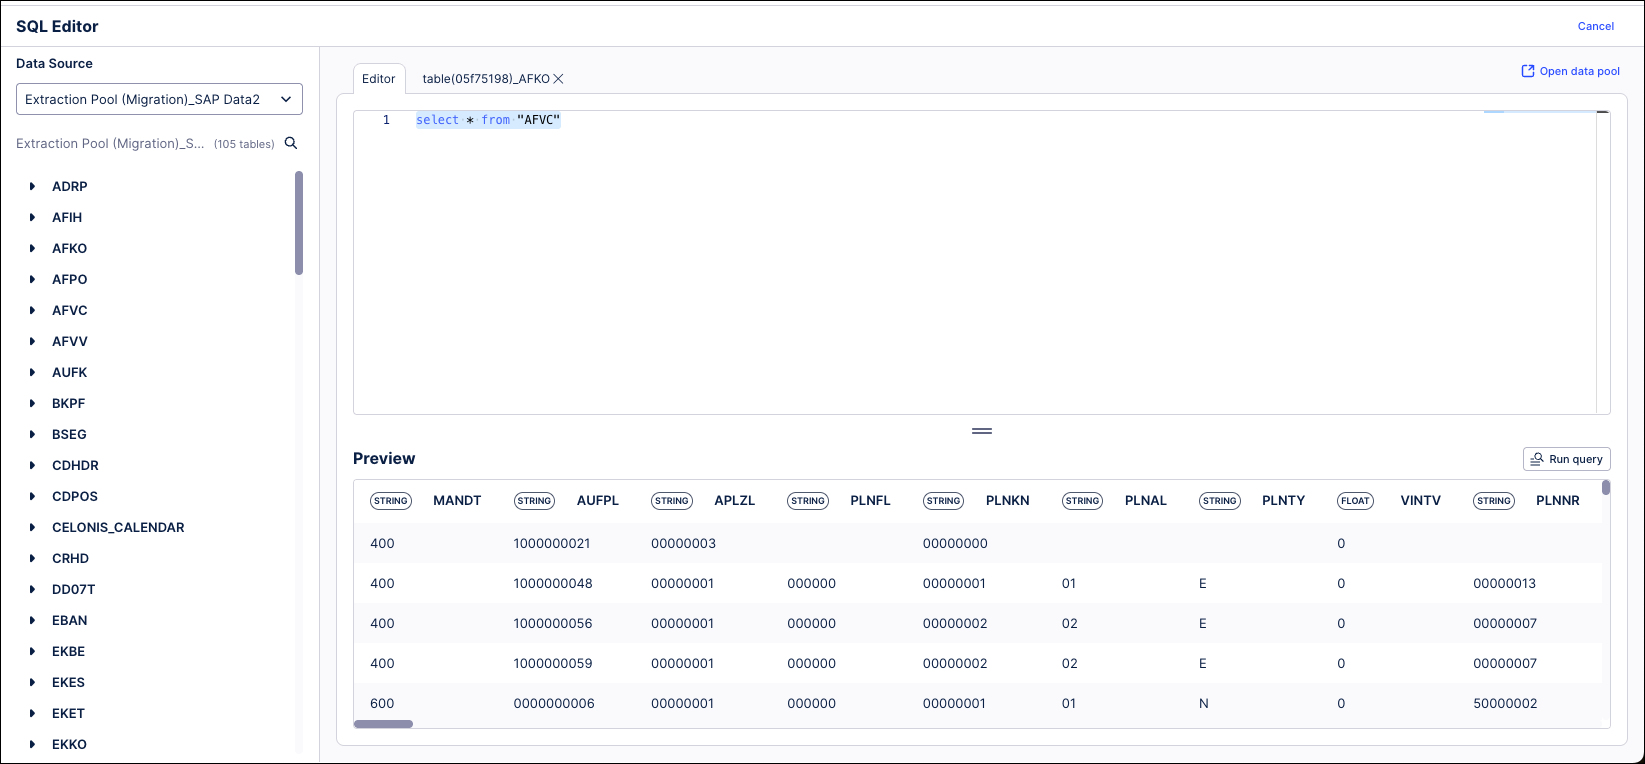 |
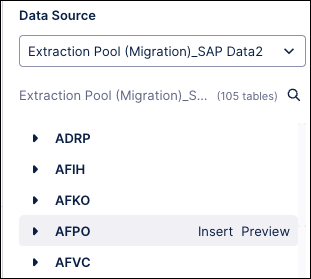
This SQL Sandbox can be accessed by clicking the SQL Editor link in the upper right of the Transformations page. This opens a blank SQL editor with your data sources shown on the left, but without parameters or data sets listed. Enter your SQL commands on the Editor tab and click the Run query button to validate your expression and preview the data returned. You can also click the “Preview” link next to a data source on the left to view the contents of that table in the Preview window.
PI GRAPH Global transformation parameters (2025-08-07)
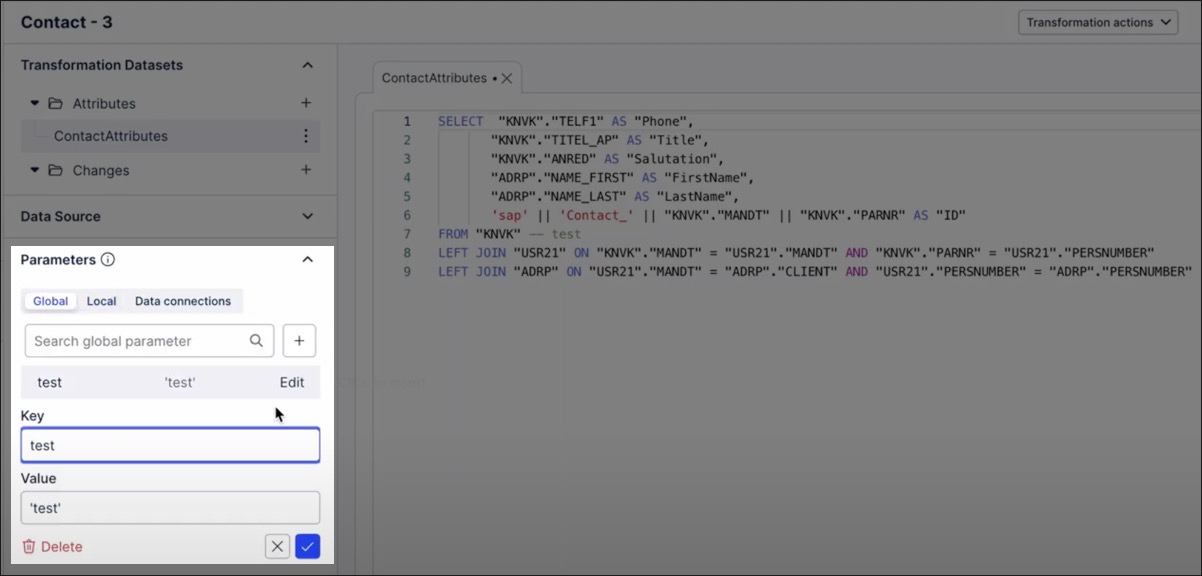
You can now create global parameters that can be used across all transformations in Objects and Events. This reduces the multiple recurring steps and thereby clicks when (re)creating and updating local transformation parameters, making transformation parameters scalable across your Object Centric data.
When creating transformation parameters, select Global and either add a new parameters or apply an existing one:
STUDIO World map layout added to Network Explorer (2025-08-06)
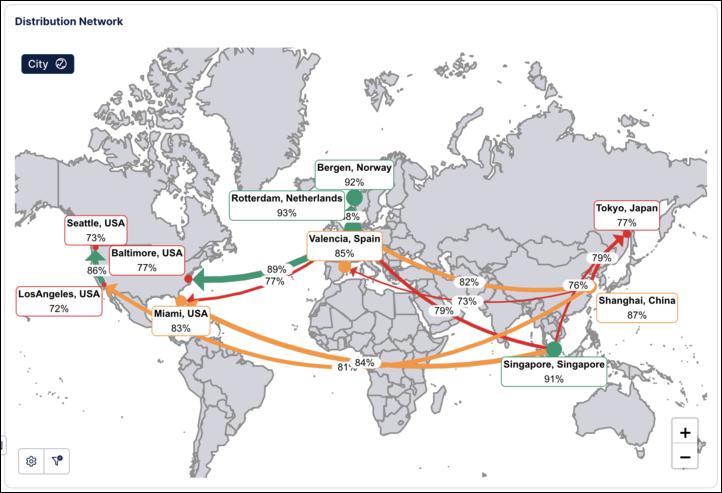
You can now configure a world map layout for the Network Explorer component in your Studio Views.
The Network Explorer component allows you to examine how objects are related across your business. By choosing different node dimensions, you can explore your object-to-object relationships by country, plant, material, or distribution and the KPI to display for each object.
 |
To learn more about the Network Explorer component, see: Network Explorer.
AUTOMATION Manual Task Creation (2025-08-05)
Put your Tasks into action! With the new Create Task actions, you can initiate manual task creation directly from Studio components. For more information, see Adding Actions to Studio components.
PROCESS ADHERENCE MANAGER Variant selection added for individual event logs (2025-08-04)
You can now select the number of variants that display for individual event logs in Model Miner. Previously, a single slider controlled the number of variants that displayed across all event logs in a model.
The addition of a separate slider for each event log gives you better control and more flexibility, helping you create a more accurate baseline model.
For more information, see Reviewing and adding variants.
STUDIO Process animation for Process Explorer (2025-08-04)
Process Explorer is updated to include a "Process Animation" feature that will visually depict how your cases flow through process activities and connections. By animating this process, it will be easier for users to follow the path of your processes rather than trying to visualize a flow on a static graph. This animation can be applied to processes with both single or multiple event logs.
The animation will not initially be active when your Process Explorer graph loads. Hover over the start node for an event log and click the Play button to begin the animation. This feature also adds a button in the lower left that allows you to pause and restart the animation at any point. Pausing the animation makes it easier to highlight specific activities within the process and then resume the process flow animation.
You will also be able to use the new Grouping dropdown to group the cases shown in the animation by hour or day in order to better identify patterns within the specified timeframe. When grouping is applied, the size of the animation bubble reflects the number of aggregated cases within that timeframe, with larger bubbles indicating larger numbers of cases. If grouping is not applied, the animation does not reflect aggregated case numbers.