Digital twin extraction
Digital Twin Extraction converts historical event data into a simulation-ready process model. By completing a linear sequence of configuration steps—from initial data mapping to refining branch probabilities—you create a validated virtual replica of your 'as-is' process for dynamic bottleneck and scenario analysis.
To create a digital twin extraction:
Click Studio and open the Studio space and package you want to create your digital twin extraction in.
Click + Assets and select Simulation.
Configure the following:
Name: This is where you give your simulation a recognizable title. You should choose something descriptive so that you and your teammates can easily identify what process or "what-if" scenario this simulation is intended to model.
Key: This is a unique identifier used by the system to reference this specific asset. While the name is for humans, the key is for the platform's internal logic. It is usually auto-generated based on the Name, but you can customize it if you have specific naming conventions.
Knowledge Model: You need to select the source of truth for your data here. By picking a Knowledge Model, you are telling the simulation which records, attributes, and KPIs it should use to build the Digital Twin.
Activity Table: Here, you specify the event log from your data model. You are selecting the table that contains your process steps (activities) and timestamps, which allows the simulation to understand the sequence and duration of your actual business process.
Click Create.
The digital twin extraction wizard loads, guiding you through the following sections:
This first step in the wizard, Data Check, serves as the foundational setup for your simulation. Its primary purpose is to map your raw data to the specific attributes the "Digital Twin" needs to run accurately.
Here’s a breakdown of what you are doing in this section:
Mapping parameters: You are identifying the "Who" (User ID), the "How" (User Type), and the "When" (Event time start) of your process. This allows the simulation to distinguish between manual and automated work and understand the actual duration of tasks.
Currency configuration: You are setting the financial baseline so that any cost-based KPIs generated by the simulation are reflected in your preferred currency.
Data validation: The "Data Check" acts as a quality gate. As you can see from the Warning on your screen, it proactively flags issues—like timestamps being rounded to the day—that might prevent the simulation from providing the granular insights you need.
By completing this step, you ensure that the simulation is built on a high-fidelity representation of your actual business operations.
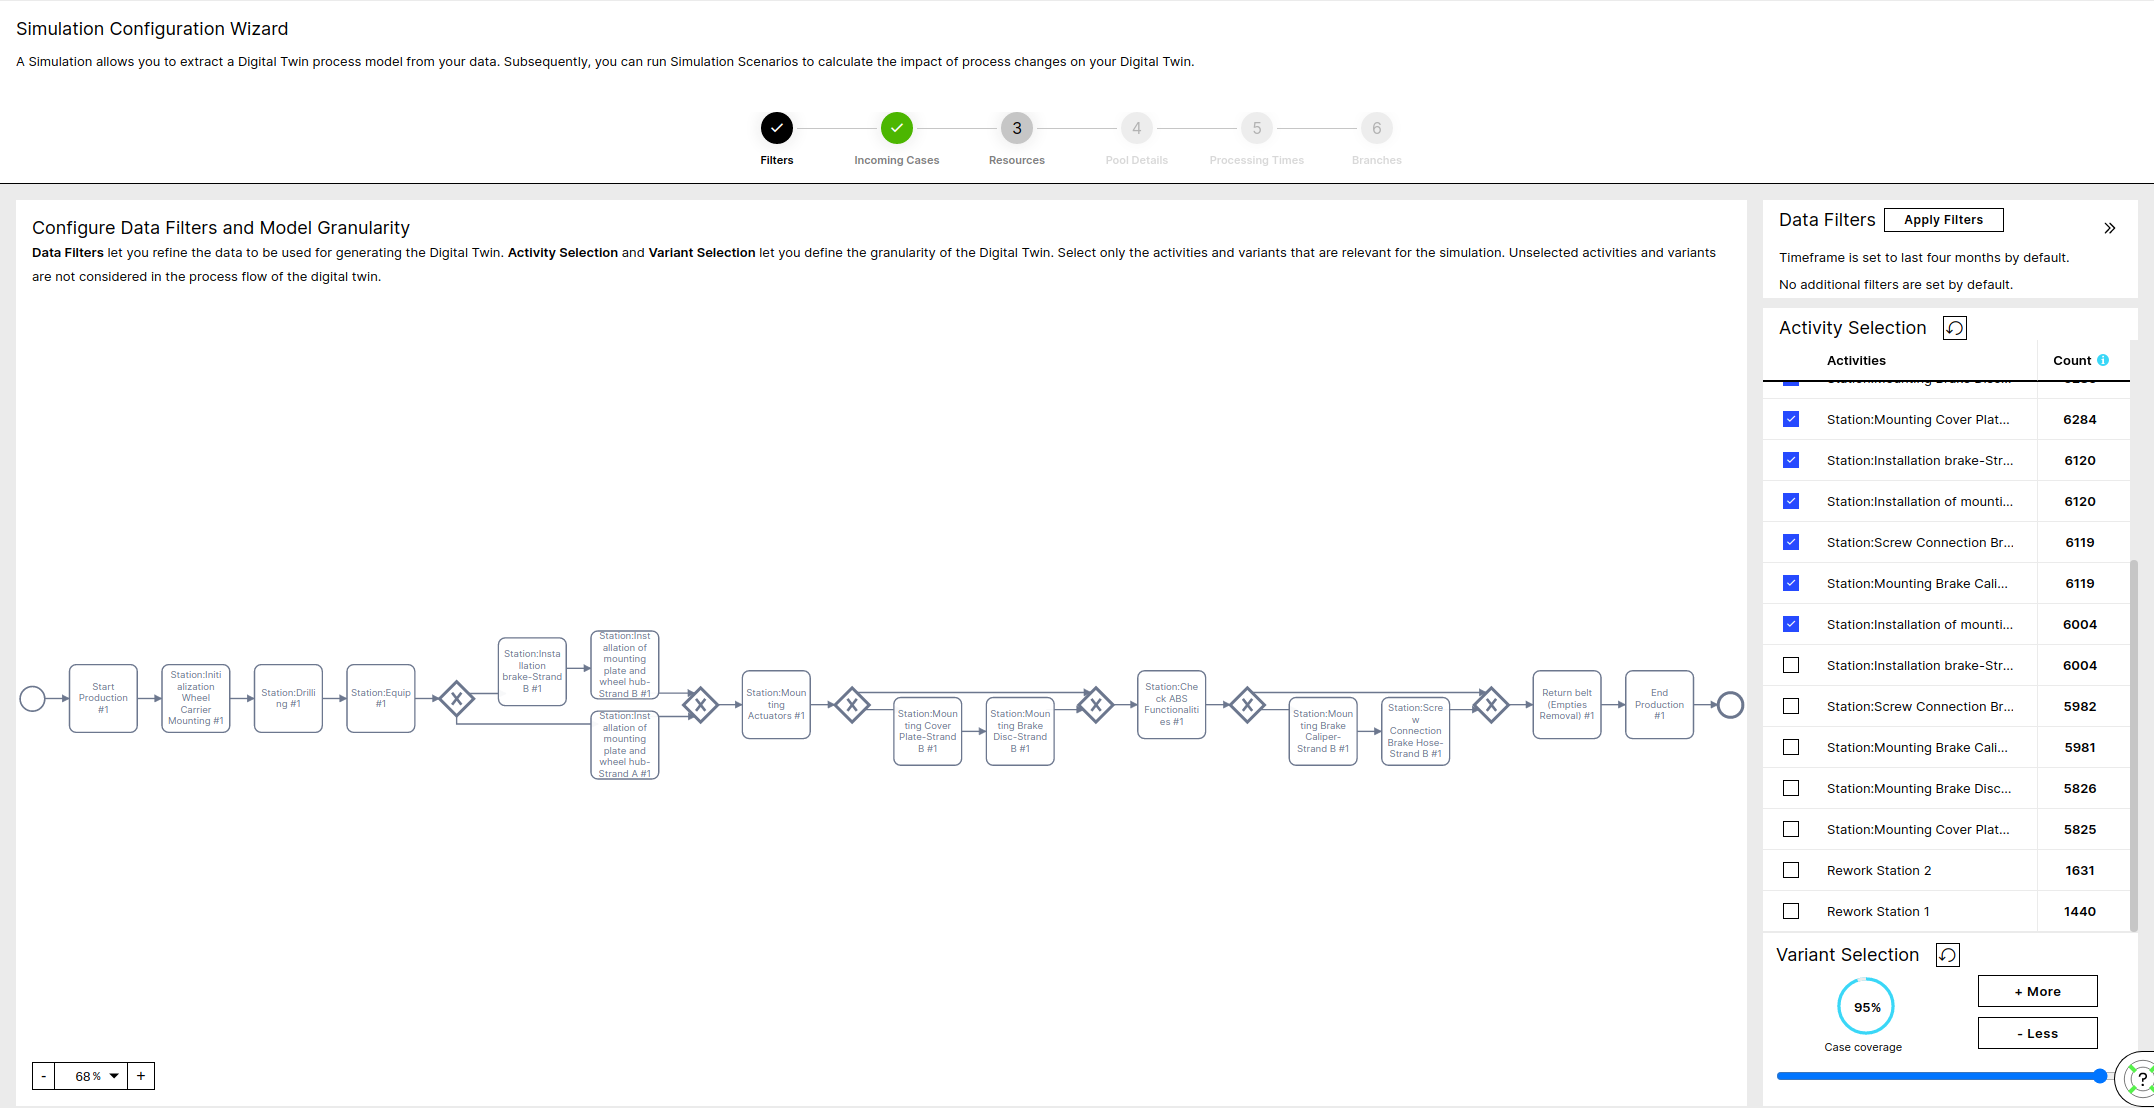
In this step, you can filter your data model based on time or a custom PQL expression (e.g. filter only on a specific country).
On top of that, you can define the granularity of your Digital Twin model, by selecting more or less Activities and Variants.
Note that increasing Activities and Variants increase the configuration complexity.
 |
Note
Use the Apply Filters button to reduce the scope of your Process. You can restrict to a specific time interval or use a custom PQL Filter for this purpose. The data filters define the process based on which the Digital Twin is built.
Note
Selecting only the activities and variants of interest will reduce the complexity of the model. The non-selected activities and variants are only silently ignored, but are not filtered out of the model.
Advanced:
For the Date Filter the latest 4 months are selected by default
After applying the Data Filters the Activities are sorted by occurrence and the top activities that cover at least 80% of the total events are selected by default
Given both the Filters and the Selected Activities the top Variants are selected that cover at least 70% of the cases
Note that by decreasing the number of selected activities the number of variants decreases and the size of the top variants increases.
For example in a process with:
a set of activities: (A, B, C, D)
and cases: (A-B-C-D, A-C, A-B-D-C, A-C, A-B-A),
the variant (A-C)
covers 20% of the cases if the selected activities are A, C and D,
but 80% if the selected activities are only A and C.
Case Generation Calendar
The calendar hours per week define during which hours new cases arrive to the system per day of the week. You can adjust the hours with the From and To dropdowns or exclude a day with the slider.
Cases per day
The cases per day define the volume of incoming cases and has to be a positive number. If you want zero cases arriving on one day, you need to deactivate the day.
Note
The total case input quantity per day of the week depends only on the 'Cases per day' and is not affected by changes on the calendar
Advanced:
You can get into the expert mode and define your arrival process more granular by clicking on a specific day of the week.
In the expert mode it is possible to also adjust the distribution of the inter-arrival times between two consecutive incoming cases, with respect to the calendar hours and the average cases per week.
This means you can directly adjust the distribution type and the standard deviation of the inter-arrival steps. The mean of the distribution is calculated as the ratio of the calendars duration at this day divided by the number of cases arriving.
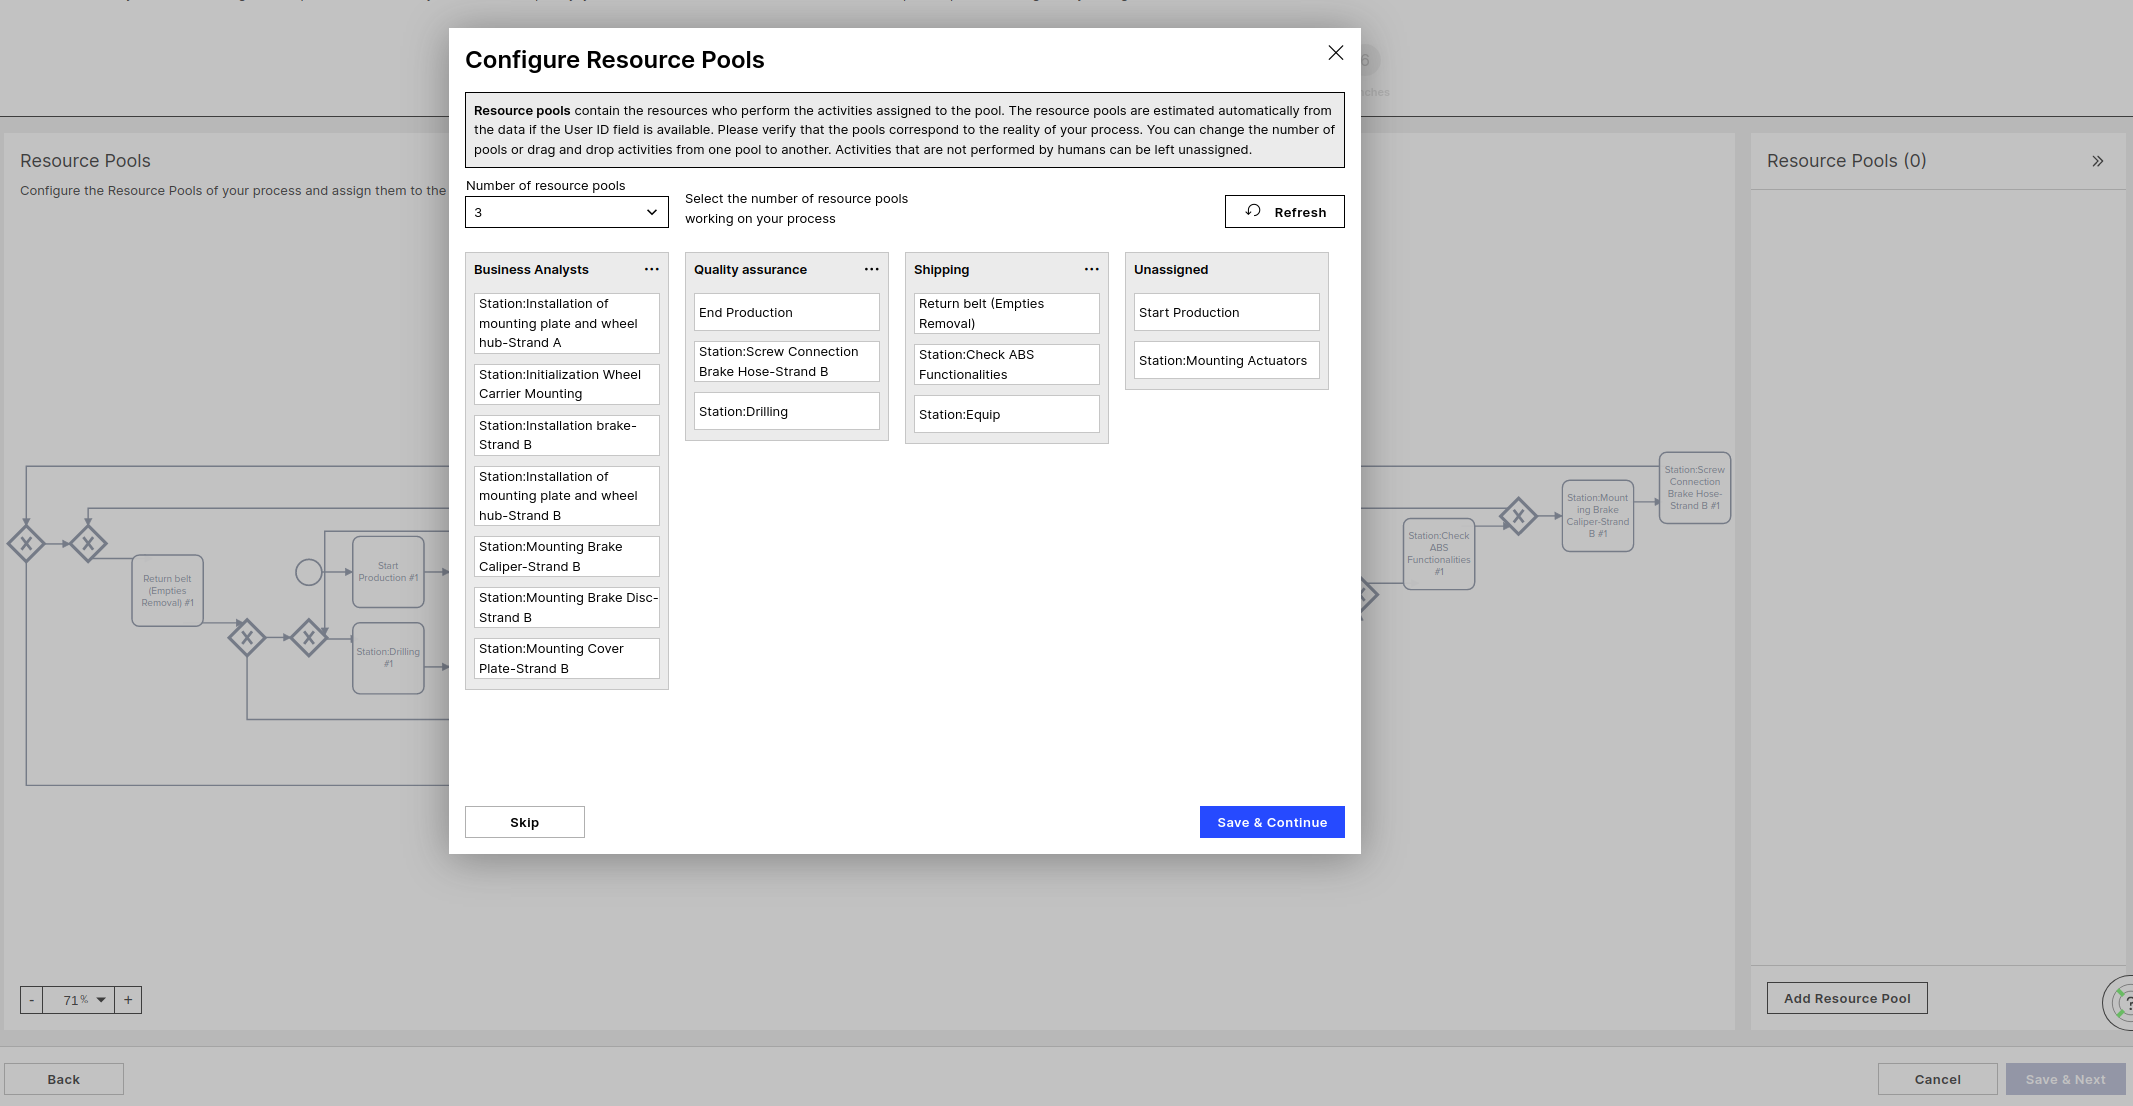
Resource Pools
A Resource Pool is a set of resources that work on specific Activities. You can have only one Pool if the resources work through all of the Activities in the process, or split the Activities in more granular Teams. Each Activity can be assigned to maximum one Pool.
Note
Activities that are not assigned to any Resource Pool will be considered as passive activities, will consume no resources, have no Queuing or Processing time. Typical example of a passive Activity is "Due Date passed", which is an Activity happening automatically in the system.
 |
Advanced
Without User ID
In case the user ID column is not available (not configured in initial configuration screen) all activities are assigned to the same pool by default.
With User ID
Given the User ID the Activities are clustered based on the User performing each Activity each time. All possible cluster options are returned and can be selected by adjusting the number of resource pools, where the best fit is selected by default.
You can still make changes by drag and dropping Activities from one Pool to another.
All Activities that do not consume any resources and have no Processing time belong under "Unassigned".
All activities that have no values in the User ID column or are always performed by a system user (in case the User Type column is available) will be placed under "Unassigned" by default.
Automation Rate
The Automation Rate defines how many of the cases will be performed manually and how many will be performed by a system user. An Automation Rate of 100% means the activity is fully automated. Manually performed cases will occupy a resource to be processed for a duration defined by the corresponding Processing Time, while automated ones require no resources and have zero Processing Time. Automation Rates can only be estimated if the User Type and the Manual users where set in the first step of the DTE.
Processing Times
The time a resource will be occupied in order for a case to be processed by the corresponding Activity and for the case to be able to move to the next task. Processing Times can only be estimated if either one of the Event time start or the User ID columns was provided.
Processing Times estimation with Event time start
In case the Start times are available, the time difference (End time) - (Start time) is extracted for each Activity and a distribution is fitted and returned as default recommendation.
Processing Times estimation with User ID
In case the Start times are not available but the User ID column is, a user tracking approach is used. The users operating the most activities are tracked and the time steps between finishing consecutive Tasks is used to estimate the Processing Times.
Example:
A user performing consecutive the Activities A,B and C having End times 10:00, 10:10 and 11:00 respectively indicates that it took them 10 minutes to perform Activity B and 50 minutes to perform Activity C.
After aggregating over many users, preprocessing to account for outliers and batch jobs a distribution is fitted and returned as a recommendation.
Automation Rate
If the User Type column is provided, the ratio of events performed by system users divided by the total number of events per Activity is extracted per Activity. System users is the complementary of the Manual Users defined in the initial config step, including missing values ('-').
Workload Analysis (called 'FTE configuration' in scenario configuration)
Vacation
The vacation days per FTE per year. By default, set to 30 days.
Working hours per week
The hours each FTE works in one week, by default set to 40 hours.
Workload Analysis
The Workload Analysis shows the Estimated Effective Weekly Workload based on the Occurrence of each Activity (as extracted from the data) together with the corresponding Processing Time and Automation Rate. Use this calculation to sanity-check the number of FTE you enter above.
Note
The Workload Analysis is not available in the scenario configuration; it is only shown at Digital Twin configuration.
Full Time Employees
For each Pool the number of FTEs has to be passed. This number corresponds to Full Time equivalent of employees working on the process as defined by the Data Filters in the first step and processing the Activities that are assigned to this Pool. This means that a Pool with 10 part time employees (working 50%) and 6 full time working half of their time on other processes have an equivalent of 8 FTEs. Note that, similar to the incoming cases, the variant selection is not relevant for the number of FTEs, but rather the whole process defined by the Data Filters.
Work Calendar
Work Hours
The working hours/work calendar defines the business hours, i.e. during which hours the resources are allowed to work. Not necessarily all resources will work during the whole work calendar. The number of FTEs together with working hours per week and the vacation days per year define the total labor force of each pool which is spread across the work calendar
Work Cost
Cost
The cost needed for one hour of work of one FTE of the given Pool.
Advanced:
The number of FTEs is a parameter that is not extracted from the data and has a big impact on the outcome of the simulation. Make sure that resources provided in this step are sufficient for the workload they have, which is relative to the number of incoming cases and the Processing times of the Activities of each Pool.
Use the Workload Analysis as additional input. The Estimated Effective Weekly Workload probably does not perfectly match with the actual FTE value.
Probability
The Branching Probabilities define the next Activity a case will reach after it is finished being processed by the Activity before. The sum of the Probabilities for all Branches leaving one Activity must always be 100%.
Enabling Time
The Enabling Time is the time a case needs from the moment it is finished being processed by an Activity until it can be processed by the next Activity. Enabling time is what is left from the Throughput Time after removing the Processing and the Queuing time. Examples would be a transport time between stations or the time waiting for a customer to reply.
Similar to the Processing Time it is stochastically defined through a distribution type, a mean and a standard deviation.