Create a KPI and import it into Power BI
You are interested in a specific KPI and want to visualize it in your Power BI report. For example, you want to display the KPI "On Time Delivery" per country. The country is the dimension for which we aggregate the individual “On Time Delivery” values.
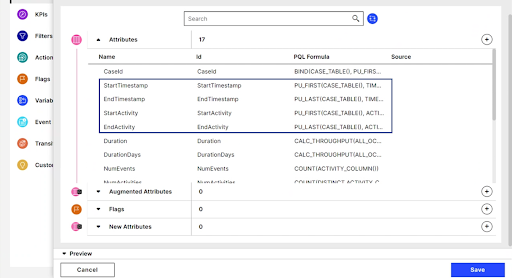
To do this, you first have to generate your dimensions/aggregations by using PQL formulas within the Knowledge Model as shown below. Thex§ dimensions could be: customer, country, and class of material, for example, or any KPI that you have defined in your Knowledge Model.
In the next step you calculate the KPI (On Time Delivery) for the dimension you are interested in and store them as a Record in your Knowledge Model. Create a table with two columns, where the first column stores the countries and the second column stores the values for the “On Time Delivery” aggregated for every country.