Configuring a world map chart in legacy views
Legacy view component
You're currently viewing a topic about a legacy view component in Studio. This component can still be used in legacy Studio views, however we recommend using the visual view editor in the new Studio experience. The updated interface includes drag and drop capabilities, allowing you to easily add components and configure your views.
For more information, see: Views.
Display your data based on geographical locations.
Configuring a world map
Example Configurations
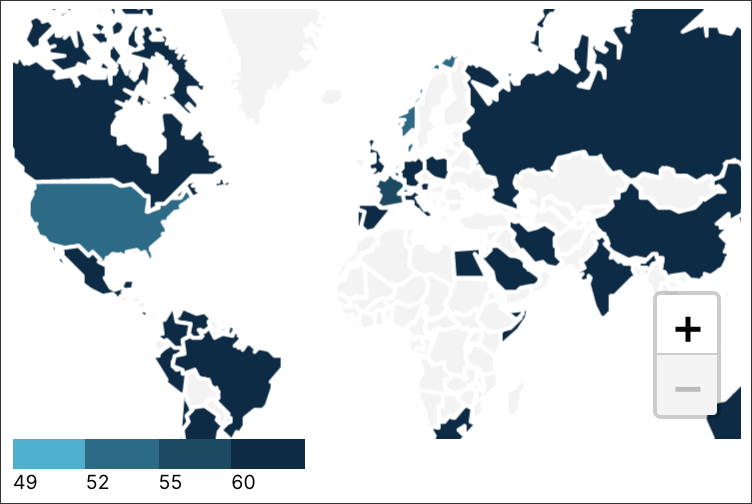
- id: worldmap_widget
  type: world-map
  knowlegdeModelKey: MY_MODEL #this is optional, default is View's KM
  settings:
    name: WorldMap
    interactions:
      legend: add legend label here
      tooltip: CUSTOMER_LAND # text to be shown
    countries: CUSTOMER_LAND # required, list of ISO codes representing countries
    kpi: KPI_DAYS_SALES_OUTSTANDING # required
    color: #optional
      thresholds:
      - 49
      - 52
      - 55
      - 60
      scheme: SEQUENTIAL_BLUES_REVERSE
You can either rely on a default, a color scheme or define custom thresholds to build the color-coding:
If no color setting is specified at all: default scheme and the scaleQuantize.
If only thresholds are defined: default scheme and the scaleThreshold.
If only a scheme is defined: given scheme and the scaleQuantize.
If both are defined: given scheme with scaleThreshold.
Number Thresholds
- id: worldmap_widget
  type: world-map
  settings:
    title: World Map with Threshold
    interactions:
      legend: This is the legend label
      tooltip: VALUE
    countries: COUNTRY
    kpi: VALUE
    color:
      thresholds:
      - 50
      - 52
      scheme: SEQUENTIAL_PINK
Knowledge Model References as Thresholds
- id: worldmap_widget
  type: world-map
  settings:
    title: World Map with Threshold
    interactions:
      legend: This is the legend label
      tooltip: VALUE
    countries: COUNTRY
    kpi: VALUE
    color:
      thresholds:
      - THRESHOLD_1
      - THRESHOLD_2
      - THRESHOLD_3
      - THRESHOLD_4
      scheme: SEQUENTIAL_PINK