Core Concepts
This application enables users to monitor operations and track value realization based on built-in KPIs, inefficiencies, and inventory classifications.
Core Concept | Definition |
|---|---|
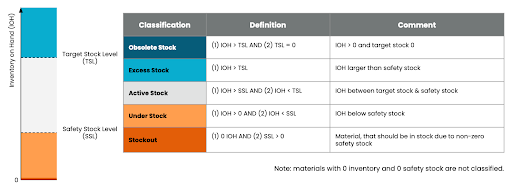
Out of stock | A Material-Plant combination is flagged for Stockout if its current Inventory on Hand and Consignment Stock are both equal to zero while the current Safety Stock is greater than zero. The Execution Gap is determined per Material-Plant level using quantities. |
Understock | A Material-Plant combination is flagged as Under Stock if its current Inventory on Hand is greater than zero but smaller than current Safety Stock or current Inventory on Hand equals zero but Available Consignment stock is greater than zero. The Execution Gap is determined per Material-Plant level using quantities. |
Excess Stock | A Material-Plant combination is flagged for Over Stock if its current Inventory on Hand is greater than its Target Stock. |
Obsolete Stock | A Material-Plant combination is flagged for Obsolete Stock if its current Excess Inventory Rate equals 100% and there are no Open Sales Orders. The Execution Gap is determined per Material-Plant level using quantities. |
Untouched Stock | Untouched Stock is the minimum stock level that has never been undercut in the last 2 years. A Material-Plant combination will not be flagged for Untouched Stock if this value is less than or equal to zero, its overall Inventory on Hand is below Safety Stock or its overall Inventory on Hand is lower than current Open Sales Orders (i.e. every unit on hand is technically already sold). |
Inventory on Hand | Inventory on Hand is the sum total of current inventory at the time of the last data load. |
Available Consignment Stock | Available Consignment Stock is the sum total of current vendor consignment stock at the time of the last data load. |
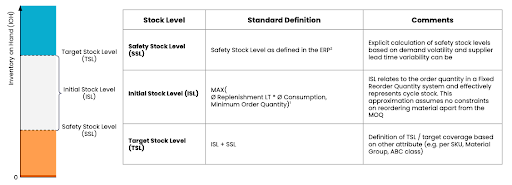
Safety Stock | Safety Stock is an additional quantity of a material held in the inventory to reduce the risk that the material will be out of stock. It acts as a buffer stock in case sales are greater than planned and/or the supplier cannot deliver the additional units at the expected time. |
Target Stock | Target Stock is defined on an SKU level and is calculated by summing the Safety Stock (from master data) and the calculated Initial stock level (ISL). |
Active Stock | Active Stock is defined on an SKU level and is calculated by taking the ratio between Target Stock and Actual stock. When the ratio is greater than 1, it means that there is less actual stock than the target. In this case, Active Stock equals Inventory on Hand |
Initial Stock Level | Initial Stock Level is defined on an SKU level, and compares the minimum lot size (minimum order quantity), and the average replenishment lead time multiplied by the average consumption per day (over the last 24 months). Whichever result is larger is used as the initial stock level. |
Purchase Lead Time computation | Purchase Lead Time is the time between creating a Purchase Order and the last Goods Receipt assigned to it. Date of Purchase Order Creation → Timestamp of the "Purchase Order Created" activity as a starting point for the Purchase Order. Date of Last Goods Receipt → Timestamp of the last "Goods Receipt" activity of a Purchase Order Item. |
Production Lead Time computation | Production Lead Time is the time between a Production Order's Actual Production Start Date and the Actual Production Finish Date assigned to it. Actual Production Start Date → Timestamp of the "Actual Start Time" activity as a starting point for the Production Order. Actual Production Finish Date → Timestamp of a Production Order's "Actual Finish Time" activity. |
Safety Stock computation | Safety Stock Level (SSL) is computed using King’s method with the following formula: For Materials with past replenishment: SSL = Zcrit * sqrt(LT*(𝛔C)²+ (C*𝛔LT)²) For Materials without past replenishment: SSL = Zcrit * sqrt(LTp *(𝛔C)²+ (C)²) Where LT is Average Replenishment Lead Time, 𝛔LT is LT standard deviation, LTp is Planned Replenishment Lead Time, C is Average Consumption, 𝛔C is Consumption standard deviation and Zcrit is the service factor based on the desired service level. Z-Value of Desired Service Level → The Desired Service Level is the probability of a stockout being avoided. Avg. Replenishment Lead Time → Average amount of days for a replenishment order to arrive. Variance of Daily Consumption → Squared value the standard deviation of Daily Consumption. Avg. Daily Consumption → Average daily quantity of units consumed during the recommendation timeframe. Standard Dev. of Replenishment Lead Time → Standard deviation of arriving replenishment orders in days. Planned Replenishment Lead Time → Planned amount of days for a replenishment order to arrive. |
Reorder Point (ROP) computation | The Reorder Point (ROP) is the minimum amount of an item to hold in stock, such that when the stock falls to this amount, the item must be reordered. When recommending a new Reorder Point (ROP), three different approaches are considered: 1. Standard Formula: The standard formula relies on the Recommended Safety Stock Level, Actual Replenishment Lead Time, and Avg. Daily Consumption. It provides up-to-date information based on the latest data drawn from your ERP system. ROP = SSL + LT * C SSL is the Safety Stock Level, LT is the average replenishment Lead Time, and C is the average daily Consumption. The remaining two approaches are used as a fallback to avoid giving either a too-low or no recommendation. 2. Median Consumption Qty: If the Standard ROP calculation yields a result less than one or less than the Median Consumption Quantity, the latter is taken as the Recommended Reorder Point. 3. Recommendation of 1: If both the Standard Formula and the Median Consumption Quantity are less than one or cannot be computed (e.g., in the event of no consumption history for new materials), a Reorder Point of 1 is recommended. |
ABC Classification | The ABC analysis can be done by applying Pareto's rule on the value of individual materials. The analysis ranks materials according to their value contributions in terms of total consumed value. You perform an ABC analysis to classify materials according to their usage value or the number of objects. During ABC analysis, the system assigns each material-plant combination one of the following indicators:
|
XYZ Classification | The XYZ Analysis is based on the dynamics of consumption. This uses the variance coefficient of consumption or sales in a specific time horizon. For example, a material that has the value BY might mean a material with medium volume and seasonal demand. You perform an XYZ analysis to classify planning objects according to the variance in a specific coefficient. During XYZ analysis, the system assigns each object one of the following indicators:
|
 |
 |