Core Concepts
This application enables users to monitor operations and track value realization based on built-in KPIs, inefficiencies and inventory classifications.
Core Concept | Definition | ||
|---|---|---|---|
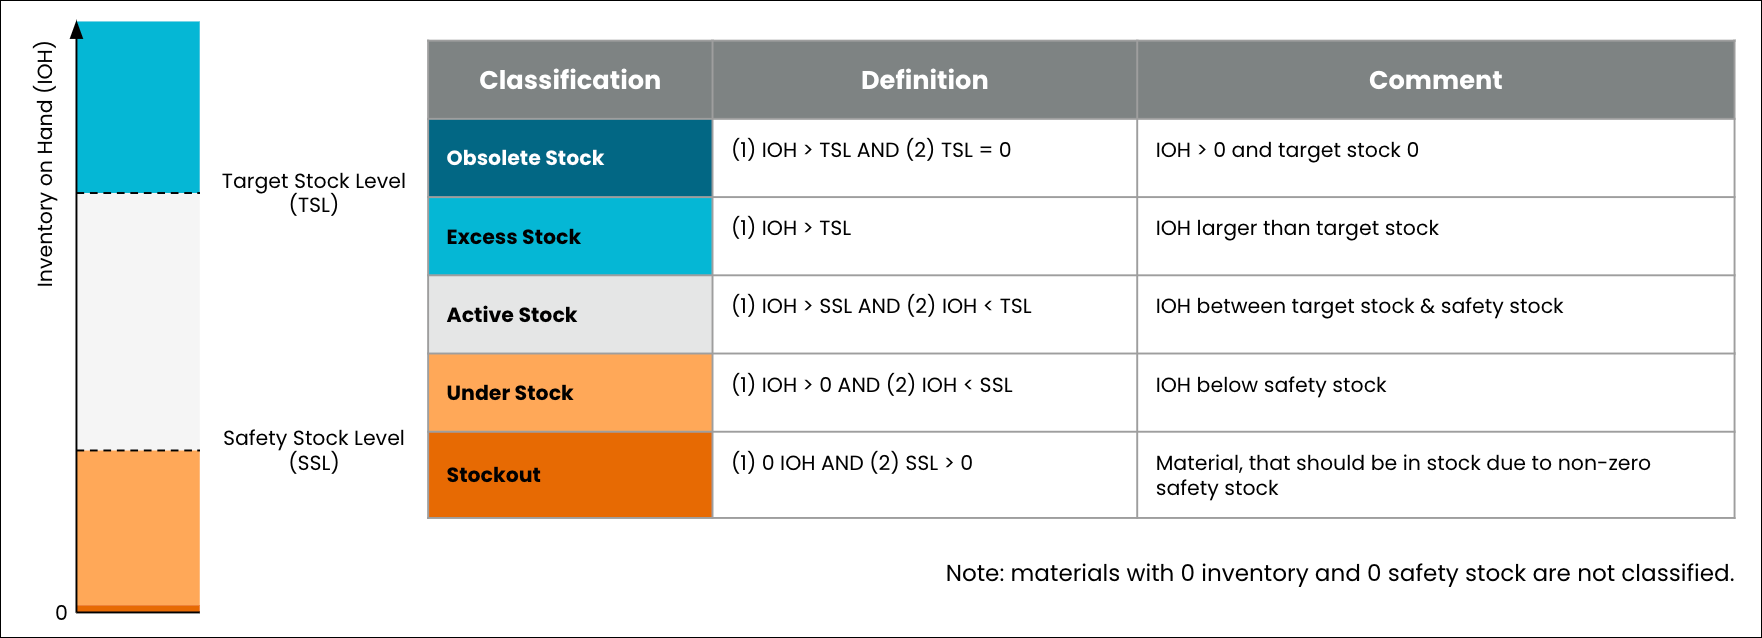
Out of Stock | A Material-Plant combination is flagged for Stockout if its current Inventory on Hand and Consignment Stock both equal zero while current Safety Stock is greater than zero. The Execution Gap is determined per Material-Plant level using quantities. | ||
Understock | A Material-Plant combination is flagged as Under Stock if its current Inventory on Hand is greater than zero but smaller than current Safety Stock or current Inventory on Hand equals zero but Available Consignment stock is greater than zero. The Execution Gap is determined per Material-Plant level using quantities. | ||
Excess Stock | A Material-Plant combination is flagged for Over Stock if its current Inventory on Hand is greater than its Target Stock. | ||
Obsolete Stock | A Material-Plant combination is flagged for Obsolete Stock if its current Excess Inventory Rate equals 100% and there is no open demand (from Reservations, Sales Orders, or Independent Requirements). The Execution Gap is determined per Material-Plant level using quantities. | ||
Untouched Stock | Untouched Stock is defined as the minimum stock level that has never been undercut in the last 2 years. A Material-Plant combination will not be flagged for Untouched Stock if this value is less than or equal to zero, its overall Inventory on Hand is below Safety Stock or its overall Inventory on Hand is lower than current Open Sales Orders (i.e. every unit on hand is technically already sold). | ||
Inventory on Hand | Inventory on Hand is the sum total of current inventory at the time of the last data load. | ||
Available Consignment Stock | Available Consignment Stock is the sum total of current vendor consignment stock at the time of the last data load. | ||
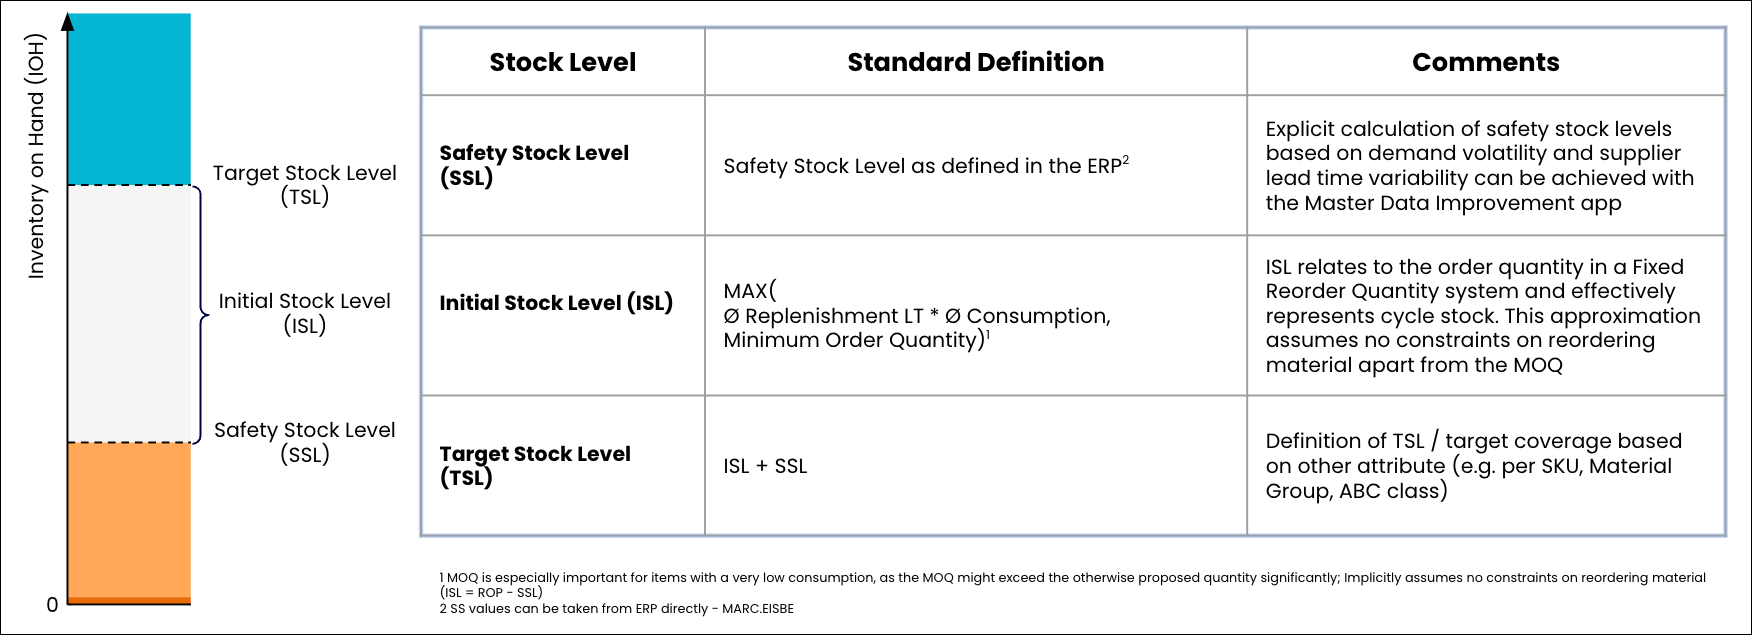
Safety Stock | Safety Stock is an additional quantity of a material held in the inventory to reduce the risk that the material will be out of stock. It acts as a buffer stock in case sales are greater than planned and/or the supplier is unable to deliver the additional units at the expected time. | ||
Target Stock | Target Stock is defined on a SKU level, and is calculated by summing the Safety Stock (from master data) and the calculated Initial stock level (ISL). | ||
Active Stock | Active Stock is defined on a SKU level, and is calculated by taking the ratio between Target Stock and Actual stock. When the ratio is greater than 1, it means that there is less actual stock than the target. In this case, Active Stock equals Inventory on Hand | ||
Initial Stock Level | Initial Stock Level is defined on a SKU level, and compares the minimum lot size (minimum order quantity), and the average replenishment lead time multiplied by the average consumption per day (over the last 24 months). Whichever result is larger is used as the initial stock level.
| ||
ABC Classification | The ABC analysis can be done by applying Pareto's rule on the value of individual materials. The analysis ranks materials according to their value contributions in terms of total consumed value. You perform an ABC analysis to classify materials according to their usage value, or number of objects. During ABC analysis, the system assigns each material-plant combination one of the following indicators:
| ||
XYZ Classification | The XYZ Analysis is based on the dynamics of consumption. This uses the variance coefficient of consumption or sales in a specific time horizon. For example, a material that has the values BY might mean a material with medium volume and seasonal demand. You perform an XYZ analysis to classify planning objects according to the variance in a specific coefficient. During XYZ analysis, the system assigns each object one of the following indicators:
|