Generated insights from your Insight Explorer
The Explore and prioritize insights page of Insight Explorer displays all the insights calculated from your selected data in the form of cards that you can click on to analyze further. Insights are ranked by potential improvement by default, but can also be filtered by the type of insight or sorted by the number of affected objects. Your insights are organized into tabs based on the type of insight and whether or not the insight has been saved for further analysis by selecting the Bookmark icon. You can click on any insight card to investigate the data further.
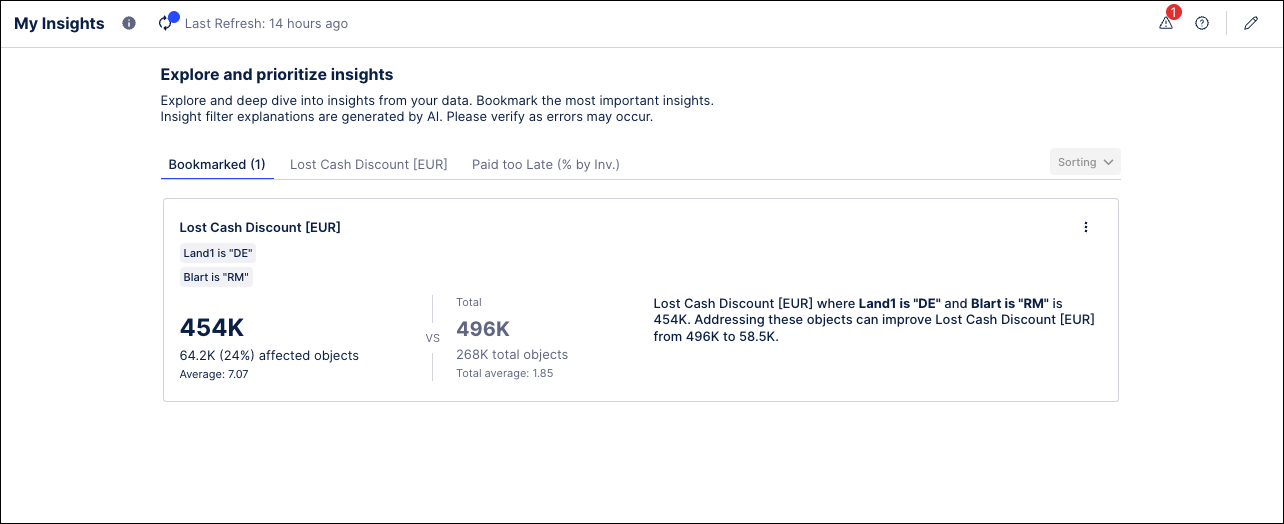 |
Using the toolbar at the top of the page, you can rerun the analysis, see information about the analysis such as any issues that occurred during the run, and revisit the Configuration for this Insight Explorer.
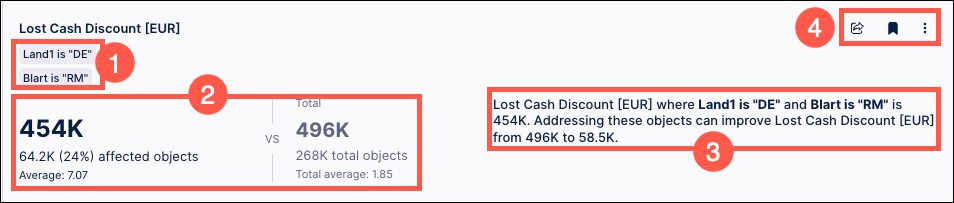 |
The filter applied to this insight to indicate which subgroup(s) is performing poorly.
Quantifies this insight as a comparison between a subgroup and the overall population.
An explanation of the insight.
Categorize the insight:
Export this insight as a Studio View.
Click the bookmark icon to add this insight to the Bookmarked tab to be able to return to it later.
Copy the filter as a PQL statement.
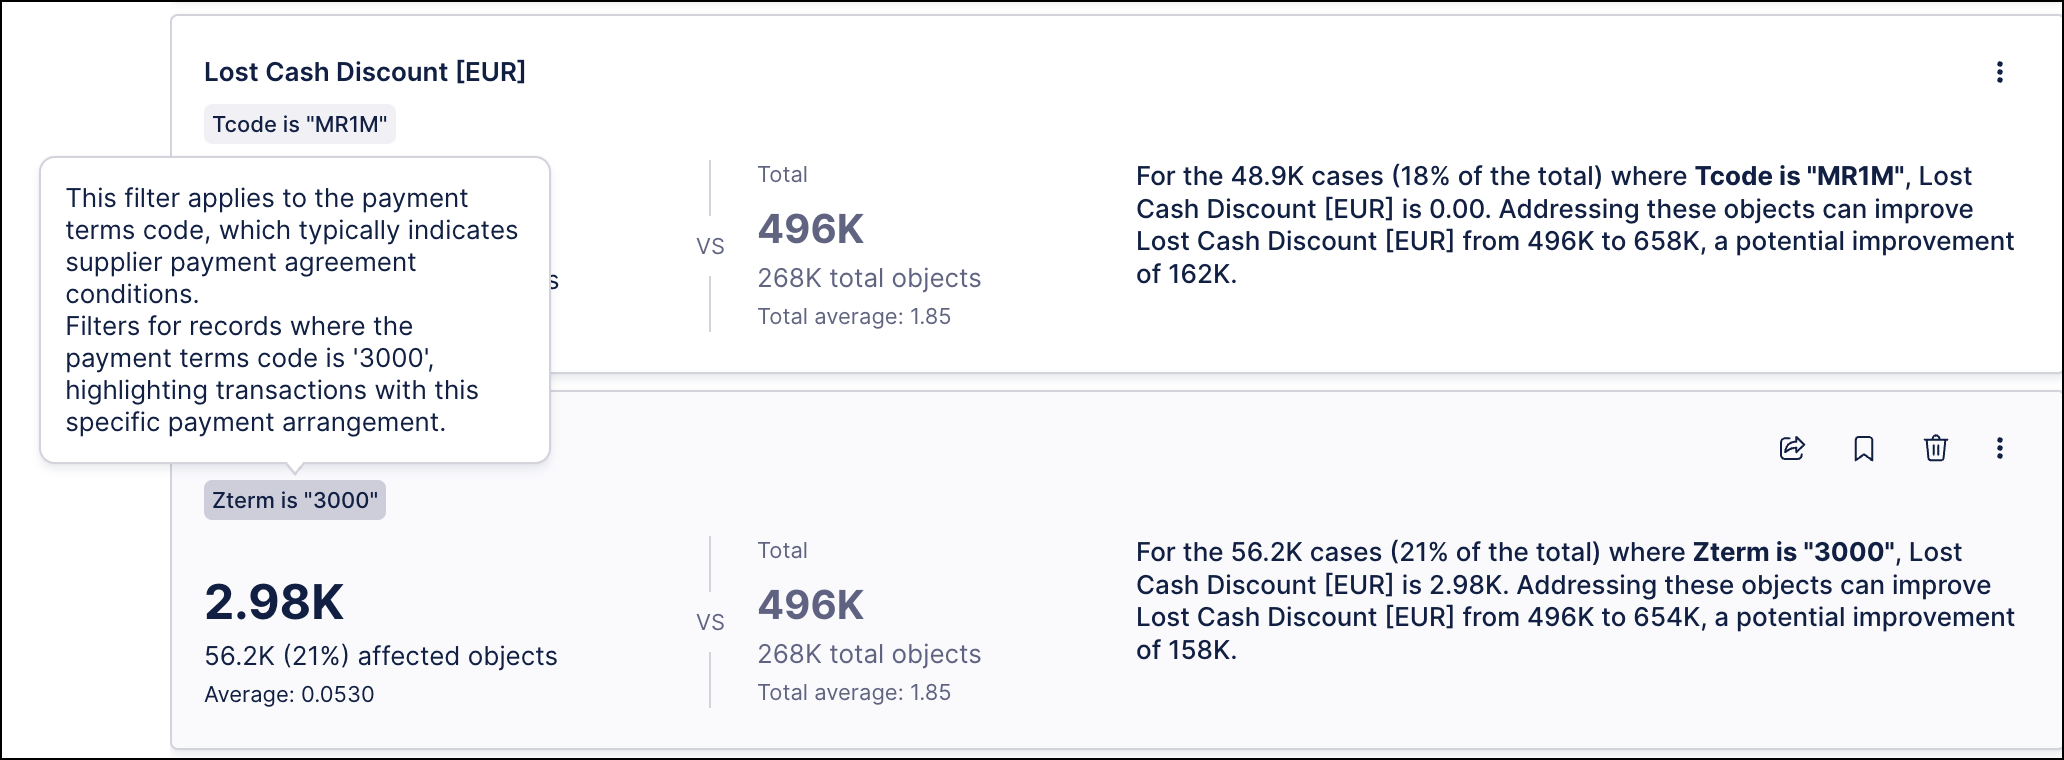
Each insight includes an AI-generated explanation of the filters shown on the insight cards. To view the explanation, hover your cursor over the gray rectangle below the heading on any insight card to open a pop-up window with an explanation of the filter. These explanations can provide information such as an overview of the filter criteria applied, a translation of any jargon such as the names of source-system columns or country codes, or suggestions for possible solutions to improve the metric used in this insight.
Note
The filter explanations are generated by AI and should be verified for accuracy as errors may occur.
 |
Click anywhere outside of the pop-up to close the explanation window.
You can also perform a more in-depth analysis by applying a filter based on the criteria for a specific insight. Using these temporary filters, you can dive deeper into a group of object instances within a particular insight and then generate additional insights based on that group. This provides the ability to drill down further on any insight generated by your Insight Explorer.
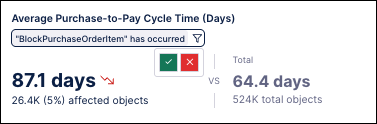
These temporary filters are applied by hovering on the filter for an insight and then clicking the filter icon on the right side. Click the Apply Filter button to create a filter based on the case cohort for this specific insight. To remove this temporary filter, click the filter icon again and select the Remove Filter button.
The potential improvement measures the impact of an insight which helps you compare insights against each other. The potential improvement attempts to balance the size of a subgroup with its performance, emphasizing insights that are not so small that they are insignificant and yet not so big that they are unrealistic. The potential improvement is not intended to be a precise calculation and should be combined with other factors to assess the value of the insight.
Specifically, the potential improvement is calculated by comparing the value of the metric within the subgroup versus outside the subgroup and simulating the change in the global value of the metric if the subgroup were brought to the level of the rest of the population. The following examples illustrate this in more detail.
Example 1 |
|
Example 2 |
|
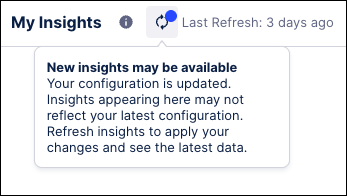
Insights are not refreshed automatically when changes are made to the underlying Data Model or Knowledge Model. If these changes happen, you will see a warning icon on the Last run button in the toolbar that new insights may be available. Click the Run Analysis button to re-run the analysis in order to avoid inconsistencies between insights within Insight Explorer or between Insight Explorer and other assets connected to the same Knowledge Model.
Click any insight to access the Insight Details page, where you can do follow-up analysis using the provided tables and visualizations.
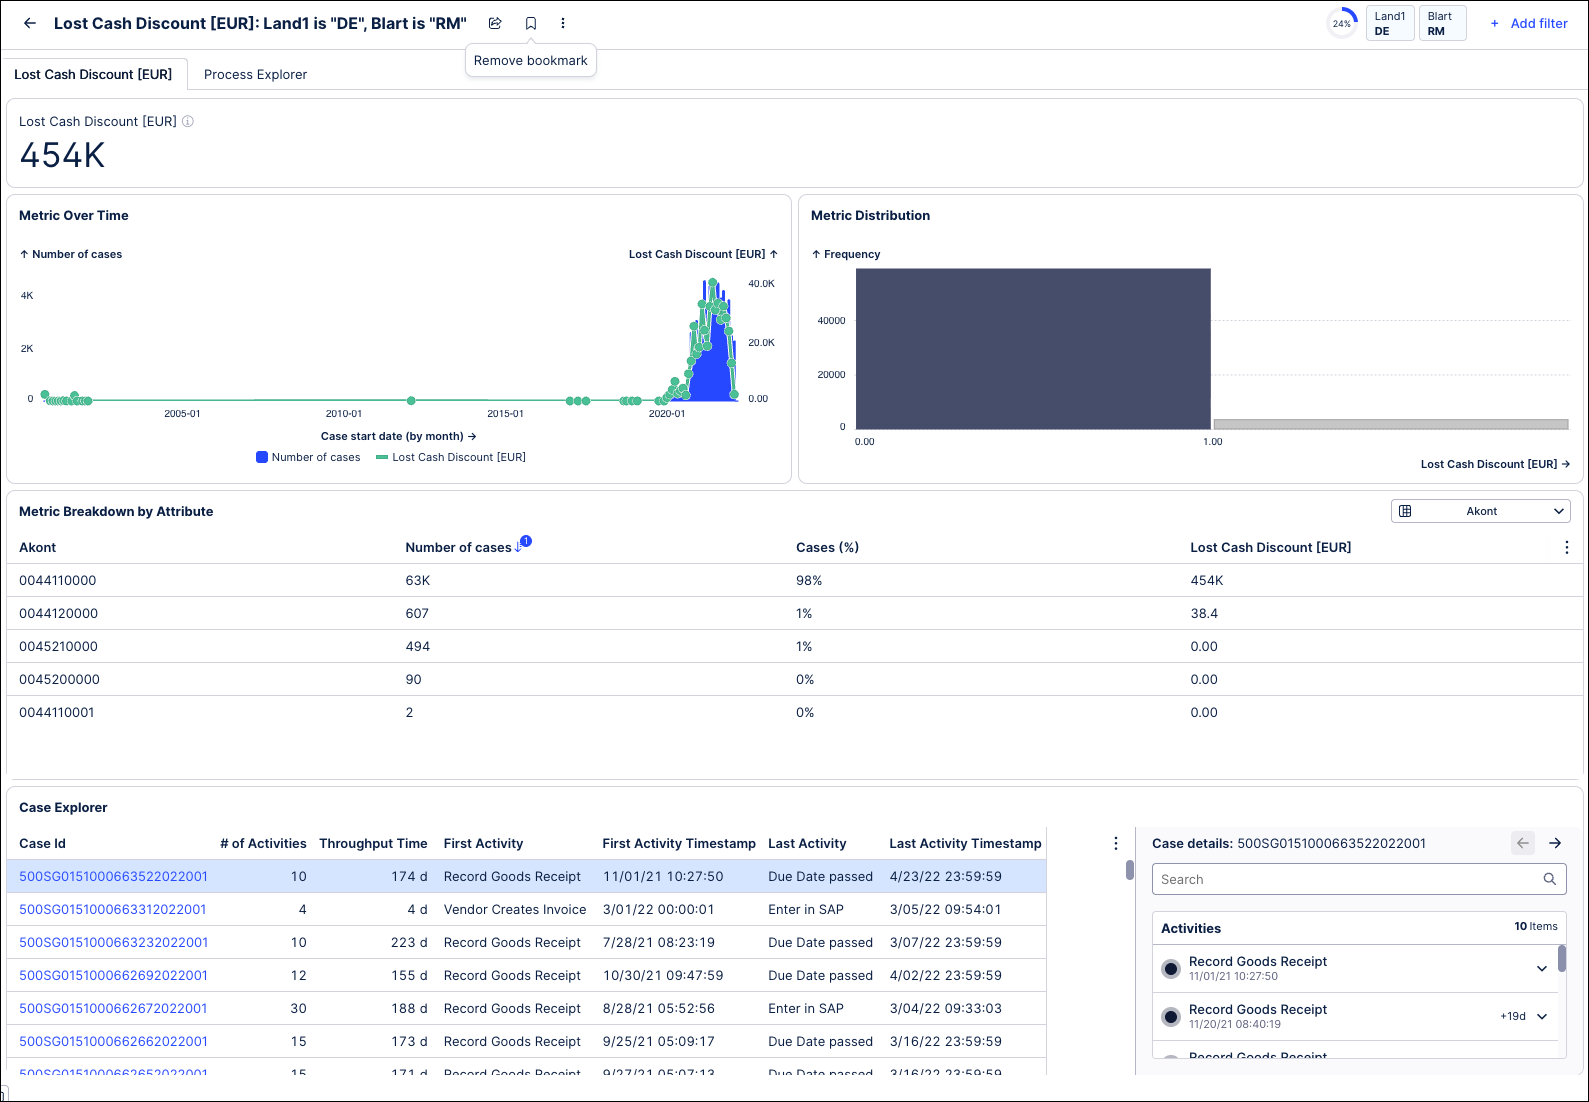 |
The View section of the details page contains:
View
Metric evolution over time, metric distribution, metric breakdown by various attributes
Case Explorer for a granular look at the specific objects affected
Filters
The View is filtered on the insight by default.
The header section of the details page contains:
The insight you are currently investigating. When you apply or remove a filter in the View section, the scope and potential improvement of your insight is recomputed to reflect the filter changes.
Save filter changes: Save your filter changes to the insight so that the updates are persisted from the details page to the main page.
Export to View: Export the insight details to a new View in the package to make customizations or configure Actions.