May 2025 Release Notes
TASK MINING Version 2.19.0 of the Task Mining Desktop Application (2025-05-30)
We've released a new version of the Task Mining Desktop Application, including updated versions of the Chrome and Edge browser extensions. This provides improved support for data gathering where multiple users are accessing a single machine.
For more information, see Installing the Task Mining Client software.
STUDIO Insight Explorer updates (2025-05-29)
Insight Explorer is getting updated with several functional changes to the configuration process. These changes will improve ease of use and provide more control over how insights are generated.
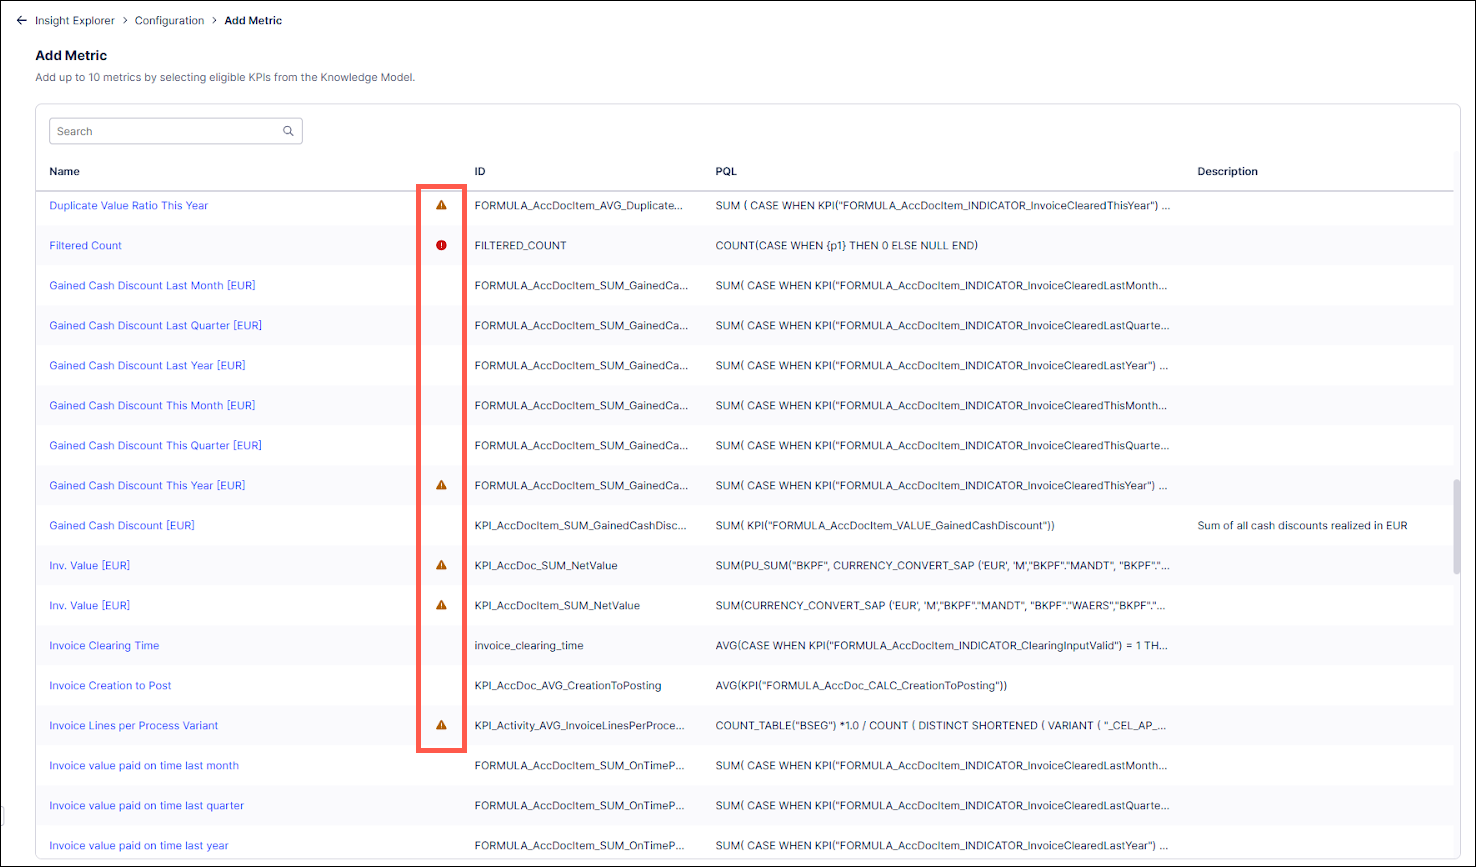
Knowledge eligibility pre-check
Insight Explorer now executes a check on the full Knowledge Model when opening the configuration page to determine eligibility, no longer requiring individual checks for each selection. Eligible items display with no icon, non-eligible items show an error icon, and items that might need changes appear with a warning icon.
 |
For more information, see Configuring an Insight Explorer.
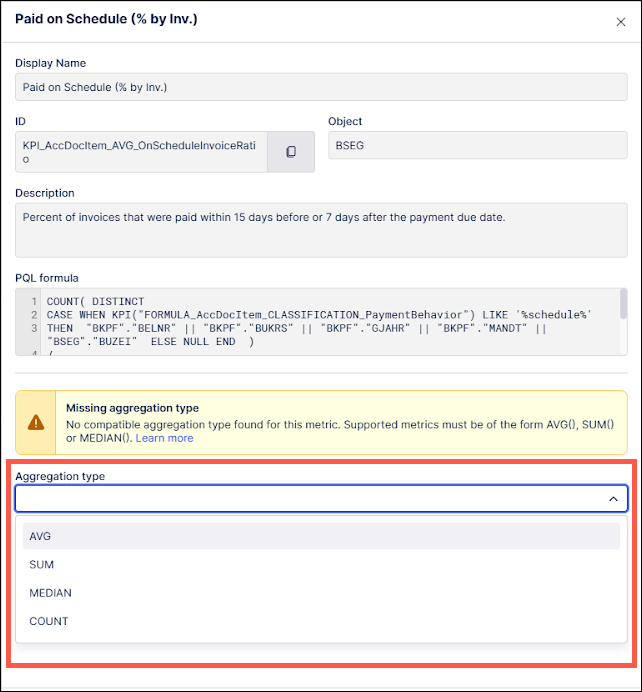
Aggregation type input for metrics
Metrics no longer need to have a PQL formula surrounded by an explicit aggregation function (AVG, SUM, MEDIAN, etc.) to be added to Insight Explorer. Users can now select a metric and its aggregation type during configuration.
 |
For more information, see Aggregation types.
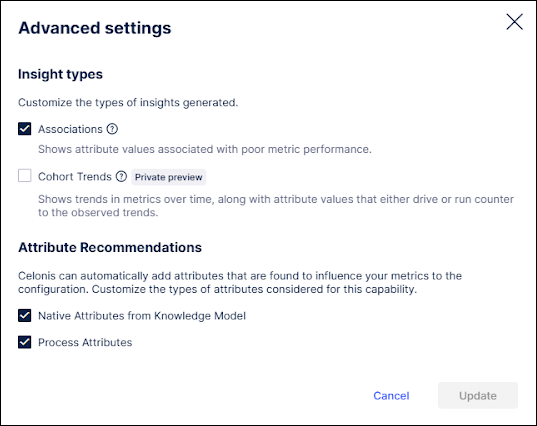
Advanced settings
Users can now edit certain analysis parameters used to generate insights in the advanced settings of Insight Explorer.
 |
For more information, see Advanced settings for Insight Explorer.
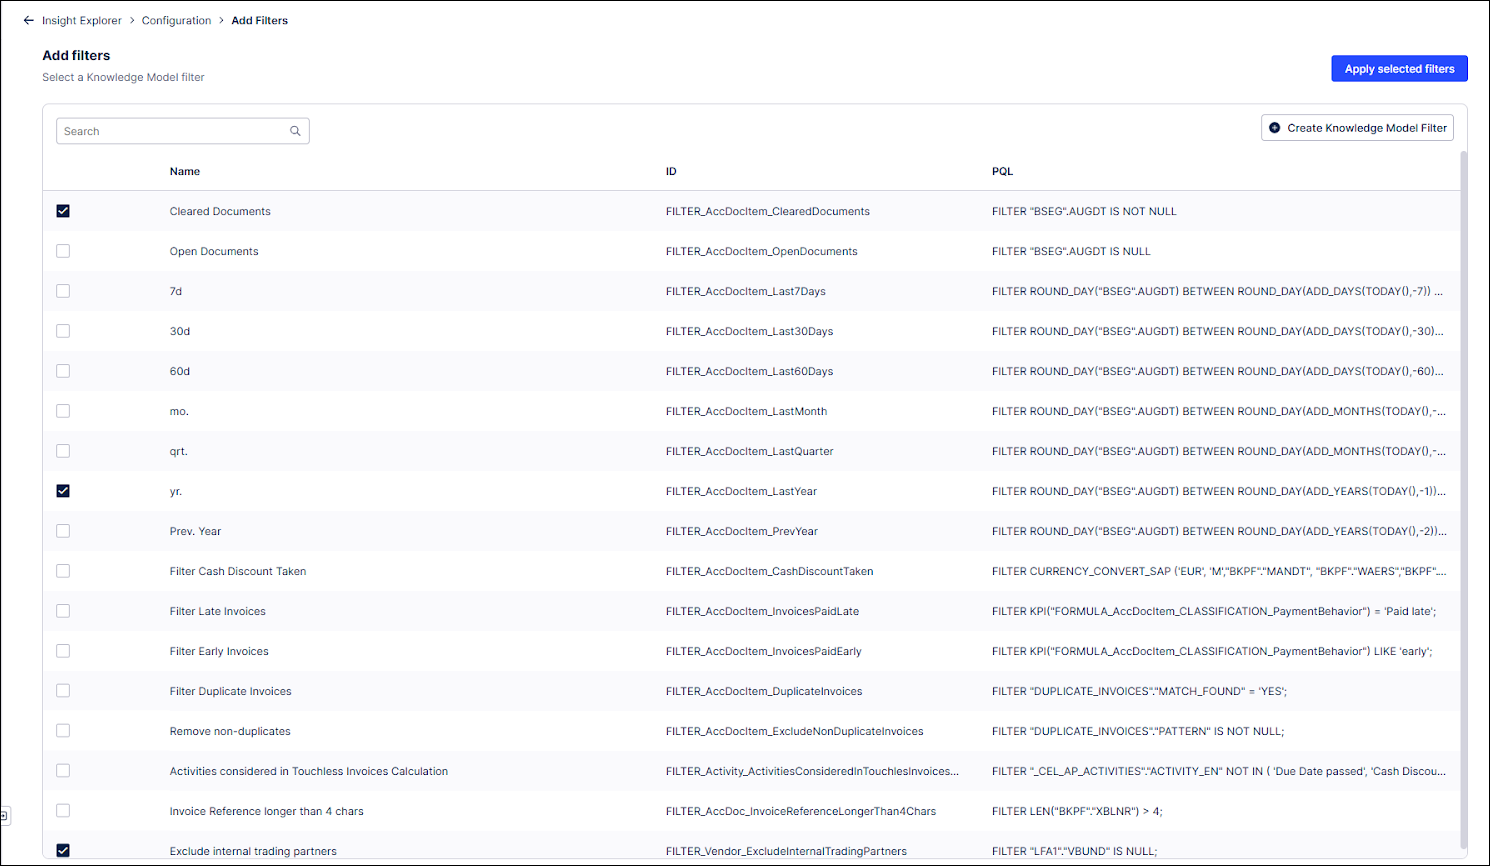
Knowledge Model filter support
Users can now add filters stored in the Knowledge Model to Insight Explorer by selecting them from the Add filters screen and clicking the "Apply selected filters" button.
 |
For more information, see Add filters to Insight Explorer.
STUDIO Localized formats based on current region in user profile (2025-05-29)
We're introducing localized formatting for numbers and dates in your Studio Views, Legacy Views, Knowledge Models, and Apps according to the current location defined in your user profile.
These configurations are specific to your profile and can be configured by clicking Edit Profile and selecting your Region:
The platform will render all dates and numbers in the localized format when available.
For Studio assets to be localized, they need to be updated with the correct formats - see: Localizing number and date formats.
API Subscription API added to Process Intelligence (2025-05-27)
The Celonis Process Intelligence API has been expanded to include the Subscription API. This API can be used to integrate third party workflows and automations with the Celonis Platform. Using the Subscription API, users will be able to subscribe to Knowledge Model triggers in Celonis and receive notifications in real time when specific events occur or certain conditions are met, which allows for faster reactions to these events.
The Subscription API enables third party products to discover and subscribe to Knowledge Model triggers, allowing Celonis to automatically initiate third party procedures. For example, this API can be used to create a notification when the Knowledge Model is updated when a purchase order is canceled or a payment is received which will then initiate a workflow in the third party application in response.
As part of the Subscription API, new endpoints will be available to help users:
List available Knowledge Model triggers
Update a subscription with a new destination address and credentials
Pause a subscription
Resume a subscription
Replay a subscription
Terminate a subscription
List all current subscriptions
For more information, see Process Intelligence API on the Celonis Developer Center.
MACHINE LEARNING Updated user interface for the Machine Learning Workbench (2025-05-23)
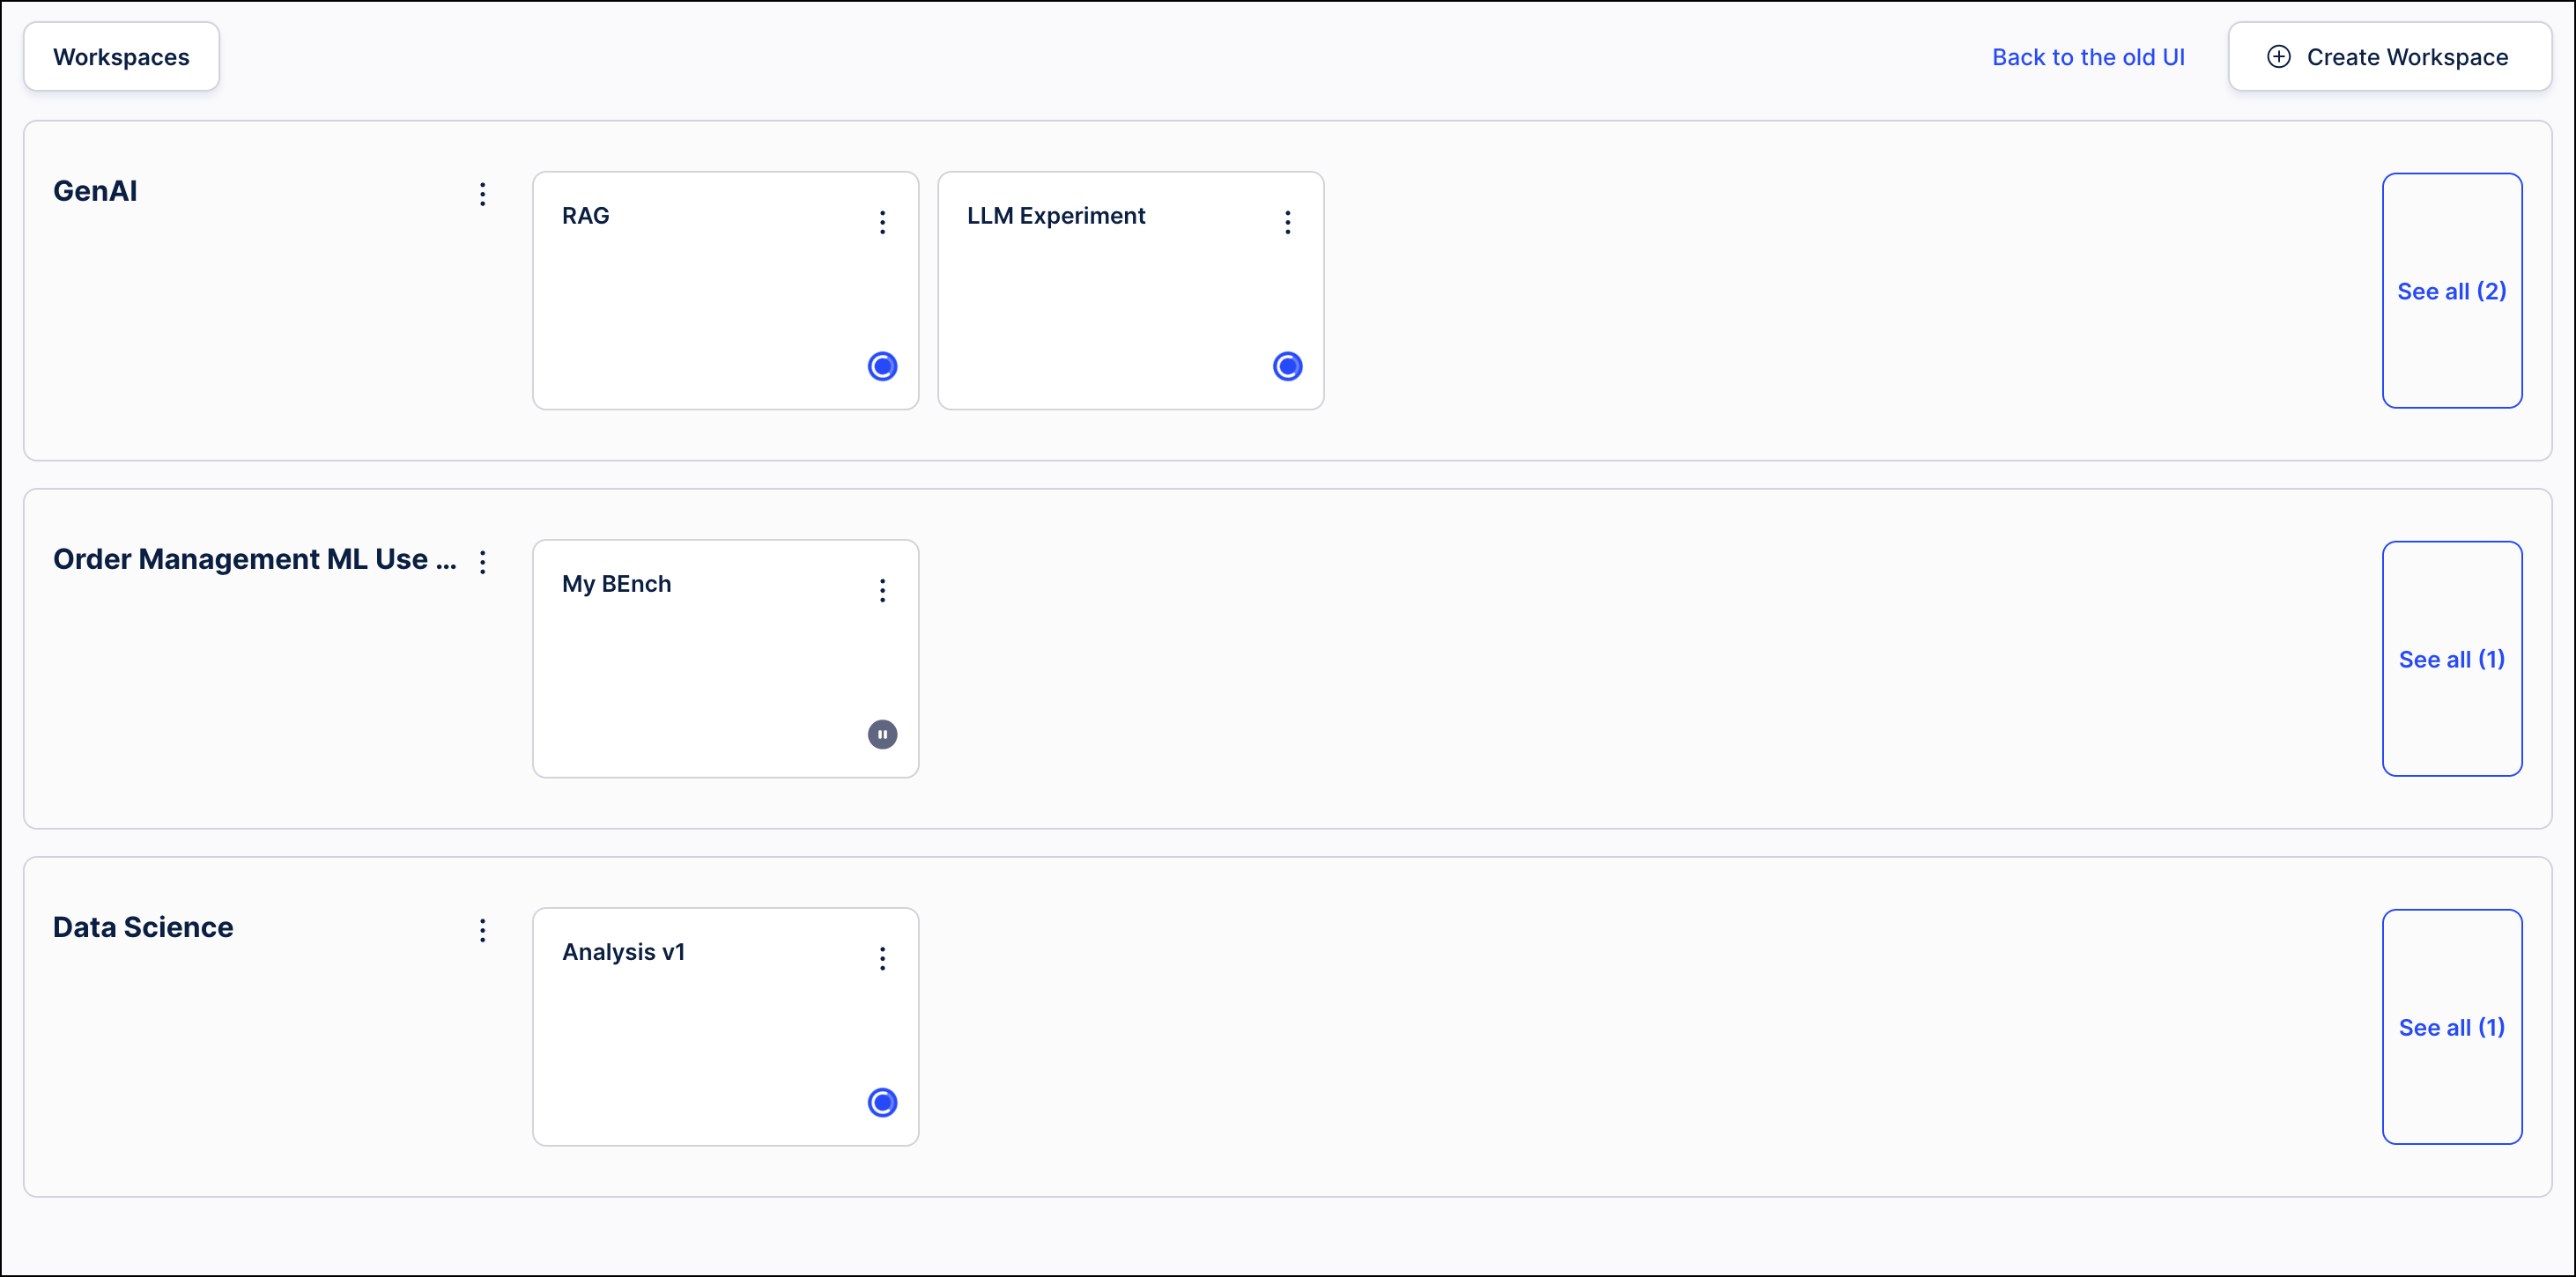
The user interface for the Machine Learning Workbench (MLWB) is being updated with a cleaner and more modern look that is more aligned with the rest of the Celonis platform. This new interface does not provide any additional functionality, so it will not change how users interact with their existing workbenches, but this update will make it easier for Celonis to release new MLWB features in the future. This new interface will be applied to all existing workbenches automatically, however, users will still be able to access the previous interface by clicking the Back to the old UI link in the upper right corner. Users can then click the Go to the new UI link in the older interface to return to the updated version.
 |
PI Graph Upgrades to the import from table process (2025-05-22)
The Import from table process in the Objects and Events module has been updated with the following changes:
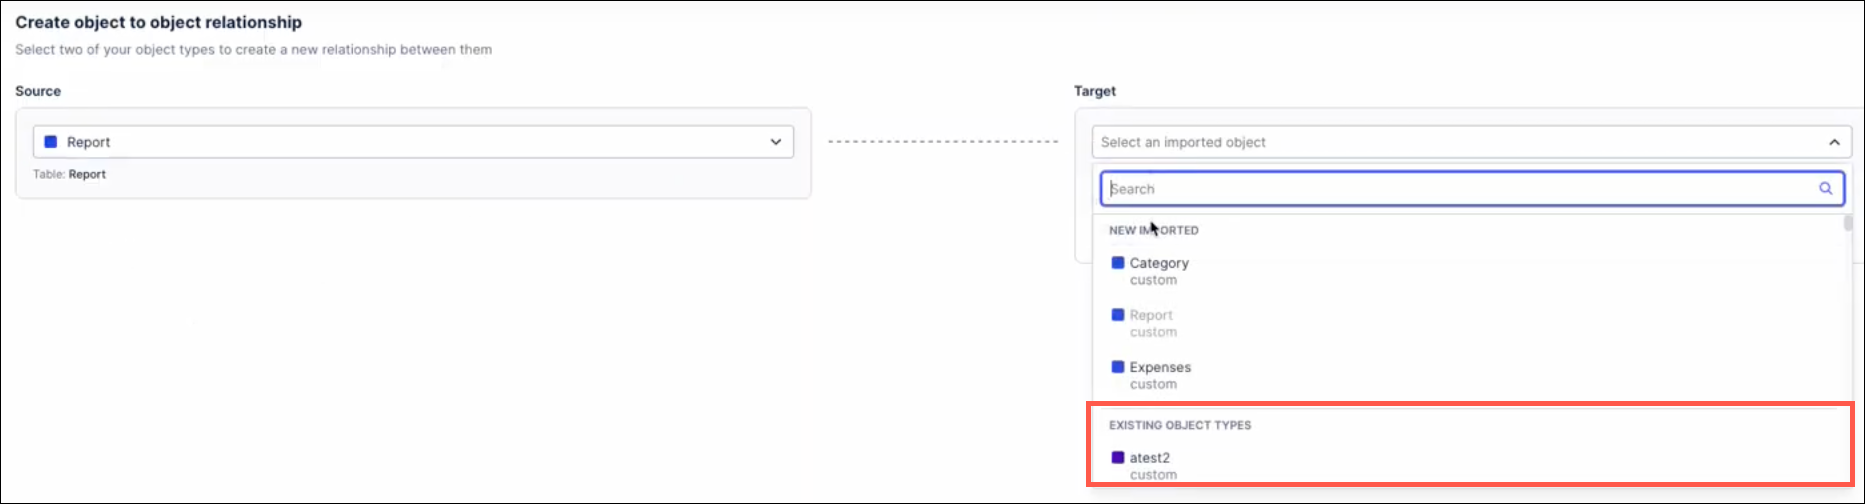
When importing from a table, users can now create relationships between objects being imported and existing object types. Previously, relationships could only be created with other object types being imported. With this upgrade, the Target dropdown on the Create object to object relationship screen now includes “Existing Object Types” in addition to the objects being imported. Selecting one of these options allows users to create a relationship between an object being imported and those existing object types. If the user selects the foreign key from the source object, the transformation will still be created automatically when selecting an existing object type as the target.
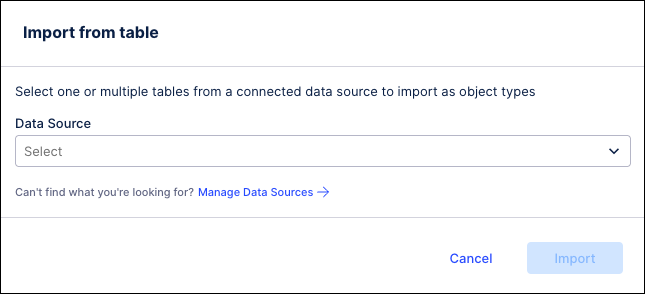
When creating an object type by importing from a table, users will now receive the Import from table prompt to choose their data source and begin the import process. Previously, users would see a blank screen and had to click the Import button again to begin the import process. This new prompt simplifies the import process and guides users through selecting their data source, choosing the tables to import and mapping the table columns.
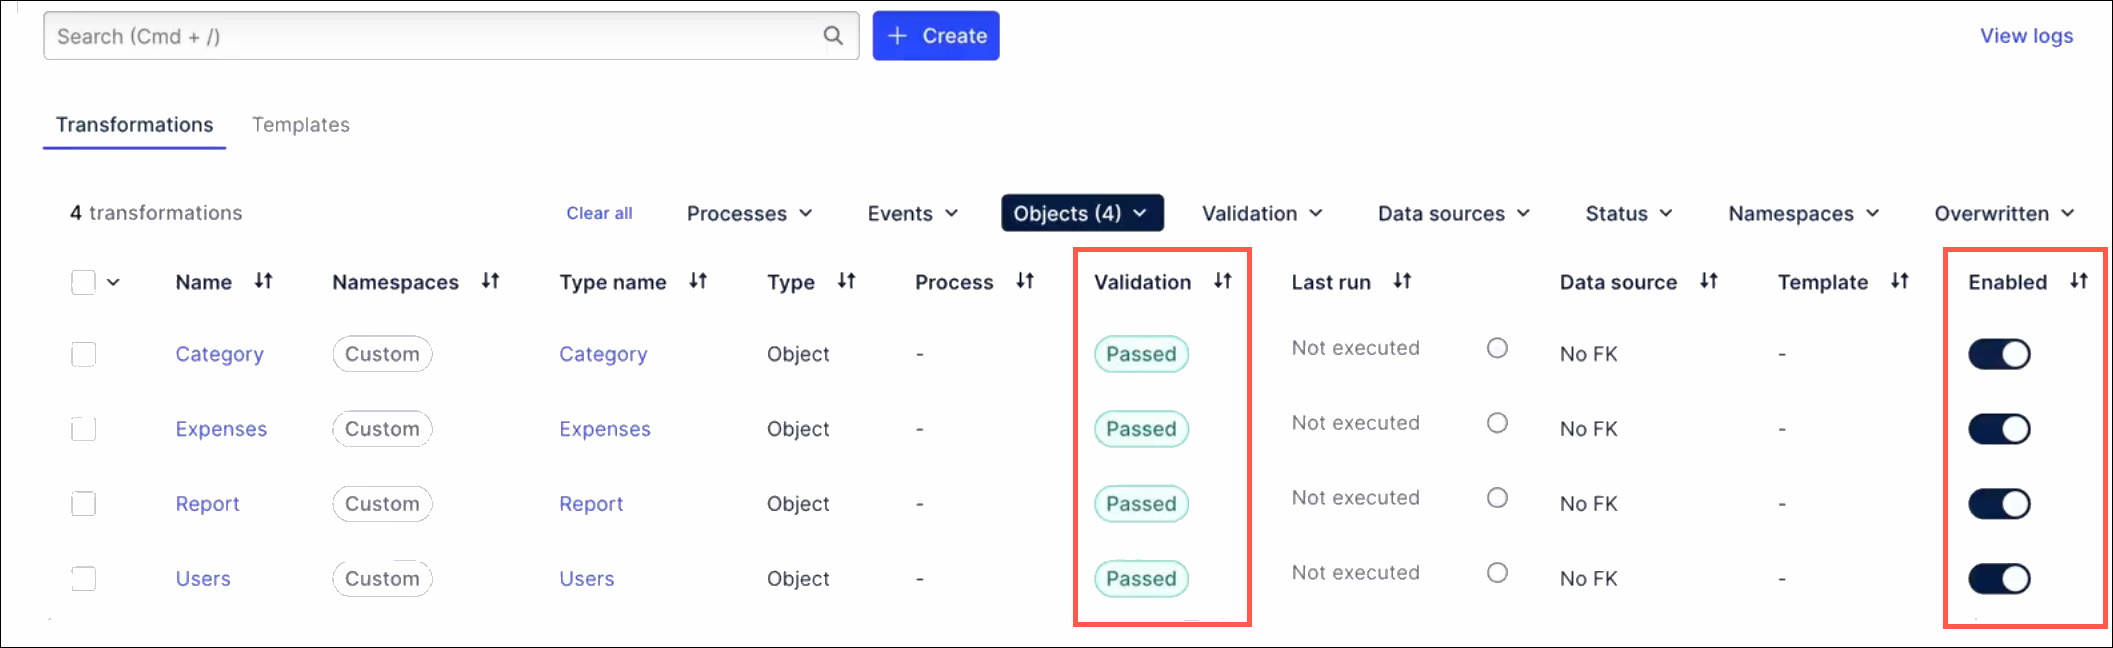
The process for creating new object types has been modified so that valid transformations will be enabled by default. When the new object type is created, the transformations will be validated automatically and set to “enabled” by default.
The discard changes dialog has been updated for clarity. This dialog now reads “You have unfinished work” to communicate that the import process has not been completed. This dialog is only displayed if the tables have been selected and the user clicks the “Cancel” link. If the user clicks “Cancel” before selecting tables, the dialog will not be displayed and the user will return to the Objects screen.
DATA INTEGRATION Public Preview: Zero-copy connectivity with Microsoft Fabric (2025-05-21)
You can now establish zero-copy connectivity between your Microsoft Fabric enterprise data lake and the Celonis Platform, allowing you to share data between the platforms with zero latency. This means that any updates in your data lake are automatically shared to your Celonis data pool.
The benefits of this connection include:
Enables you to mirror your Microsoft Fabric data to Celonis via a zero-copy integration.
Embeds Celonis as a native workload within your Microsoft Fabric environment.
Secures your data as it remains in its original location, preserving your data governance.
To learn more about connecting to your Microsoft Fabric account, see: Microsoft Fabric.
And for a video demo:
PROCESS ADHERENCE MANAGER Support added for dynamically-generated or relabelled events and case-centric data models (2025-05-20)
Process Adherence Manager now supports dynamically-generated or relabelled events, allowing you to specify the granularity of your process by adding attributes to existing event types. This means you don't need to know all the event types you'll need when you start creating your model; instead you can simply and flexibly add them as required.
You can define dynamically-generated or relabelled events in the following ways:
In the Object and Event Log Builder.
In the Knowledge Model event log definition using PQL.
You can also rename dynamically-generated or relabelled events in the PQL Editor.
We’ve also added support for case-centric data models, meaning Process Adherence Manager now works for both object-centric and case-centric data models.
To support these enhancements, provide better alignment with Studio and give a more consistent experience across the Celonis Platform, we've also made the following changes:
Lead event logs are no longer used in Model Miner.
Dedicated event tables are no longer created for each event type; instead all event logs are added to a single Process Adherence Manager event table.
When exploring deviations, data coverage now shows the percentage of all cases across all involved event logs (weighted average).
We’ve removed the event/event log filter to improve consistency with Views.
STUDIO Copying filters between Views (2025-05-20)
This feature is currently available as a Private Preview only
During a Private Preview, only customers who have agreed to our Private Preview usage agreements can access this feature. Additionally, the features documented here are subject to change and / or cancellation, so they may not be available to all users in future.
For more information about our Private Preview releases, including the level of Support offered with them, see: Feature release types.
Any filters you set in a View can now also be copied into other Views within your Celonis Platform team, saving you from manually configuring them each time. Copied filters are saved on a clipboard for 10 minutes, with a prompt for you to apply the filter when you open subsequent Views.
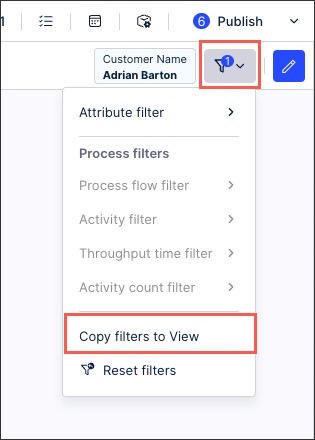
To learn more about copying filters between Studio Views, see: Filtering Views.
STUDIO Updated Python tool for Process Copilots (2025-05-19)
The Python tool in Process Copilots is designed to allow ad-hoc Python code executions. With this launch, we’re releasing a visual editor for the Python tool and allowing users to customize the tool. This editor can be added to the configuration settings of a Process Copilot as a tool to utilize both of these configuration methods.
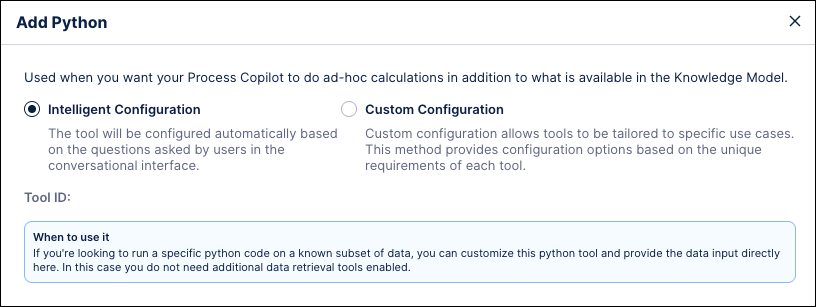
In the Intelligent Configuration, the Large Language Model (LLM) generates Python code based on the questions users ask to this Process Copilot. For Process Copilots utilizing the Intelligent Configuration, the Python code is generated ad-hoc as questions are asked. In the Intelligent Configuration, to run Python code, the LLM needs a dataset on which to run the code. To provide the Python tool with an available dataset, you need to have at least one data retrieval tool activated (get_data, pql_tool, get_process_data - depending on the use case).
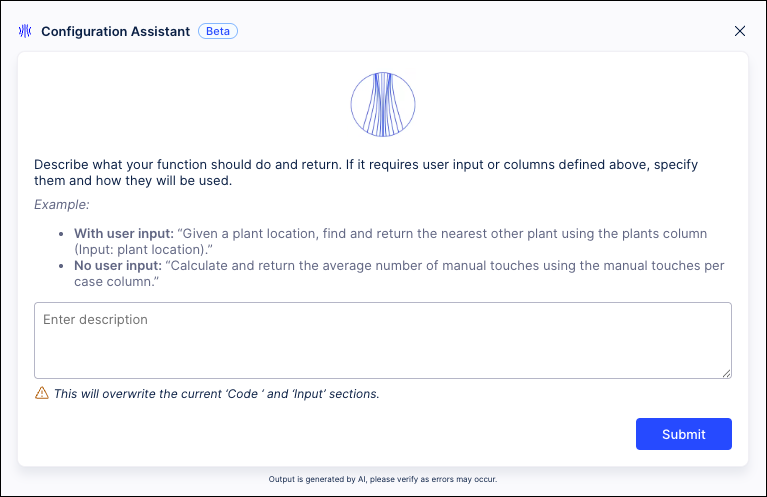
In the Custom Configuration you can manually define the dataset to run the Python code on. Users can then enter their Python code in an editable interface which will work dynamically to expand the code as it is written. This interface also allows users to define which inputs can be used as variables or parameters by end users when asking questions in the chat. Users can also use the built-in code assistant to create their Python code using natural language commands to describe the use for this code.
For more information, see Tool Activation.
DATA INTEGRATION Changes to Celonis IP addresses (eu-2, jp-1, uk-1, us-2) (2025-05-16)
We’ve added Celonis IP as origin addresses for eu-2, jp-1, uk-1 and us-2. If you have IP allowlisting configured for Celonis-originating traffic, you must add the following IP addresses to avoid connectivity issues with cloud databases and/or on-premises services:
Realm | IPs to be added |
|---|---|
eu-2 | 20.31.2.184 20.31.2.185 20.31.2.186 |
jp-1 | 20.44.169.64 20.44.169.65 20.44.169.66 |
uk-1 | 51.142.213.244 51.142.213.245 51.142.213.246 |
us-2 | 20.99.152.112 20.99.152.113 20.99.152.114 |
For:
A full list of Celonis IP as origin addresses for eu-2, jp-1, uk-1 and us-2, see Celonis IPs as origin.
PI Graph Transformation enhancements (2025-05-15)
We've made a number of enhancements to our Objects & Events transformations, including the following:
Running arbitrary SQL: You can now run any SQL in the SQL editor, regardless of whether the ID column in populated. This enables you to write directly in the SQL editor, rather than returning to the Data Integration area to write a query.
Script errors now highlighted: When running a transformation, script errors are now highlighted. A warning message is displaying which details the missing objects, lines, and columns, making it easier for you to locate and correct issues.
Select perspectives when manually running data jobs: When executing an object-centric data jobs manually, you can now select the relevant perspective(s). The relevant transformations for this perspective are then run automatically.
Duplicate primary key errors: Rather than waiting until the end of the pipeline for the data model load, duplicate primary keys now cause an error directly within the transformations.
Dynamic sizing of information in transformations editor: You can now dynamically view relevant information such as the Data Source schema explorer without the need to expand/shrink panels. This reduces the number of clicks needed, significantly saving you time.
PI Graph Run multiple data jobs for different perspectives (2025-05-15)
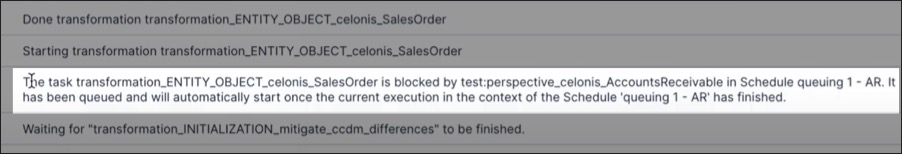
You can now run multiple object-centric data jobs in parallel for different perspectives. If there are overlaps in your required objects or events, the respective transformation will be queued to avoid read-write conflicts.
In this example, a 'Sales Order' object is being used in both the Accounts Receivable (AR) and Order Management (OM) processes. These data jobs are scheduled to run at the same time:
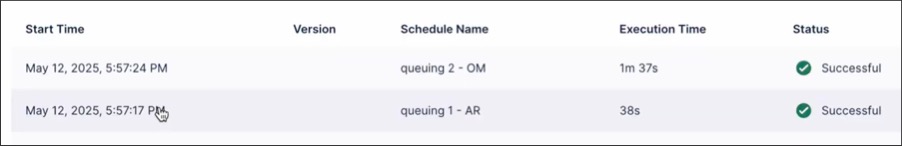
When you check the transformation logs, you can then seen that the OM task is queued while the AR task runs. Once the AR task has finished running, the OM automatically executes:
AUTOMATION IP restrictions for webhooks in Action Flows (2025-05-12)
We're introducing IP restriction for native webhooks in Action Flows. This new setting allows you to select from which IP addresses you want to allow requests to be processed. By default, requests from all IP addresses are accepted. For information on how to configure the IP restriction, see Editing custom webhook settings.
STUDIO Custom KPI Groups in Process Explorer and Variant Explorer now in General Availability (2025-05-15)
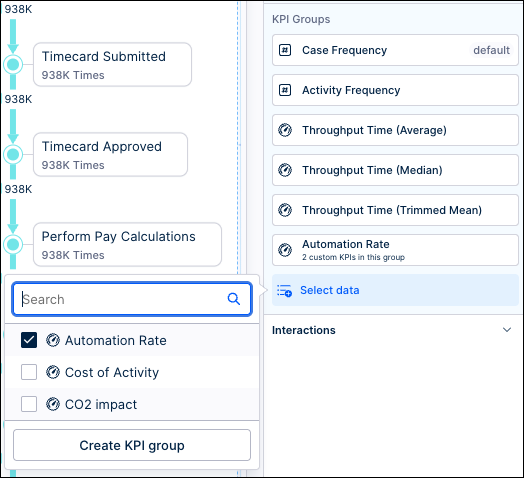
A new feature has been added to both Process Explorer and Variant Explorer which enables analysts to create groups of custom process KPIs that can be displayed in the process graph. Analyst users can create a KPI Group by selecting existing process-related KPIs or defining their own KPIs using the visual editor. The analyst can then share these KPI Groups with their end users who will be able to display these KPI Groups in the process graph of their Process Explorer or Variant Explorer. KPI Groups can be created for both case-centric (single event log, multi-event log) and object-centric process exploration components.
Note
Custom KPI Groups are only available in Studio Views. For components created in Legacy Views, KPIs are still defined using YAML in the Knowledge Model.
The new built-in visual editor allows users to create KPIs without advanced YAML skills and speeds up the creation process for new KPIs. Users are able to define KPIs directly in Studio without having to switch to the Knowledge Model or perform manual coding.
Both KPI Groups and the individual KPIs within those groups are created and stored in a Knowledge Model. As a result, if a change is made to an individual KPI, that change is automatically updated in any KPI Groups to which that KPI was added.
For more information see Custom KPI Groups in Process Explorer and Custom KPI Groups in Variant Explorer.
DATA INTEGRATION Parallel data job executions replaced by smart ETL schedules (2025-05-14)
This release will make smart ETL scheduling the default method for executing all data jobs. Based on historical extractions, an internal algorithm automatically calculates the optimal execution order based on the dependencies and relationships across all tasks. This means once a table has been extracted, the related transformations are then automatically started (while unrelated tables are being extracted). Previously, parallel data job executions performed this function, however they didn't take into account dependencies between the data jobs.
All data jobs will be automatically moved to smart scheduling and will continue to execute as scheduled. This means that there are no alterations or updates needed for your existing data job execution schedules.
For more information about extracting and transforming your data, see: Extracting and transforming data.
ADMIN & SETTINGS AI Settings adding new deployment option and additional usage details (2025-05-12)
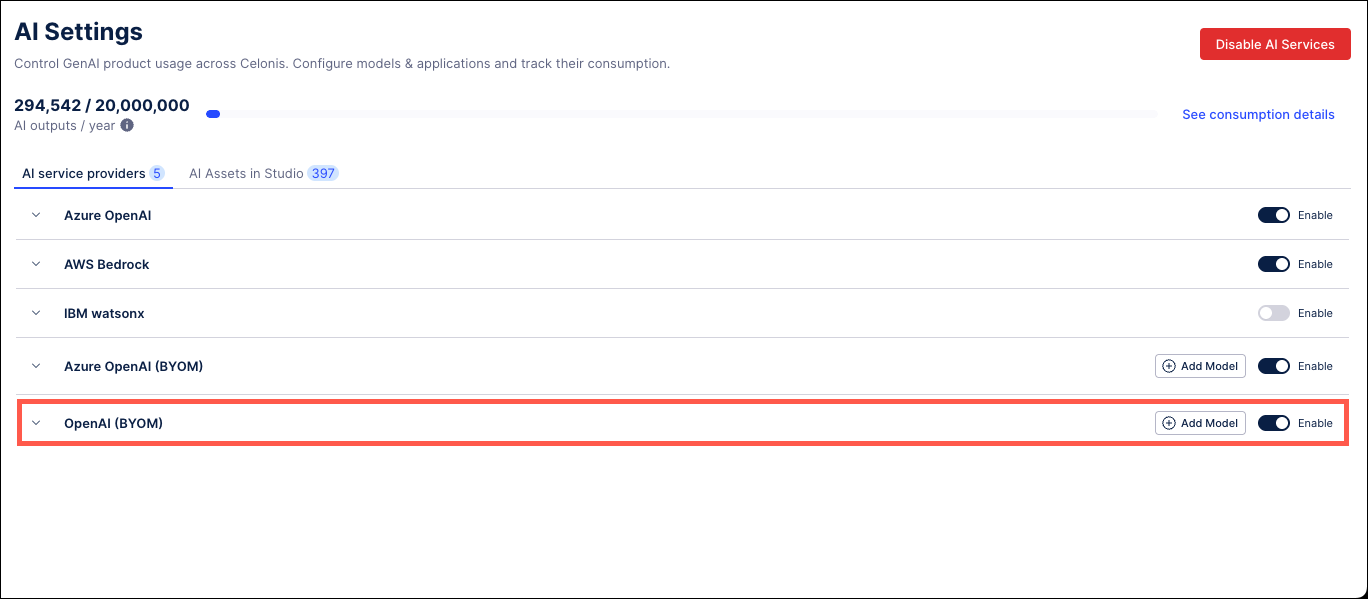
The AI Settings page in Admin & Settings is being updated to include a new option for Large Language Model (LLM) deployments and provide Admins more insight into the AI assets being used by their team. These new features will provide Admins with an additional option for their AI services, as well as providing both more insight into where their assets are being used and more control over the AI Output consumption.
Admins will be able to configure the Bring your own Model (BYOM) option to connect self-hosted LLMs on Azure, AWS and OpenAI compliant environments to their Celonis teams. This feature allows Admins to reuse their existing LLM deployments in Celonis.
 |
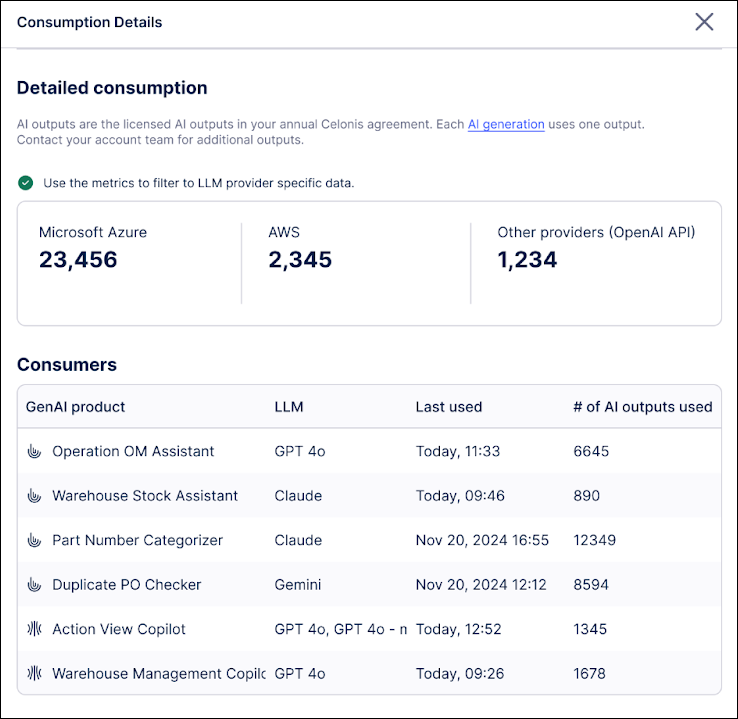
Users can also see the specifics of their AI consumption in the Consumption Details screen by clicking the “See consumption details” in the upper right of the AI Settings screen. From this screen, users can see the total number of outputs being consumed by each Service Provider, as well as a more detailed breakdown of each AI product in the Consumers table, including the assigned LLM, when the product was last used, and the number of outputs consumed.
 |
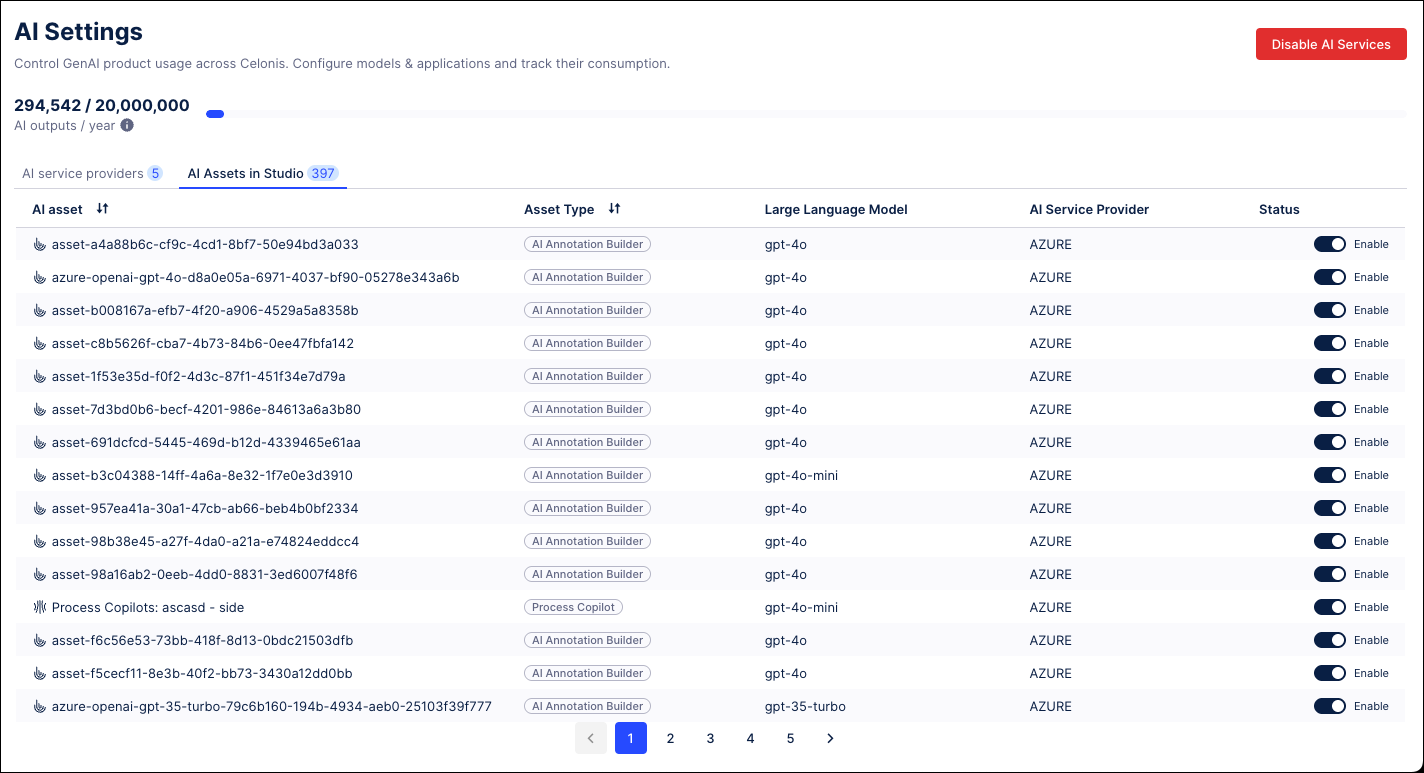
The new AI Assets in Studio tab provides a detailed breakdown of the team’s AI Assets, such as Annotation Builders and Process Copilots, that are currently in use. From this tab, Admins can see where each AI asset is being used, the type of asset, the LLM assigned, and the service provider. Admins can also use the toggle switch to disable individual assets and pause their AI Output consumption.
 |
For more information, see AI Settings.
STUDIO Hide events in Process Explorer (2025-05-06)
Process Explorer is adding a menu for users to control the list of events and activities displayed in their process graph by hiding any specified activities that the user is not currently interested in. For example, users can hide an activity that occurs in all cases or activities that are generated automatically as part of the workflow. By hiding these activities, the user can focus on the activities they are most interested in.
Note
This feature is only accessible in Process Explorer when using sliders to control the process graph and will not be available when using the panel.
The menu is displayed in the upper right of the Process Explorer and shows both the total number of activities and the number of activities currently selected, such as 17 of 21 events in the multi-object screenshot below. After clicking to expand the menu, users can select the check boxes to indicate which activities to include in the process graph. Removing the check mark will cause an activity to be hidden.
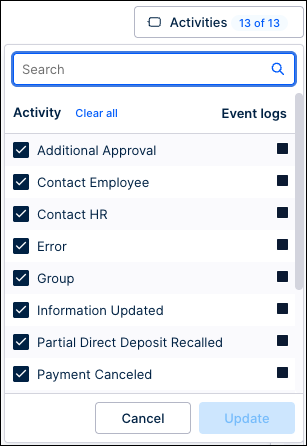 | 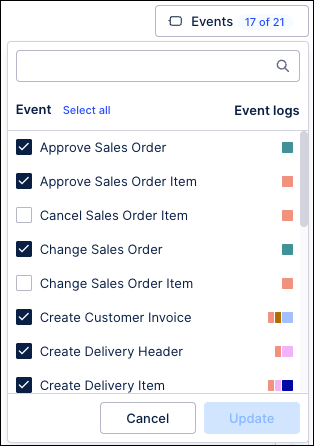 |
Activities menu - case centric | Events menu - multi-object |
Once all activities have been selected, click Update to apply the changes and refresh the process graph. The totals and KPIs on the process graph are updated based on the selected activities. The global sliders are also updated to reflect the total number of available activities based on the menu selections.
Note
Hiding an activity from the process graph does not filter out cases with that activity, it only prevents it from displaying in the graph. The counts in the process graph will be updated when an activity is hidden and are updated again if an activity is added back to the process graph.
For more information, see Show / Hide events in PE.
PI Graph Object & Events enhancements (2025-05-05)
We've made two enhancements to our Objects & Events product area:
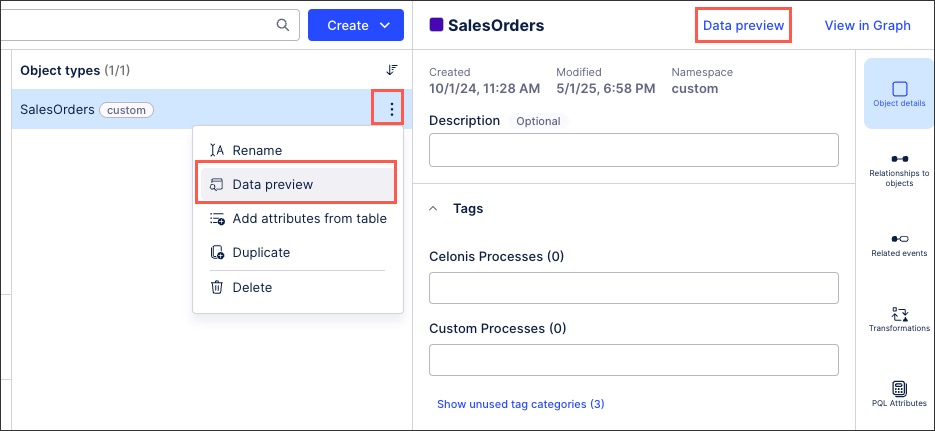
Object data preview: You can now preview your objects once a transformation has successfully run, giving you a 100 row sample of the data.
You can access a data preview while viewing the object by clicking Data preview (or alternatively clicking Options - Data preview for each object).
Enhanced integration between Perspectives and Studio: When viewing your perspectives, you can now see the last time the data model loaded and which Studio packages the perspectives are used in. You can also click the data model name to view a preview.
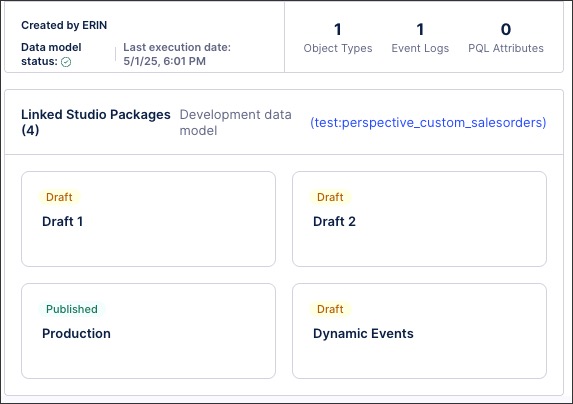
For more information about modelling your objects and events, see: Modeling objects and events.
CELONIS FOR CONSULTING New project plans released and upgrades to existing plans (2025-05-05)
With this release, we've added five new project plans to our Celonis for Consulting product area. These new project plans are:
Audit: This plan allows for leveraging Celonis to conduct enhanced and faster external audits of clients' quarterly and annual financial statements across core business processes.
Blueprint: This plan enables Celonis' process management capabilities for establishing strong governance for compliance, risk reduction, and process standardization. Gain operational visibility, identify improvements, and build standardized, compliant processes to reduce risk and enhance efficiency.
Modeling: This plan elevates BPO/AMS engagements with standardized governance using Celonis Process Management (CPM). This ensures sustained compliance and enables BPO process optimization for consistent operations and continuous refinement of processes.
Scan: This plan accelerates process optimization using Workforce Productivity (Task Mining). It provides rapid, light-touch analytics to capture work performance and quickly identify improvement areas and develop data-driven business cases for impactful change.
Monitor: This plan optimizes BPO/AMS by scaling Workforce Productivity (Task Mining). Gain data-driven insights into outsourced workforce activities to collaboratively identify and implement operational enhancements for increased productivity and margins.
We've also significantly upgraded our existing project plans (Discover, Execute, and Operate), introducing new features and enhanced capabilities.
For an overview of these plans, head to: Celonis for Consulting.
CPM Login page refresh (2025-05-02)
We've updated the CPM login page to use Celonis branding and logos. All other functionality remains the same.
As part of the rebrand, summary emails sent by the platform now use the Celonis Process Management name, rather than Symbio.
For more information, refer to the documentation.