Configuring a waterfall chart in legacy views
Legacy view component
You're currently viewing a topic about a legacy view component in Studio. This component can still be used in legacy Studio views, however we recommend using the visual view editor in the new Studio experience. The updated interface includes drag and drop capabilities, allowing you to easily add components and configure your views.
For more information, see: Views.
Display your data using a waterfall chart, which visualize positive and negative changes to a value.
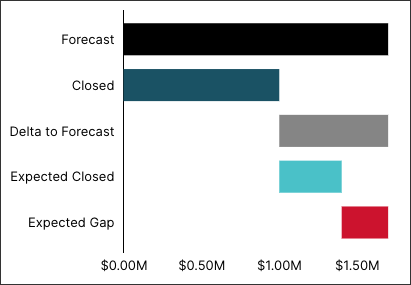
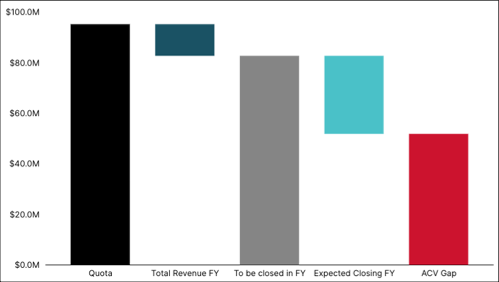
Waterfall charts can be displayed in horizontal and vertical orientations.
An example of a horizontal waterfall chart:
And an example of a vertical waterfall chart:
Horizontal waterfall chart configuration
To configure a horizontal waterfall chart, the following YAML example can be used:
- id: waterfallChartHorizontal
  type: waterfall
  settings:
    name: Horizontal Waterfall Chart # enter title here
    orientation: horizontal
    kpis:
      - kpi: GEN_Quota # required, add the id of a KPI here
        color: BLACK # possible color options can be found below
        subparts: # optional, define sub-level KPIs
          - kpi: GEN_Total_Rev_FY
            color: BLUE_40
          - kpi: GEN_pipe_to_be_closed
            color: GRAY_20
            subparts:
              - kpi: GEN_expected_closing_FY
                color: BLUE_20
              - kpi: GEN_ACV_Gap
                color: RED_30
Vertical waterfall chart configuration
To configure a vertical waterfall chart, the following YAML example can be used:
- id: waterfallChartVertical
  type: waterfall
  settings:
        name: Vertical Waterfall Chart
        orientation: vertical
        kpis:
      - kpi: GEN_Quota # required, add the id of a KPI here
      - kpi: GEN_Total_Rev_FY_MINUS
        color: BLUE_40 # optional, possible color options can be found below
      - kpi: GEN_pipe_to_be_closed_MINUS
        color: GRAY_20
        subparts: # optional, define sub-level KPIs
          - kpi: GEN_expected_closing_FY_MINUS
            color: BLUE_20
          - kpi: GEN_ACV_Gap_MINUS
            color: RED_30
Adding position lines to waterfall charts
You can also add position lines to your waterfall chart using this YAML example. Position lines can be defined with a constant value or with a KPI.
id: waterfallChartVertical
type: waterfall
settings:
  name: Horizontal Waterfall Chart
  orientation: horizontal
  positionLines:
    - value: 20
      color: RED_10
      style: solid
      label: true
      title: Q1 Target
    - kpi: GEN_Quota
      color: RED_10
      style: solid
      label: true
      title: FY Target
  kpis:
    - kpi: GEN_Quota
      color: GRAY_20
      subparts:
        - kpi: GEN_Total_Rev_FY
          color: BLUE_20
        - kpi: GEN_expected_closing_FY
          color: BLUE_40
        - kpi: GEN_ACV_Gap
          color: BLUE_50
knowledgeModelKey: SIMPLE_CHARTS
Waterfall chart colors
When configuring waterfall charts, the following colors are available:
Black
Blue
Gray
Green
Pink
Purple
Red
White
And the possible color enum values are:
<HUE>_10
<HUE>_20
<HUE>_30
<HUE>_40
<HUE>_50
As an example, the following YAML shows three different hues of blue:
    - kpi: GEN_Quota
      color: GRAY_60
      subparts:
        - kpi: GEN_Total_Rev_FY
          color: BLUE_20
        - kpi: GEN_expected_closing_FY
          color: BLUE_40
        - kpi: GEN_ACV_Gap
          color: BLUE_70