Creating and managing customer journey maps
A Customer Journey Map (CJM) is a visual representation of the end-to-end experience a customer has with a product, service, or organization. It is used to understand and improve customer interactions by mapping them against internal business processes. By mapping your customer journeys, you can integrate the customer perspective directly into process design, ensuring that processes are not only efficient internally but also deliver a positive and consistent customer experience.
The benefits of mapping your customer journeys include:
Visualization: Visually documenting the entire customer journey across multiple touch points helps you to identify customer habits states, expectations, and pain points.
Touch point analysis: Understand where your customer interaction occurs and how it can be improved.
Persona management: Define customer personas to better understand needs and behaviors and align your processes with specific persona expectations.
Experience indicators: Measure and track customer satisfaction over time by assigning specific KPIs to process steps.
Integration with processes: Ensure that back-end efficiency supports front-end experience.
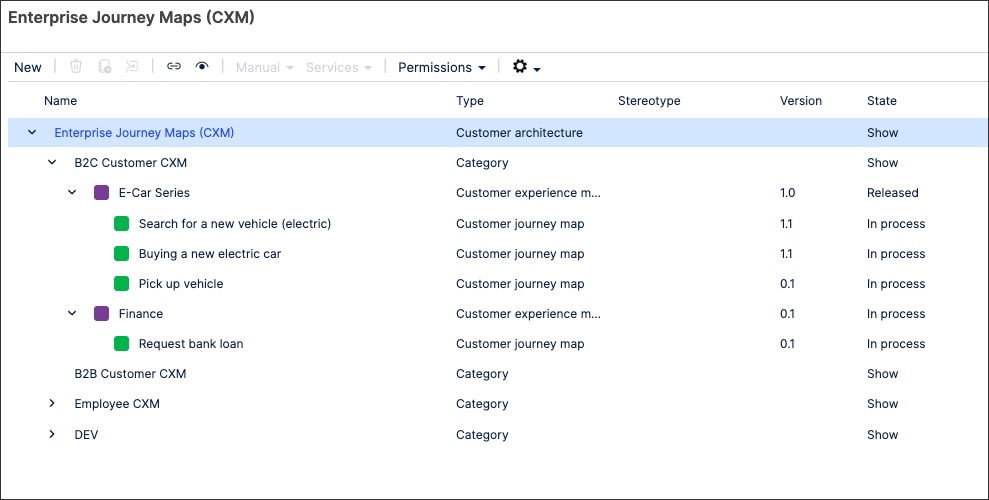
In Process Designer, CJMs are created by creating and managing customer experience objects, such as touch points, sales channels, and steps. In this example, both B2C and B2B customer customer experience objects are being managed in Process Designer:
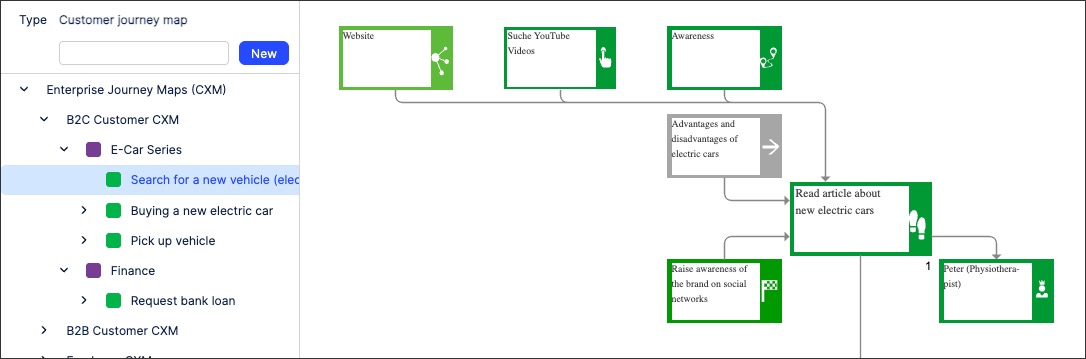
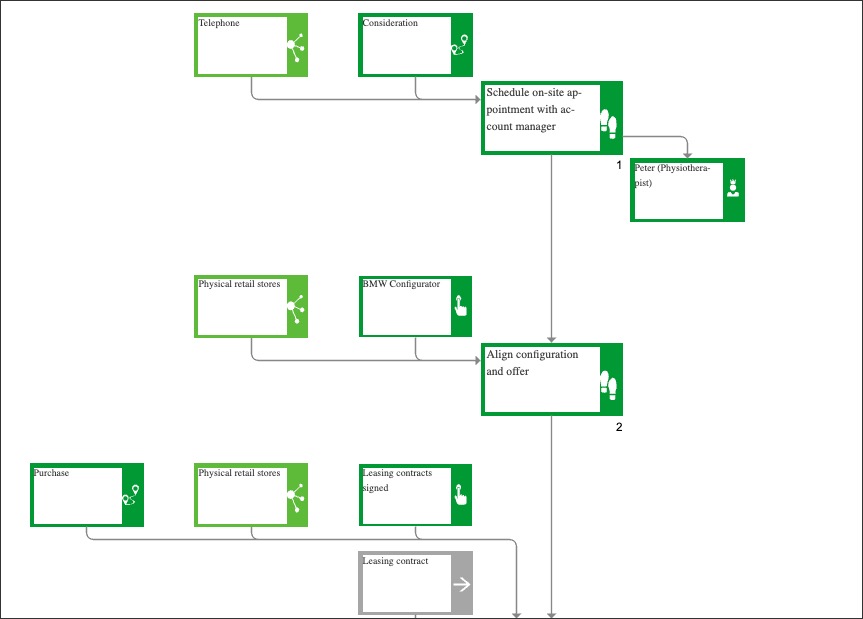
Customer journey maps are configured by building a process flow of customer experience objects. For example, the 'Search for a new car' customer journey map is created using sales channels, touchpoints, and customer journey stages:
These objects must be created within the Customer area of Process Designer, with the following object types available:
Touch points
Sales channels
Stakeholders
Customer journey stages
Personas
Voice of customers
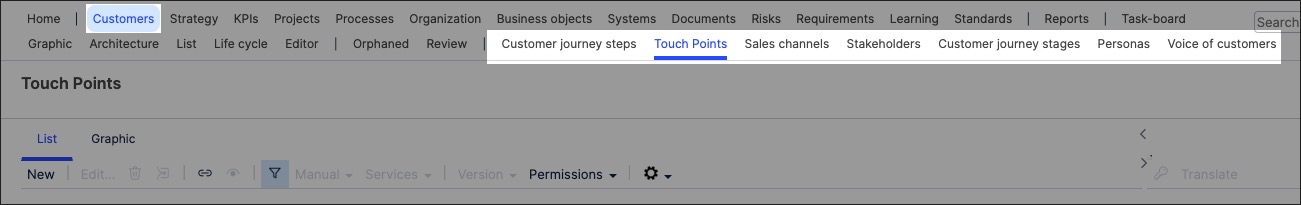
To create a customer experience object in Process Designer edit mode as an architect:
Click Customers and then select the object type you want to create.
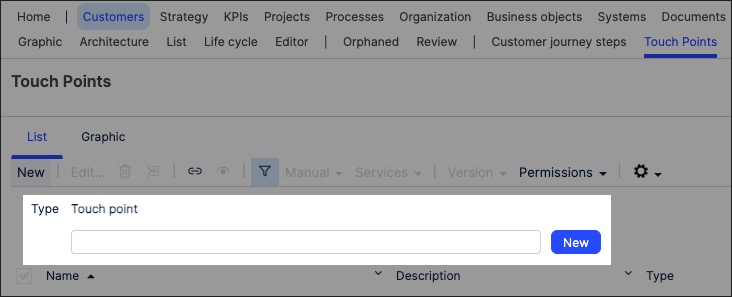
Click new, add the object name, and then click New.
In this example, we're creating a touch point:
The customer experience object is created and set to version 0.1 with the state 'In progress'.
With the object side panel open, configure the object attributes. For Touch points, this includes the description and the participants:
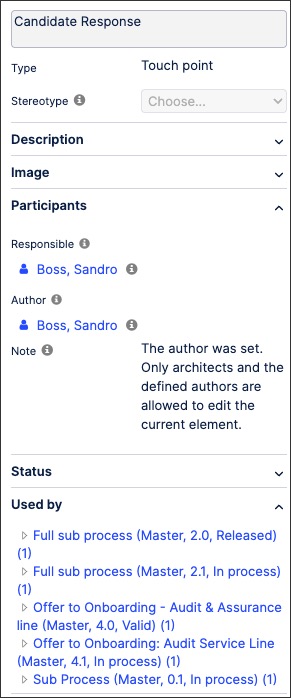
The customer experience object is now available and can be used when creating your customer journey maps.
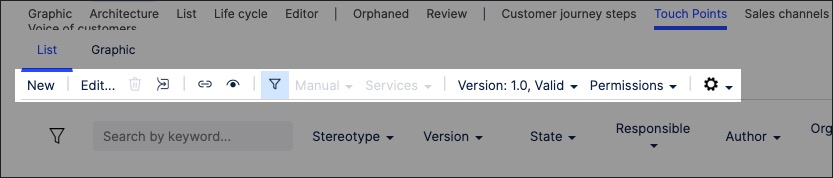
You can manage existing objects by returning to the Customers screen and either editing the object details or by using the toolbar:
Customer journey maps allow you to visually document the customer interactions involved in your process. In this example, a CJM has been created for a car buying process:
To create a customer journey map graphic in Process Designer editor mode as an architect:
Click Customers - Graphic.
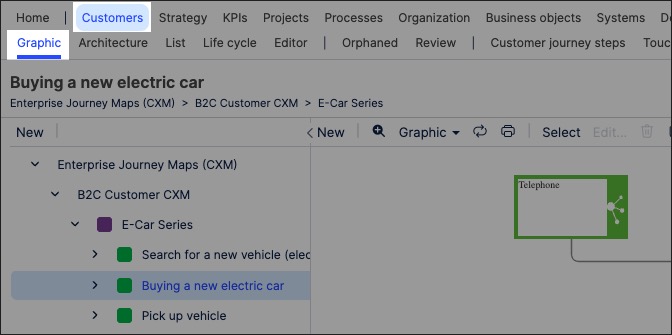
Select the object that you want to create the graphic for and then click Editor.
In this example, we're selecting the 'Buying a new electric car' graphic to edit:
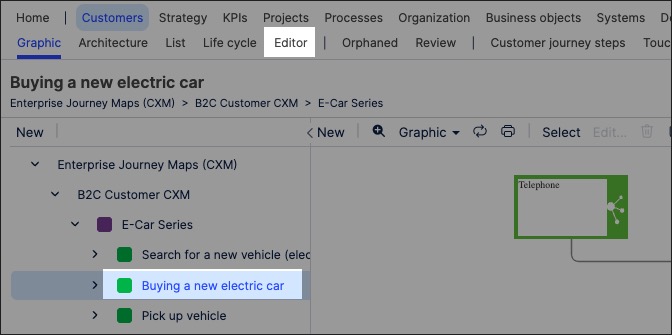
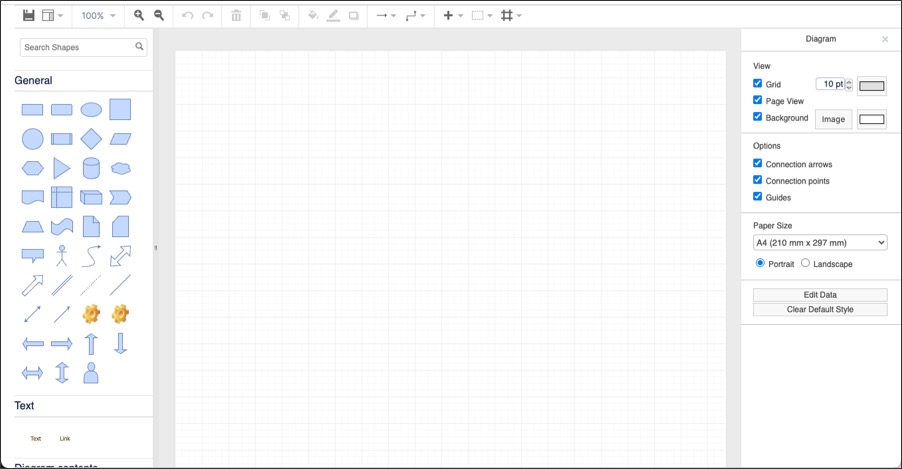
The editor loads and is pre-loaded with the customer experience objects previously created.
Use the drag and drop editor to create the graphic, utilizing the graphic editor features.
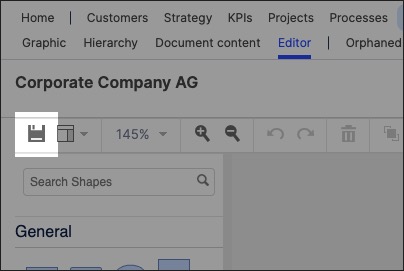
Click Save.
Graphic editor features
When creating graphics using the editor, you have the following features available:
Toolbar: This controls the following features:
Save: Save the current graphic, updating the graphic displayed in the Hierarchy area.
View: Display and hide the format panel, graphic outline, and layers panels.
Zoom / view controls: Controls the view of the editor.
Undo/redo: Effective for the last three changes.
Delete: Removes the existing graphic element.
Front / back layering: Moves the selected element forwards or backwards.
Fill / line / shadow: Configure the colors and shadow for the selected elements.
Connections / waypoints: Add connections between elements and choose the connection style.
Add link / image: Add external elements to the graphic, such as interactive links and uploaded images.
Flow: Automatically organize the selected elements based on how they should flow into each other (such as horizontally or vertically).
