Icon mapping
You can configure visual icons for your table and KPI cards and list View components, allowing you to create reusable icon mappings based on your data types. These icons can be mapped to entries in your Knowledge Model, offering your App users a consistent visual experience.
Icons can be mapped based on thresholds and categories:
Threshold mapping: Applying limit values (or "thresholds") to metrics, attributes, or data points in order to visualize whether those values fall within or outside certain ranges. See: Threshold icon mapping.
Categorical mapping: Assigning icons to specific categories, such as the status of an order, location type, or material type. See: Categorical icon mapping.
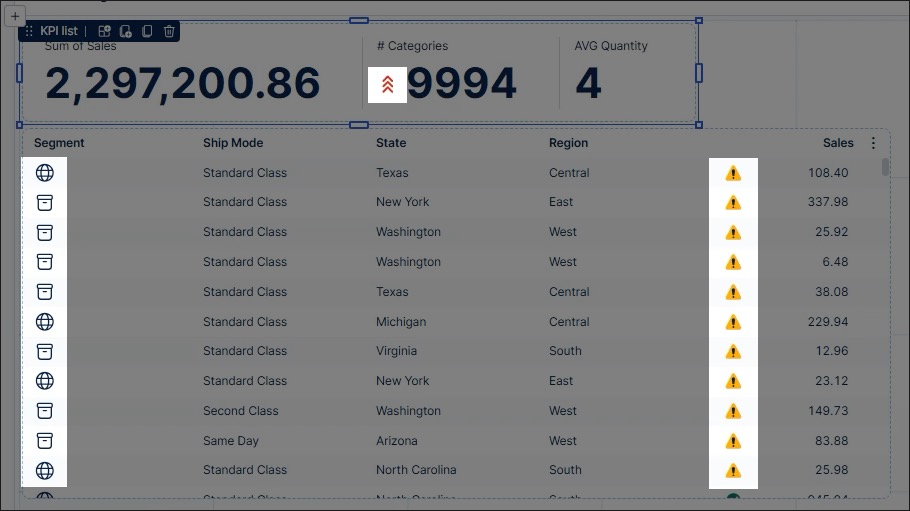
In this example, icons have been used for a KPI list (threshold mapping) and a table (both categorical and threshold mapping):
Supported icon mapping components
You can currently configure icon mappings for the following View components:
Icon mappings are configured in the Icons options for their supported components, available when clicking Configuration:
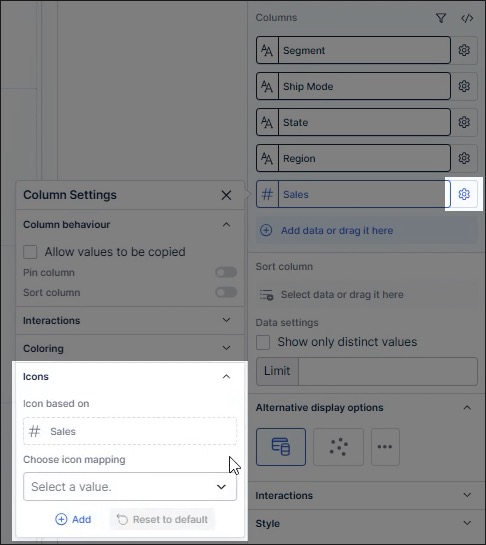
You can then configure threshold and categorical icon mapping.
Threshold icon mapping
Threshold icon mapping is when you apply limit values (or "thresholds") to metrics, attributes, or data points in order to visualize whether those values fall within or outside certain ranges.
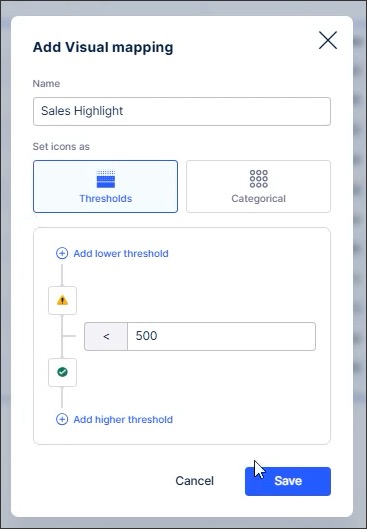
In this example, the table uses a threshold icon mapping to show an exclamation icon when a value is lower than 500 and a green checkmark when the value is greater than 500:
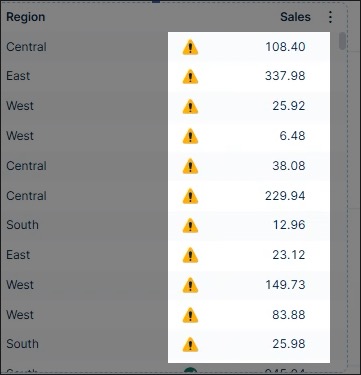
This threshold is configured by adding a threshold value of < 500 and selecting the two icons to use:
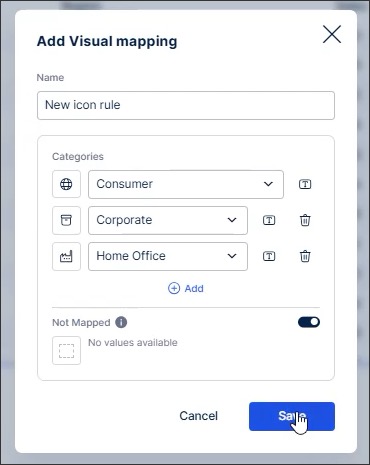
Categorical icon mapping
Categorical icon mapping is when you assign fixed icons to specific categories, such as the status of an order, location type, or material type.
In this example, the table uses categorical icon mapping to show the locations of sales orders:
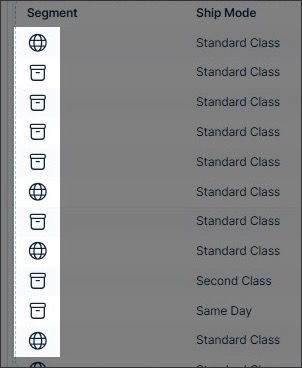
This is configured by assigning icons to each individual category: