Live Event Monitor
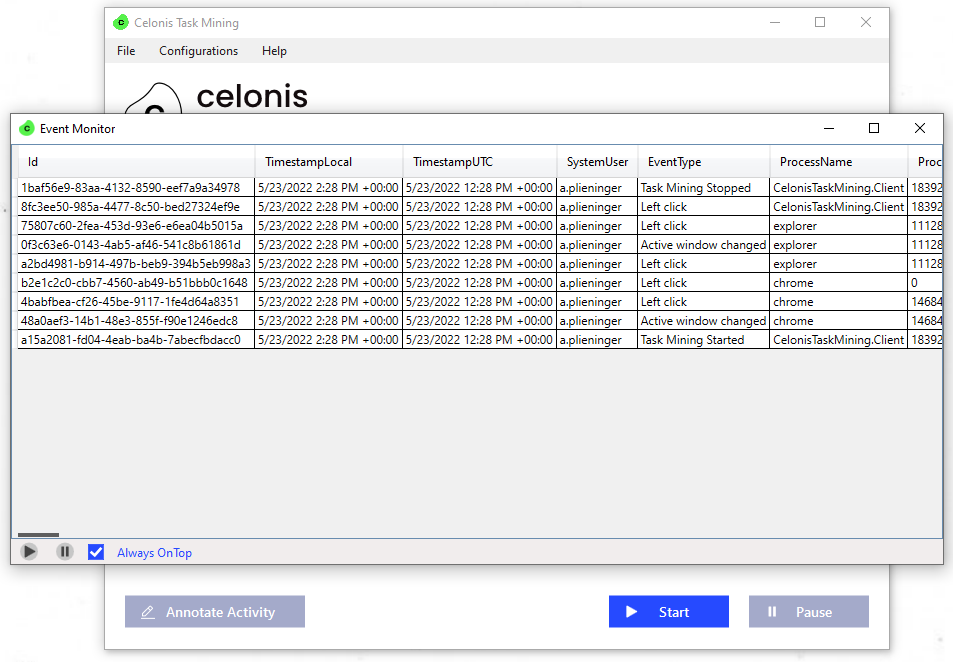
The Live Event Monitor shows in real-time which data is captured by the Task Mining Client as specified in the applied configuration, such as events, attributes, filtering, and hashing.
Analysts can use the Live Event Monitor to verify that the Task Mining Client captures the data as expected without needing to access the Celonis Platform and to quickly test out new Client settings.
In short, the Live Event Monitor:
Shows captured events in real-time on the desktop.
Includes all captured data fields.
Applies filter rules from configuration including hashing, which shows the data that is going to be sent to the Celonis Platform.
 |
Event Monitor Demo Video
When should I use it?
Important
Using the Live Event Monitor might lead to performance issues in the Task Mining Client and the applications a user is interacting with. This could cause lagging or hanging in the respective applications.
During the project setup to figure out which events and attributes to capture for each application.
For validation runs to check if the configured event processing rules work as expected.
For debugging and testing out new Client settings.
To quickly validate which attributes can be captured from custom applications. For example, to know if Task Mining can capture button names for an in-house developed Java application.
To enable and use the Live Event Monitor
By default, The Live Event Monitor is disabled for the Task Mining Client and must be enabled in the advanced Client settings using the Configuration Editor using these steps:
Download the current config file and open it with the Task Mining Configuration Editor on your desktop.
Go to the Logging section and enable “Show Live Event Monitor in Client”.
Save and upload the new configuration file to the Celonis Platform. Save the changes.
Wait for the new configuration to be applied, which may take up to five minutes, or restart the Task Mining Client to force a reload of the configuration.
Note
If you enable the Live Event Monitor in the Client, not only analysts but all users connected to the Task Mining project will have access to it. We advise to not use this in productive rollouts but only for testing or during the setup phase.
In the Task Mining Client, you can now access the Live Event Monitor by going to File > Show Live Event Monitor.
To see the captured data, click the Start button in the Client’s main window to start the event capturing. The captured events and attributes will now display in the Live Event Monitor.
You can also pause the display of captured events in the Live Event Monitor, such as to easier scroll and inspect elements.
Note
The Task Mining Client will still capture events and send them to the Celonis Platform while paused, However, these events will not display in the Live Event Monitor when the Pause button is toggled.
Use the Always OnTop checkbox to specify whether the Live Event Monitor will always be shown in the foreground even if you switch applications.