Viewing data job execution history
Whenever a data job begins to execute, a log is created and added to the Execution History dashboard. This dashboard shows both scheduled and manually executed data jobs within your data pool, allowing you to monitor and analyze your extractions, transformations, and data model load jobs.
This execution history dashboard displays the last three months of activity. If you would like to view a longer time period, we recommend setting up custom monitoring: Setting up custom monitoring.
Your scheduled and data job logs are then displayed.
To view your data job execution history:
Click Data Integration and navigate to the data pool containing the jobs you wish to monitor.
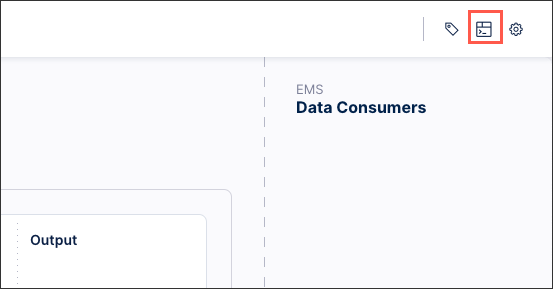
Access History: From the data pool diagram, click the Execution History icon.
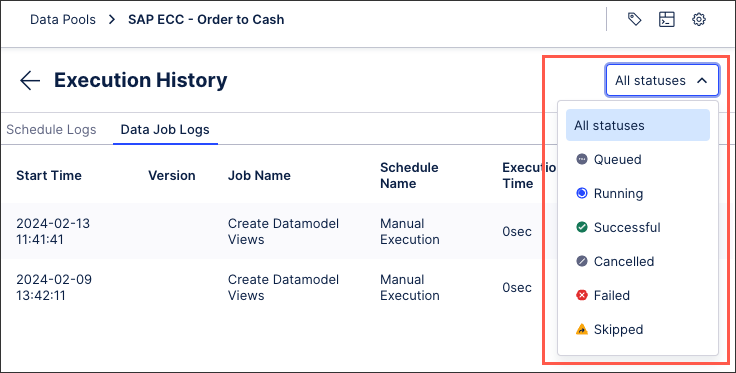
Filter results (optional): Use the dashboard to browse through the last three months of activity for extractions, transformations, and data model loads.
Inspect Individual Logs: Click into a specific data job log to view more granular details. See:Viewing individual data job logs
When viewing your data job execution history, the following execution status are available:
Queued: The execution is currently running, but it is on hold while other tasks are completed.
Running: The execution is currently running but has not finished.
Successful: The execution has finished running and all data job tasks were successfully completed.
Cancelled: The execution was cancelled while running, with all current progress lost.
Failed: At least one data job task failed during execution, however the execution has finished.
Skipped: The execution was skipped.
 |
UUID changes
The UUIDs for steps can change in the following cases:
Copying a Data Pool across teams (e.g., from Sandbox to Production)
If you are using the “Rename Target Table” option in the extraction configuration (as the step UUID consists of <taskID>_<ExtractionType/TableName>)
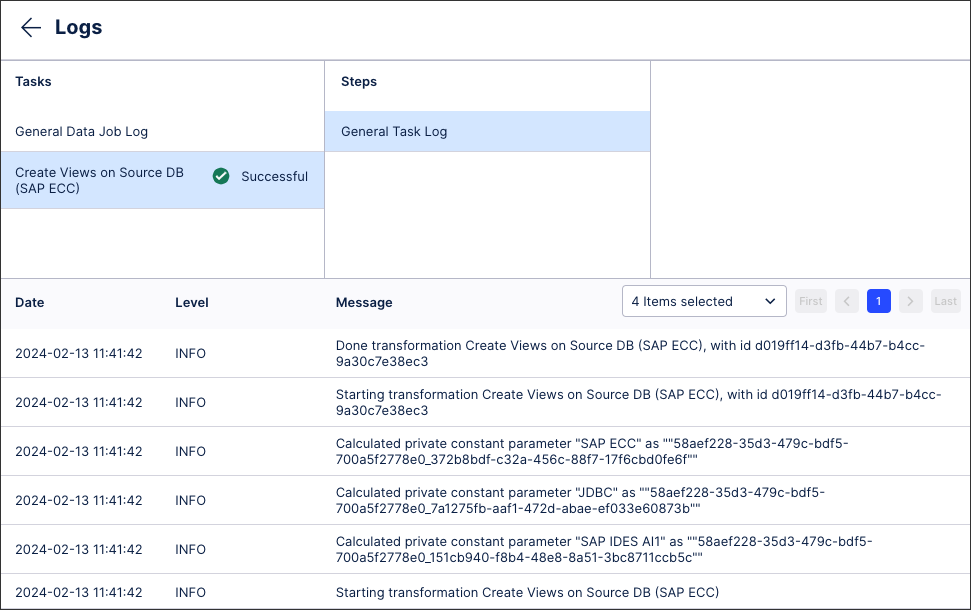
From the Execution History dashboard, you can click into individual data job logs to view further details. These details include:
Tasks: These are the extraction, transformation, and data model load tasks that have been executed at least once in this data pool. As such, they should correspond to those you see when you click Data Jobs from your data pool diagram.
Steps: These are the steps taken during the data job execution.
Log type: This includes the timestamp, level type (debug, error, info, and warning), and the detailed message.
 |