KPI Calculations
The KPIs in Process Explorer are calculated differently depending on if the panel or sliders are active in the component. The slider calculation method can be inaccurate and provide misleading information to users, so it is recommended that you standardize the calculation of KPIs for all object-centric process mining (OCPM) multi-object process explorers based on how KPIs are calculated within the Process Explorer panels.
Process Explorer calculates the value for the KPIs shown in the edges differently depending on if the sliders or the panel are active in the graph. If the Process Explorer has the sliders active, the KPIs in the edges will be calculated for the sequences in which a case flows exactly from the first to the second event in the edge. If the Process Explorer has the panel active, the KPIs in the edges will be calculated for a case that flows from the first to the second event in the edge, as well as any events that happen in between but are currently hidden from the graph. This means that the slider ignores the hidden events inside edges when calculating the value of the edge’s KPI.
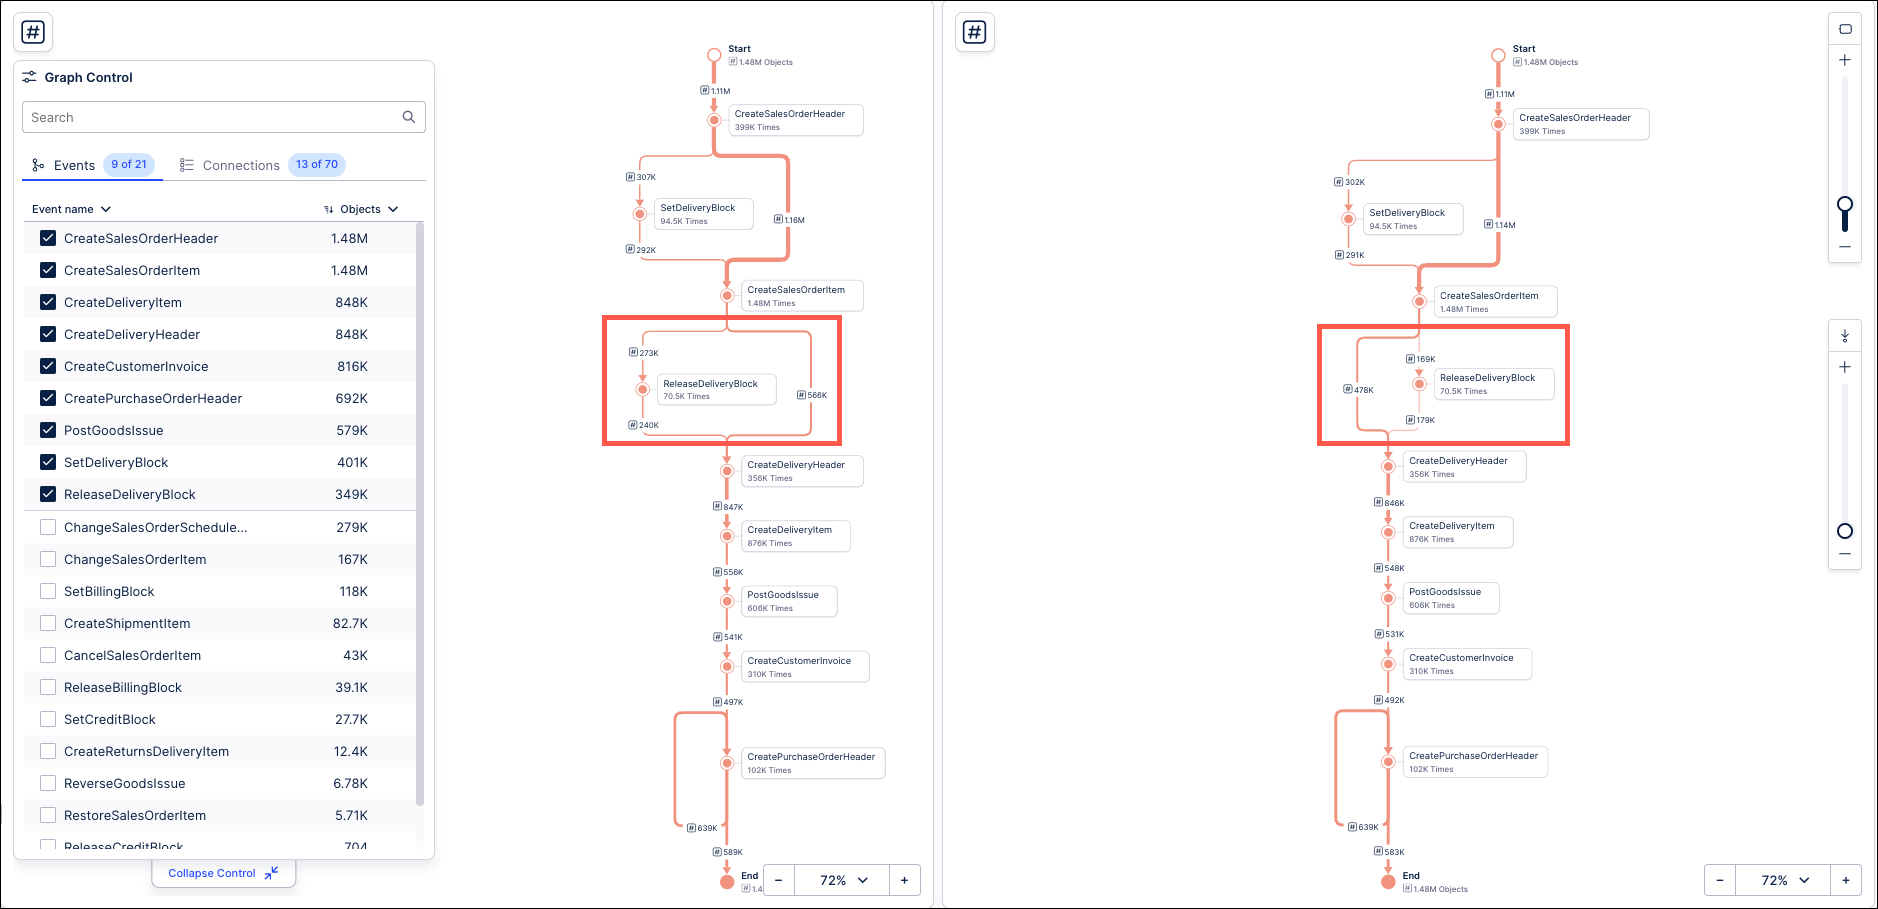
In the examples below, the two Process Explorer components show the path for the same process, one with the panel active (left) and the other with the sliders active (right). Now look at the KPIs in between their events in the edges:
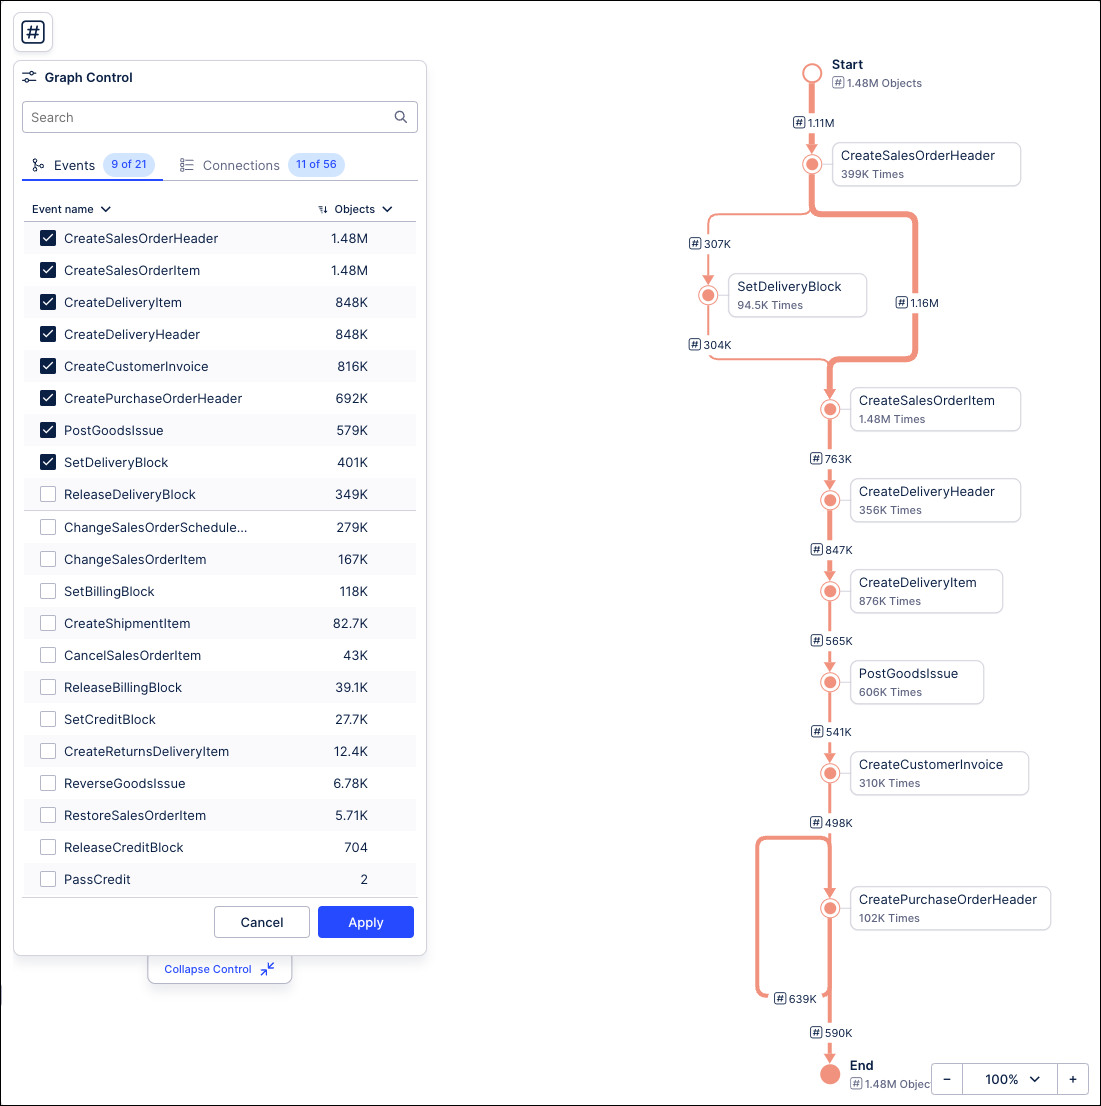
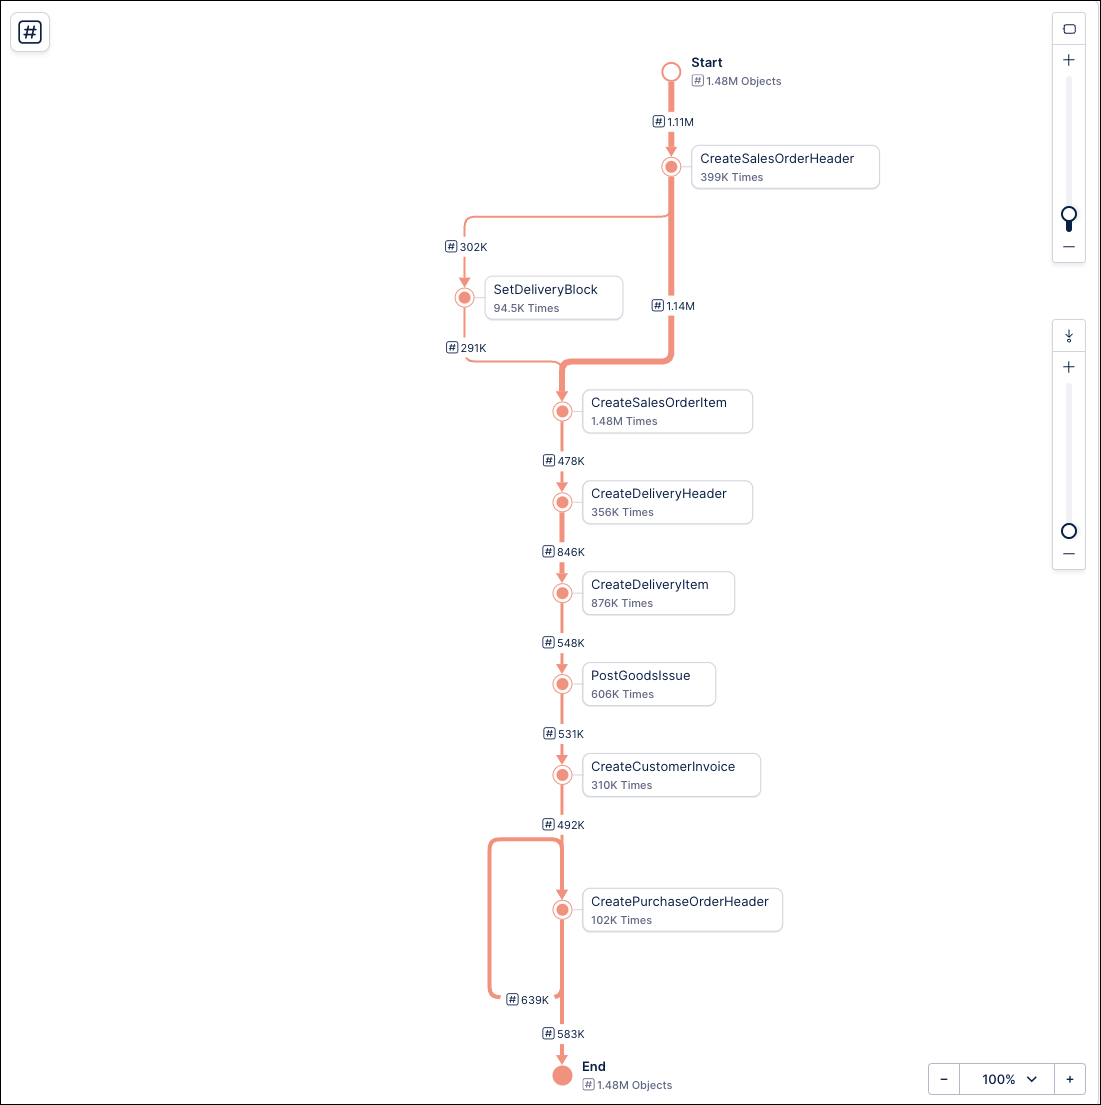
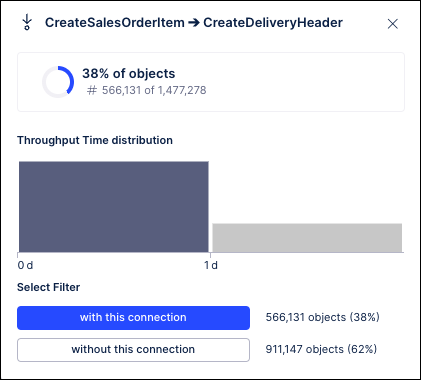
You can see that these KPIs show different values. To understand why this is happening, check the context menus for the KPIs between the edges. For example, on the context menu for the KPI between Create Sales Order Item and Create Delivery Header you would see:
Panel Process Explorer | Sliders Process Explorer |
|---|---|
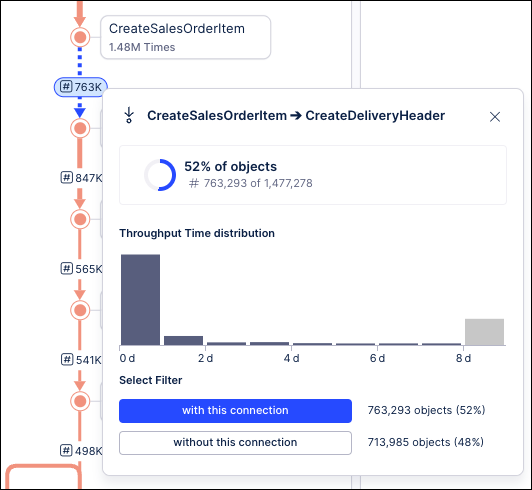 | 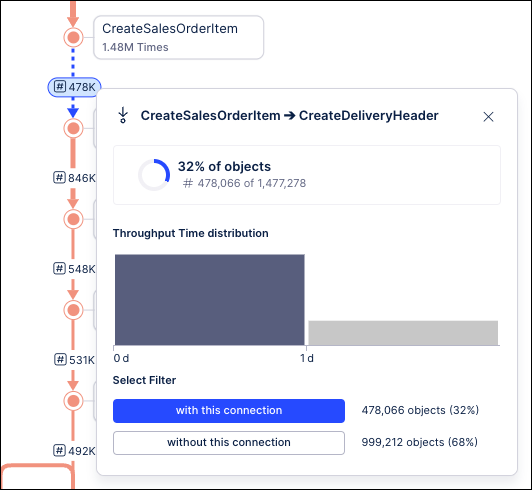 |
The calculation in the Process Explorer panel for the Create Sales Order Item to Create Delivery Header edge accounts for 52% of all cases (around 763K), while the calculation in the slider Process Explorer accounts for 32% of all cases (around 478K). This is because the Process Explorer slider calculates the KPI using the cases that flow through the two events in the edge, while the panel accounts for the hidden events within the edge. This is more obvious when we expand the graph to include the Remove Delivery Block event:
This creates a fork where cases can flow from the Create Sales Order Item event into either the Create Delivery Header event or the Remove Delivery Block event. Now look at the context menu for the KPIs in the edges between the Create Sales Order Item event and the events that follow for both the panel and slider Process Explorers:
Panel Process Explorer | Slider Process Explorer | ||
|---|---|---|---|
Create Sales Order Item → Create Delivery Header | Create Sales Order Item → Remove Delivery Block | Create Sales Order Item → Create Delivery Header | Create Sales Order Item → Remove Delivery Block |
 | 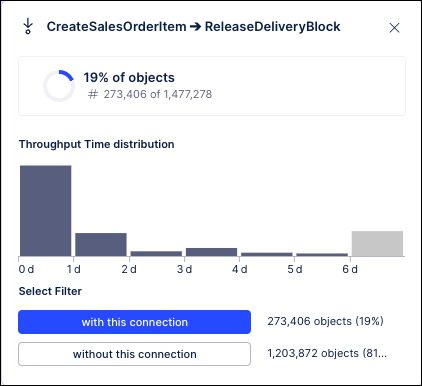 | 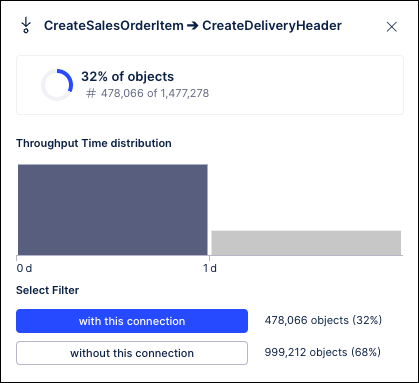 | 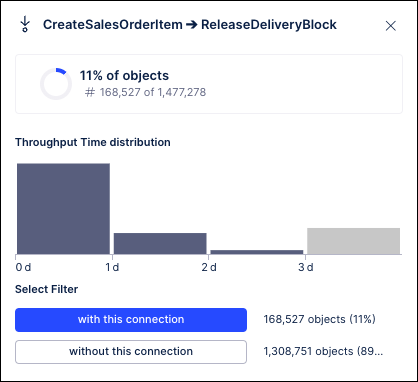 |
You can see how the panel Process Explorer splits the 52% of objects that flow through Create Sales Order Item event into the ones that flow into the Create Delivery Header activity (38% / 566K cases) and ones that flow into the Remove Delivery Block event (19% / 273K cases). You can also see how their KPI values are calculated accordingly, with the values for the Create Sales Order Item to Create Delivery Header edge in the panel Process Explorer changing completely. On the other hand, with sliders, notice how the calculations for the Create Sales Order Item to Create Delivery Header edge is unchanged from what you saw before (32% of cases, around 478K cases). The slider Process Explorer simply added the Remove Delivery Block event and calculated the KPI for the percentage of cases (11% / 168K cases) that flow exactly between Create Sales Order Item and Remove Delivery Block. Similarly, if you add these case amounts, you would also see that they do not add up to the total 1.48M cases that flow through the Create Sales Order Item event.
This illustrates that although the Process Explorer can portray the same events for the same process, it will calculate the KPIs in the edges differently depending on which tool is active.