January 2025 Release Notes
MACHINE LEARNING PyCelonis Data deduplication end of life (2025-01-31)
The data_deduplication module in PyCelonis 1.x has reached end of life today and will no longer receive support through Celonis.
Please reach out to your account representative if you are using this module.
For more information about PyCelonis, see: PyCelonis - Python API wrapper.
STUDIO Scatter plot chart type now available (2025-01-31)
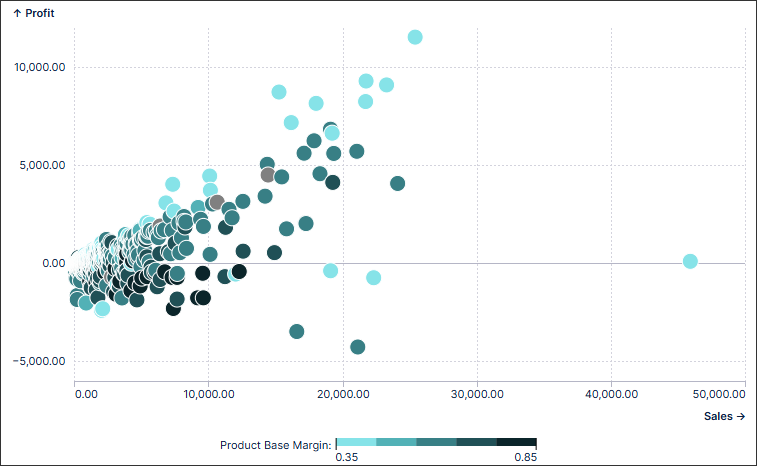
You can now add and configure scatter plot charts for your Studio Views. Scatter plot charts (also known as bubble charts) are a great way to display a lot of related data in one chart. In scatter plot charts, the x-axis displays one numeric field and the y-axis displays another, making it easy to see the relationship between the two values for all the items in the chart. In a bubble chart, a third numeric field controls the size of the data points.
In this example, a scatter plot chart is used to map profit against sales:
 |
To learn more about the different chart types you can configure for your Studio Views, see: Available chart types.
And to understand how to create and configure these charts, head to: Charts.
STUDIO Configuring a search component for your View (2025-01-31)
You can now configure a free text search component for your Studio View, allowing your App users to search across all components within that View. Search components can be customized to focus results on selected search parameters, to allow wildcards to be used, and to guide users with placeholder text.
Search components are best combined with a table component, such as in the following example. This search component has been configured to allow users to search the table based on country, city, customer name, and US state parameters:
 |
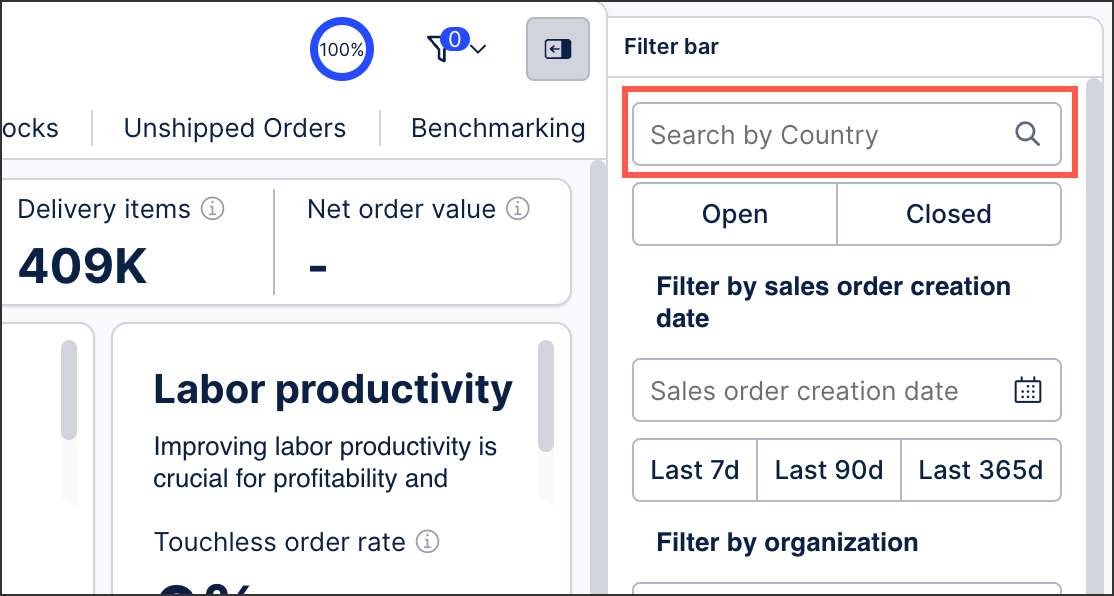
You can also use search components as part of a filter bar, for example adding a 'Search by Country' search box to this filter bar for a Starter Kit:
 |
For more information about this component, see: Search component.
And to learn more about configuring filter bars, see: Configuring a filter bar for your View.
STUDIO View editing improvements (2025-01-29)
We've also made a number of improvements to your View editing experience in Studio, including:
Enhanced drag and drop and resizing experience of View components.
Improved initial loading times of your Views.
Optimized performance of View components such as charts, KPIs, and tables.
Faster execution of PQL queries.
To learn more about creating and editing Studio Views, see: Views.
STUDIO Tabs in Studio Views have distinct URLs (2025-01-29)
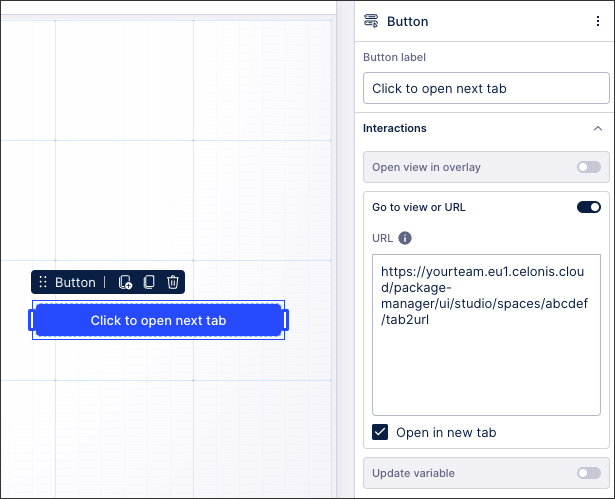
With the new Studio experience, you can create and edit tabs within your Views. Published Views with tabs now have distinct URLs per tab, enabling you to directly link to them where needed.
In this example, the button component has been configured in tab 1 that links directly to tab 2. The user is then directed to the next tab when clicking the button:
 |
For more information about creating tabs in your Studio Views, see: Views.
PI GRAPH Import multiple object types and their relationships from a data source (2025-01-28)
You can now import multiple tables from your source system to create object types, and also use the metadata for the tables to identify and create object to object relationships between them. If your source system database already has an object-centric structure, it's a quick way to get started with custom modeling for your object-centric data model.
When you create object types using the Import from table option, you can select more than one table from a connected data source to import at the same time. Each table becomes one object type, with columns from the table becoming attributes of the object type. You can edit the new object types and add attributes in their previews in the same way as you can when you import a single table. We’ve also added an option for you to pick a column to be used as the object type’s ID. You can only import tables from one connected data source at a time, and you can only create one object type from each table at a time. But you can go through the import flow as many times as you want, to import other data sources or create different object types.
After setting up the object types, you can view the foreign keys that connect the source system tables to each other, and choose which ones to use as one to many (1:m) object to object relationships between your new object types. In this step, you can also add custom one to many relationships between tables you're importing. If you need any many to many (m:n) object to object relationships, you'll need to create these after the import.
When you've finished, we'll show a summary for you to check the object types and object to object relationships you'll be creating, and go back and make any edits you need to. Then we'll create them all, along with the SQL transformation scripts to populate the attributes and relationship columns for the object types with the data from your source system tables. You'll need to check the scripts, ensure the object IDs are unique, and populate any extra attributes that use data from somewhere other than your original source system table.
PI GRAPH Save unfinished transformation (2025-01-24)
You can now save SQL transformations that you've started creating for object types, event types, and their relationships, but haven't finished yet. Previously, a transformation had to pass SQL query validation before you could save it. Now, you can choose to save and validate your transformation like before, or you can choose to just save your unfinished transformation without validating the query. If you save and validate but the query doesn't pass validation, you can choose to save the transformation anyway, and go back later to fix the errors. We automatically disable transformations that haven't been validated and transformations that have failed validation, so they won't run.
To help you identify transformations that you need to finish or fix, we've added two columns in the list of transformations:
Validation shows whether the transformation has passed validation, failed validation, or hasn't been validated at all yet.
Last run shows whether the transformation has been run yet, and if so, whether the run succeeded or failed. There's a link to the logs for the last run so you can check what the errors were.
PI GRAPH Use multiple data sources in your custom transformations (2025-01-24)
We've made the data connection parameters from the data pool where you're working with objects and events, available in the SQL editor for your transformations for objects and events. You can use them to access multiple source systems from the same transformation, in addition to the main data source that you're working with.
Use the Data connections tab in the Parameters panel to view and add the available data connection parameters in your statements. You can put them in custom transformations, and also in full and partial overwrites that you create for Celonis transformations. Wherever you don't use a data connection parameter in an SQL query, we'll run the query on the default data source that you've selected in the Data sources panel for the transformation, like before. Wherever you add a data connection parameter, we'll run the query on the data in that schema.
STUDIO Chart readability improvements (2025-01-24)
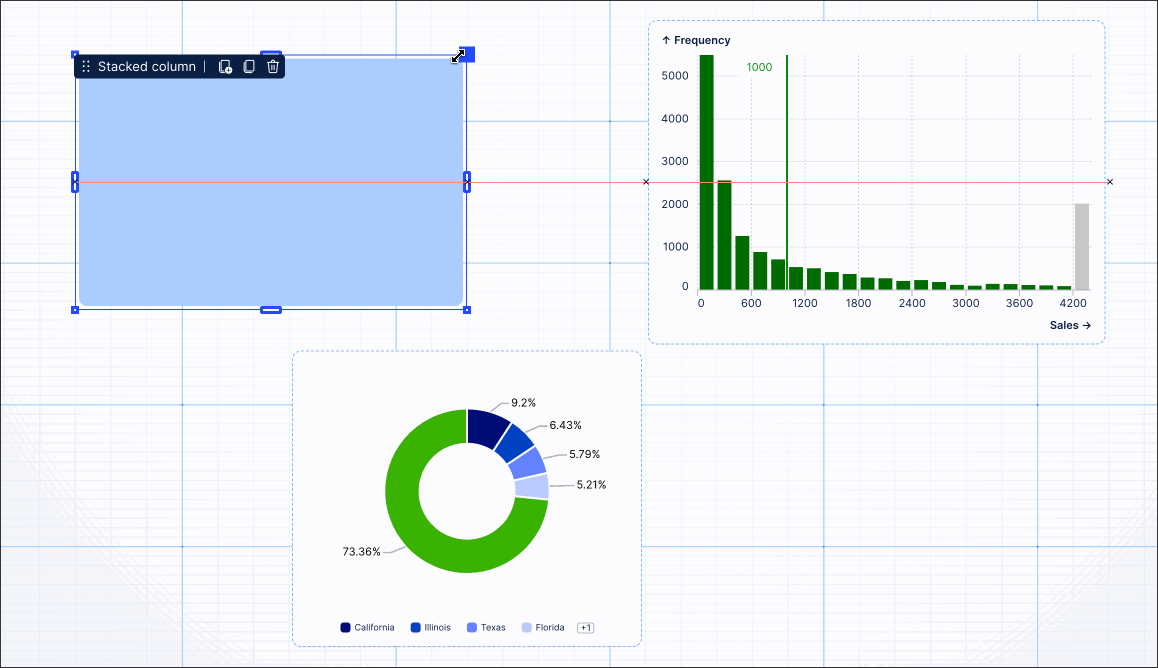
We've made a number of readability improvements to Studio charts, giving your app users a better view of the data displayed. These chart improvements include:
Responsive charts: Charts are now more adaptable to size adjustments. As you resize your charts, certain elements will automatically hide to prioritize the clarity of the visualization.
Enhanced legend display: We've made several improvements to the legend, including a new collapsed state to eliminate scrollbars. The color scale legend has been refined for better alignment with other legend types
Pie chart labeling: We've improved the labeling on the Pie charts for a clearer and more polished look.
These chart improvements are automatically applied to your existing content, meaning that no configuration changes are needed.
For more information about creating and configuring Studio charts, see: Charts.
 |
PI GRAPH Version 2.0.0 of the Celonis catalog is now available (2025-01-23)
In this release of the Celonis catalog, we’ve made a number of updates to enhance performance, functionality, and usability across the Celonis Platform. Because it’s a major version change, some of the changes are not backwards compatible, and might require updates to your Marketplace applications and Studio assets.
If you’ve enabled automatic updating for the Celonis catalog, we’ll apply the changes automatically in your development environment. If you haven’t, you’ll see an update message on the Objects and Events dashboard next to the current catalog version, and an Update button on the Catalog page (select View catalog on the Objects and Events dashboard to get there). In either case, use the link on the Catalog page to view the release notes for the Celonis catalog. Read them to find out what’s changed, and what you’ll therefore need to validate after the update. Your production environment won’t change until you publish the changes from the update. For the instructions to update the Celonis catalog and validate your object-centric data model afterwards, see Core process catalog.
The update includes new object types, event types, attributes, and relationships, and a new perspective for advanced Accounts Payable use cases, and deletes two relationships, as well as including a number of behavior enhancements. Here are some significant changes in the update that you’ll notice when you’re validating the relevant processes:
In the Procurement and Accounts Payable processes, two object to object relationships have been deleted (VendorAccountDebitItem to VendorAccountCreditItem, and CustomerAccountDebitItem to CustomerAccountCreditItem), so any overwrites that you created for those will also be deleted. It’s better value to use the relationship CustomerAccountClearingAssignment to VendorAccountClearingAssignment instead. However, if you want to keep using either of the deleted relationships, you can create an identical custom relationship manually, including any overwrites that you made to it. You can do this before you update the Celonis catalog, or copy it from your production environment before you publish the changes from the update.
In the Accounts Payable process, the instance counts for VendorInvoice, VendorInvoiceItem, and VendorInvoiceCancellationItem objects will reduce due to the addition of the VendorCreditMemo and VendorCreditMemoItem objects. If you aren't using the new objects in your model, you can remove the new filters from the existing objects to return them to the same function.
The perspective for the Inventory Management process has been updated. If you want to revert to the previous version, that version is still in the Celonis catalog, named perspective_celonis_InventoryManagementLegacy.
STUDIO Limited Availability: Adding logos to Views (2025-01-23)
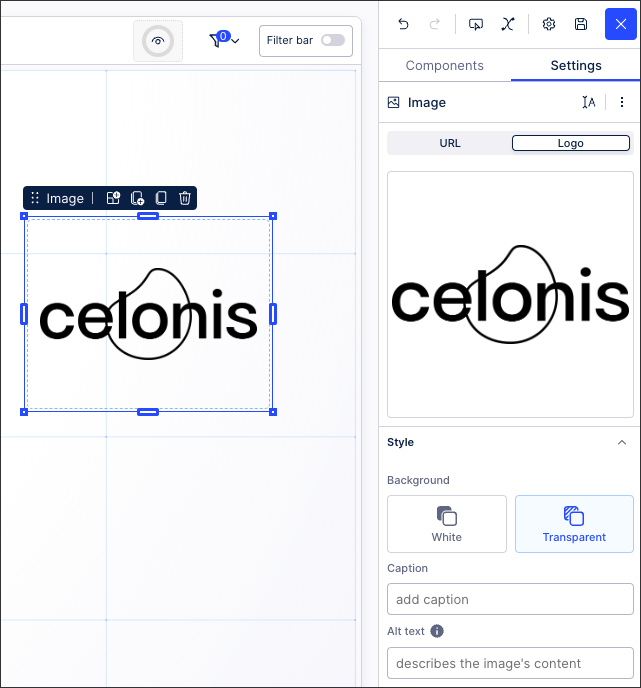
You can now add logos and images to your Studio Views using the Image component, enabling you to add branding and visual enhancements to your content. You can also customize your image style by choosing options including the fit, background, alignment, labels, and alt text.
The Image component automatically displays your Celonis Platform team logo where one is available. This logo is managed in the Admin & Settings area, requiring administration permissions for your Celonis Platform team.
In this example, we've added the Celonis logo to our View:
 |
To learn more about adding logos and images to your View, see: Logos and Images.
STUDIO Starring packages replaces pinning (2025-01-23)
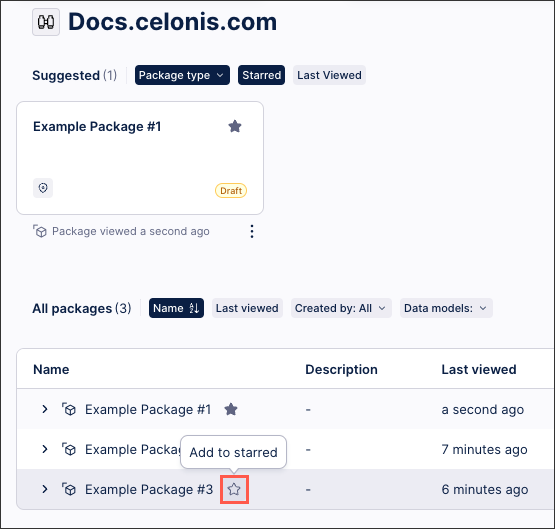
You can now star and unstar your Studio packages, giving you a more efficient way to organize and access your content. Starred packages now appear in your Suggested Studio content, which includes your recently opened packages, and you can click Starred to filter to just your starred packages.
This feature replaces the 'pinning' feature, with all previously pinned content automatically converted to starred content.
For more information about managing your Studio packages, head to Managing packages and permissions.
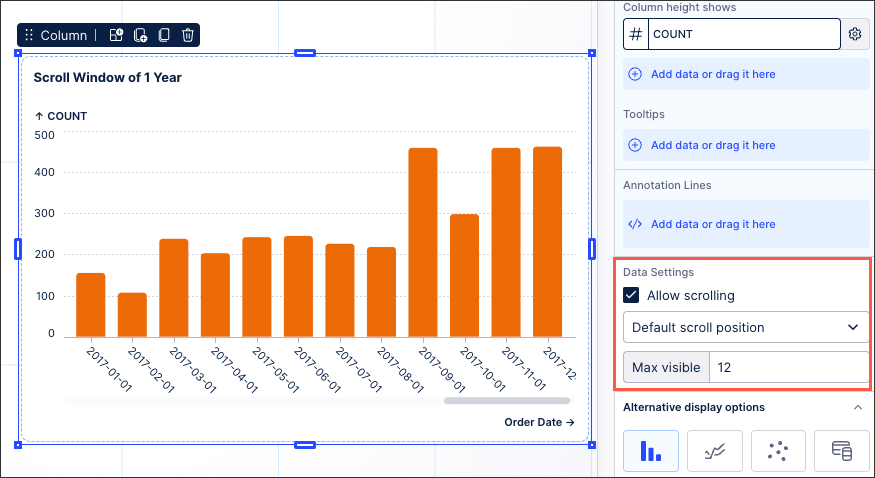
STUDIO Custom scrolling window added for chart component (2025-01-22)
For Studio charts where the number of entries exceeds the initial chart view, you can now allow scrolling through the entries.
When allowing scrolling, you can configure where the scrolling start position is for the user by selecting between the following scrolling options:
Default scroll position
Scroll from top
Scroll from bottom
Custom scroll position
You can also set the 'Max visible' number of chart entries, limiting the number of entries displayed in your chart.
 |
For more information about configuring your Studio charts, see: Charts.
STUDIO Chart component enhancements (2025-01-20)
You now have more customization options when you're configuring your charts in Studio, including the following enhancements:
Build on top of existing charts - You can now stack additional marks—like lines, points, or bars—on top of the charts we currently offer. This means you can combine multiple visual elements to better compare data or highlight trends, all within the same chart.
Modify existing marks - We’ve made it simple to adjust the marks in your charts. For example, you can switch from bars to lines, add points, or make other changes to refine the way your data is presented.
Consolidated mark settings in the context menu - All mark settings are now located in the context menu for each data field. This puts everything in one place, making it easier to find and adjust settings without navigating through multiple menus.
When configuring your charts, you can now also use the following chart settings:
Set axis placement: Easily move marks between the main and secondary axes to improve readability and comparisons.
Adjust stacking and grouping: Quickly toggle between stacked and grouped variations for bar and area charts to align with your data’s story.
Fine-tune appearance: Control mark size, line display, point type, and other design settings to customize your visuals exactly how you want them.
For more information about creating and configuring your charts, see: Charts.
And for a video overview of these enhancements:
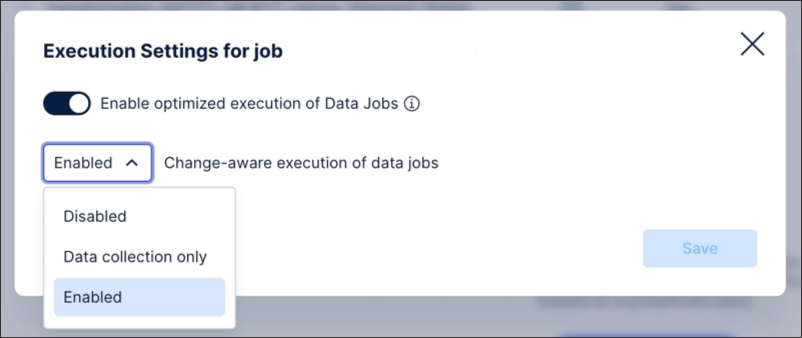
DATA INTEGRATION Change-aware data job executions (2025-01-20)
You can now enable change-aware executions of your data jobs via the execution settings menu. This setting automatically checks your data jobs and only runs transformations when there are underlying changes to the data, such as new data being extracted, or when there are changes to the data job configuration. If neither conditions are met, then the transformation is skipped and there are no updates to the data model.
You can enable change-aware executions for both object-centric and case-centric data jobs, as well as for any data jobs included in scheduled executions.
For more information about optimizing the execution of your data jobs, see: Optimizing the execution of data jobs.
 |
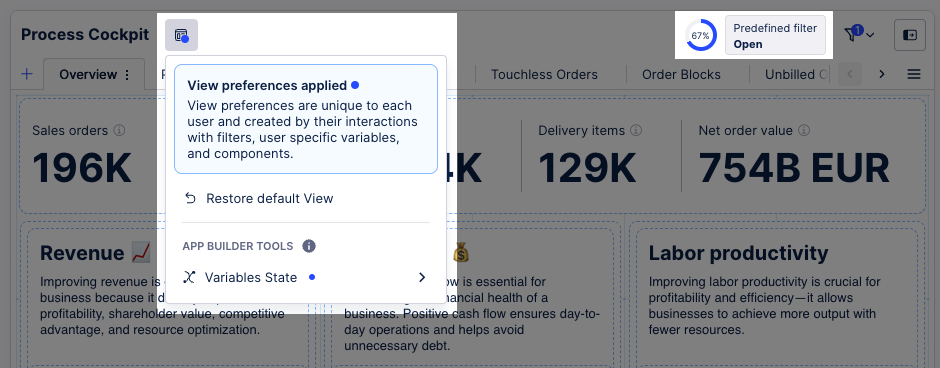
STUDIO Limited Availability: View preferences and component settings kept when re-entering View edit mode (2025-01-17)
When previewing your Studio Views using the interactive mode, any View preferences you configure are now kept when you re-enter View edit mode. View preferences are unique to each user and created by their interactions with filters, user specific variables, and components.
View preferences include, but aren't limited to, the following:
Filters
Variables
Component states (such as column sizes and sorting in tables and selecting KPI list cards)
When editing a Studio View, you can see when View preferences are applied by clicking the View preference icon:
 |
You can then click Restore default View to remove these preferences again.
For more information about creating and editing Studio Views, head to Views.
And to learn more about restoring to your default View, see Restore default View.
DATA INTEGRATION Improvement in VARCHAR column size optimization(2025-01-17)
We've improved the algorithm that's used to automatically adapt the column sizes for columns with the VARCHAR datatype. This improvement further accelerates your ETL data pipeline, including performance enhancements when extracting, transforming, and loading your Data Models.
This feature is available for all data extractions, including SAP, cloud databases, JDBC connections, and the Replication Cockpit.
For more information, see: Updating JDBC extractors
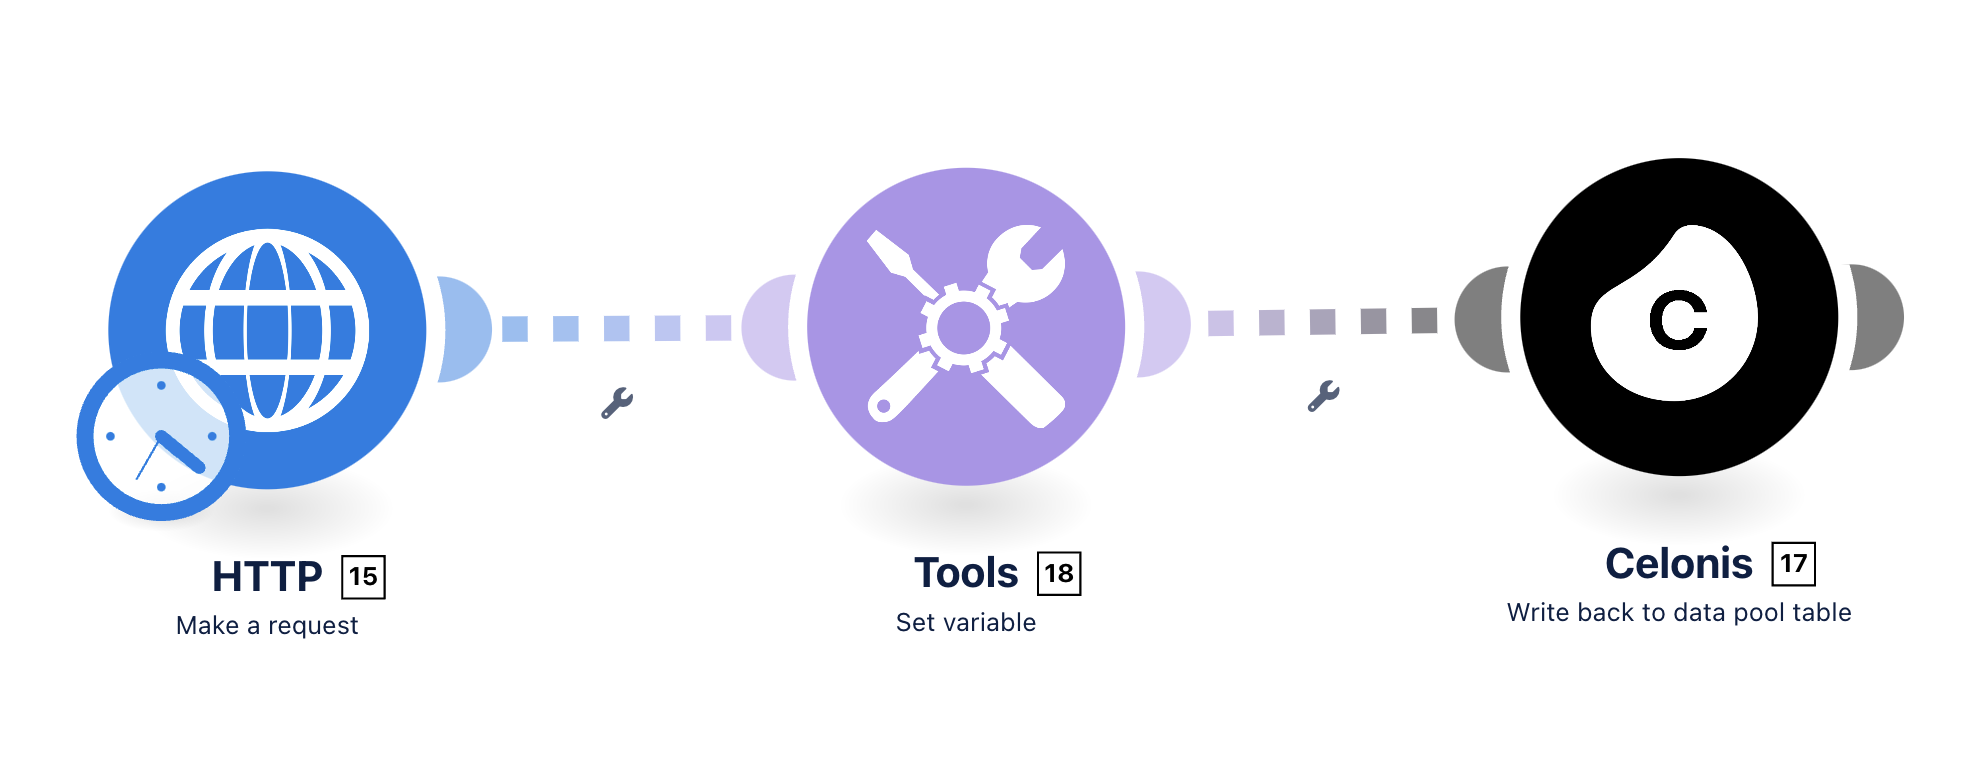
AUTOMATION New Write back to Data Pool table module (2025-01-16)
Limited availability
This functionality is currently in limited availability as it relies on data ingestion API. If you’re interested in trying it out, get in touch with us at Celopeers to enable data ingestion API.
The new Write Back to Data Pool Table Action Flow module simplifies data integration and enables you to seamlessly transfer large volumes of data back to your Celonis Data Pool with minimal configuration. This allows you to leverage real-time insights from your data tables and Process Intelligence Graph to drive intelligent actions. By eliminating the need for complex workarounds, this module streamlines your workflows and improves efficiency, allowing you to focus on making data-driven decisions that drive real business impact.
 |
For more information on how to set up this module, see Write back to Data Pool table.
STUDIO Limited Availability: Embedding iframes in Views (2025-01-16)
You can now embed iframes into your Studio Views, allowing you to display both static and dynamic external content within your applications.
Static content: An iframe where the URL displayed doesn't change, for example Celonis.com. Static content is the same for all users.
Dynamic content: An frames where a placeholder variable is used to determine the URL, often triggered by user inputs (such as entering a value or selecting from a list). This placeholder variable can be combined with other View components, including input boxes, input lists, and input dropdowns so users can dynamically view the iframe content relevant to them.
In this dynamic content example, an input dropdown has been configured so the user can select different Celonis.com product pages to display in the frame.
 |
To learn more about embedding iframes to your Studio Views, see: iframes
STUDIO Configuring a condition list in Studio Views (2025-01-16)
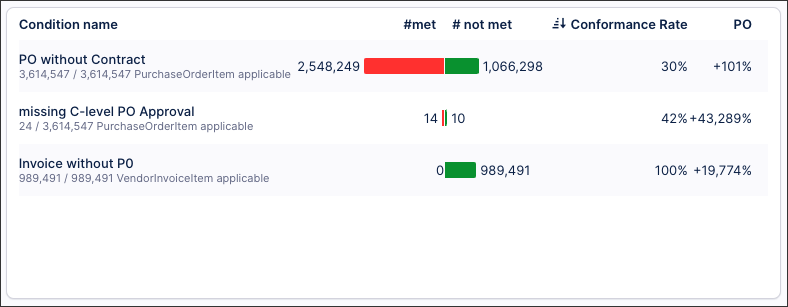
You can now configure a condition list in your Studio Views. The condition list component allows you to view and monitor conditional attributes from your Knowledge Model (such as 'Material in Stock' and 'PO approval adherence'). With increased visibility of these conditional attributes, you can better understand how any violations impact your business KPIs.
In the following example, the condition list component is used to track Purchase Order payment conformance:
 |
If you previously used the Execution Gap List component in our legacy Views, the condition list component can now be used for the same use cases.
In addition to fulfilling these use cases, the condition list component offers a number of key features and enhancements:
Monitoring of conditional attributes: Quickly view and track business rule conditions.
Built-In conformance analysis: Automatically calculate conformance rates and non-conformance impacts on KPIs.
Reusable conditions: Utilize boolean calculated attributes in the Knowledge Model for conditions.
Configurable outputs: Using the condition list component, you can configure the following outputs:
Counts: Total cases, conforming cases (1), and non-conforming cases (0).
Conformance rate: The percentage of cases meeting criteria over applicable cases.
Optional KPI Impact: Highlight how non-conforming cases (0) affect key KPIs.
For more information, head to: Condition list
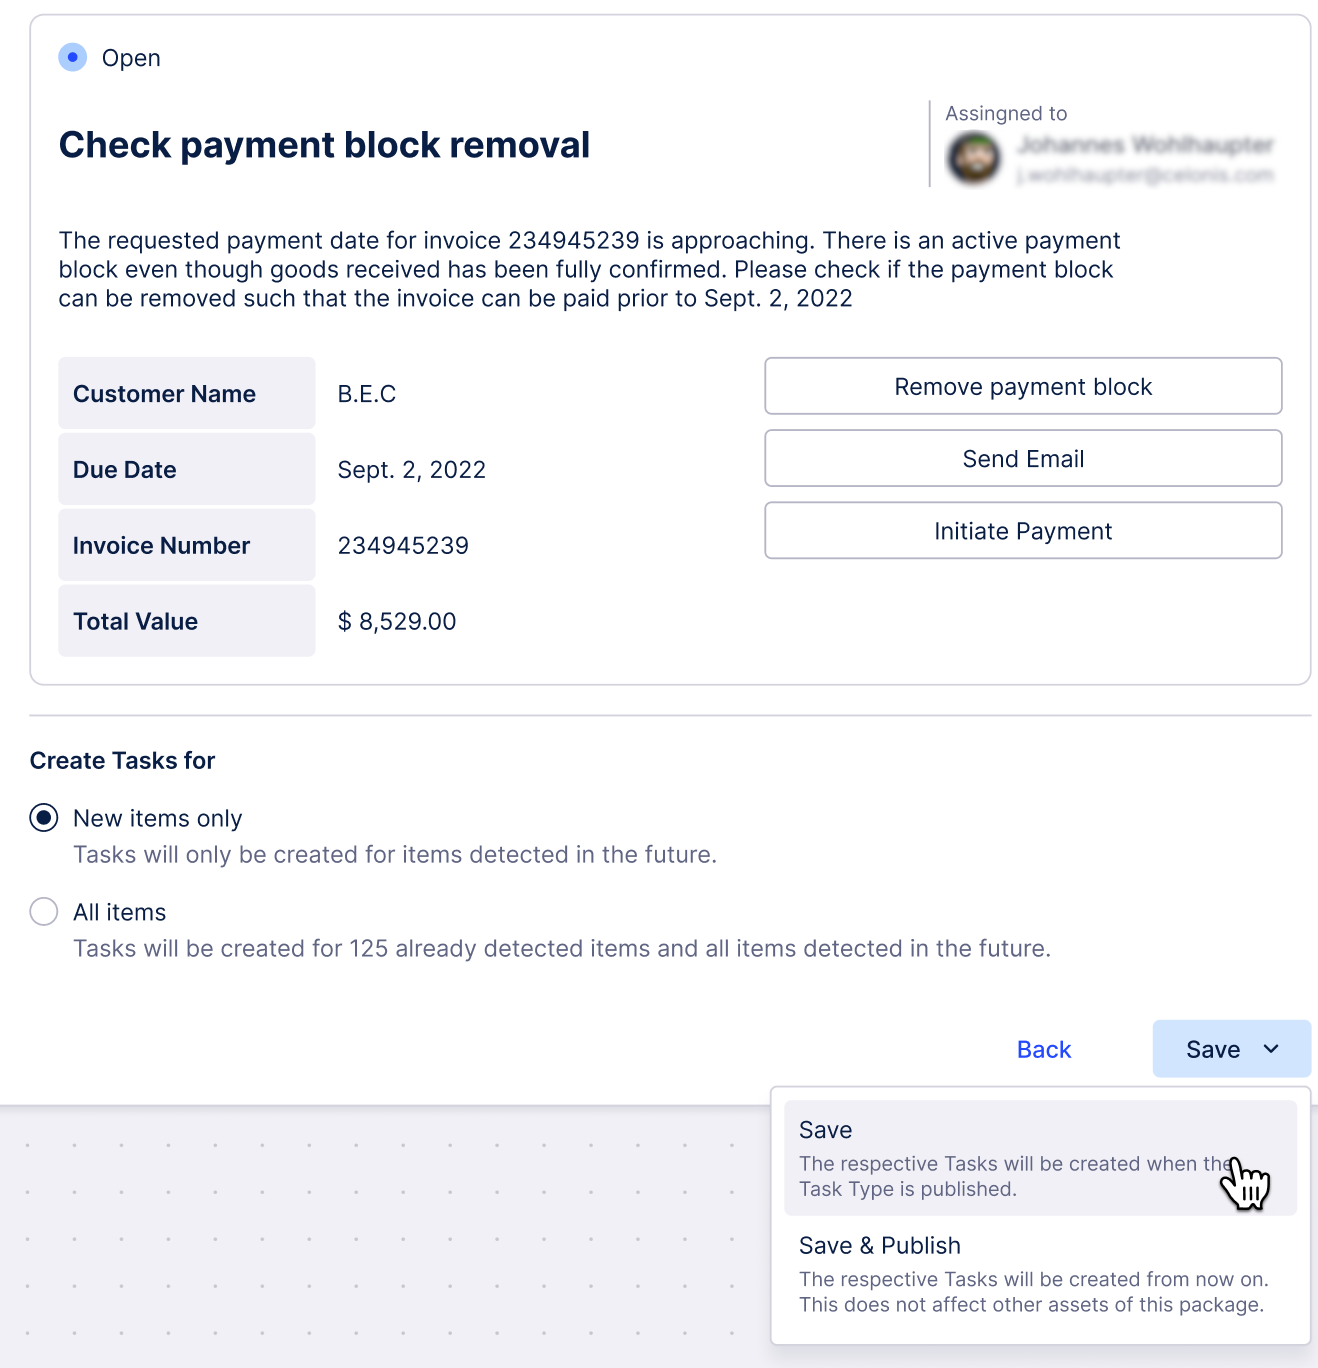
AUTOMATION Improved Tasks creation (2025-01-16)
Creating Tasks is smooth sailing. With a tighter and more user-friendly interface, it will take you even fewer clicks to create and start using new Tasks.
 |
For more information, see Creating Task Types.
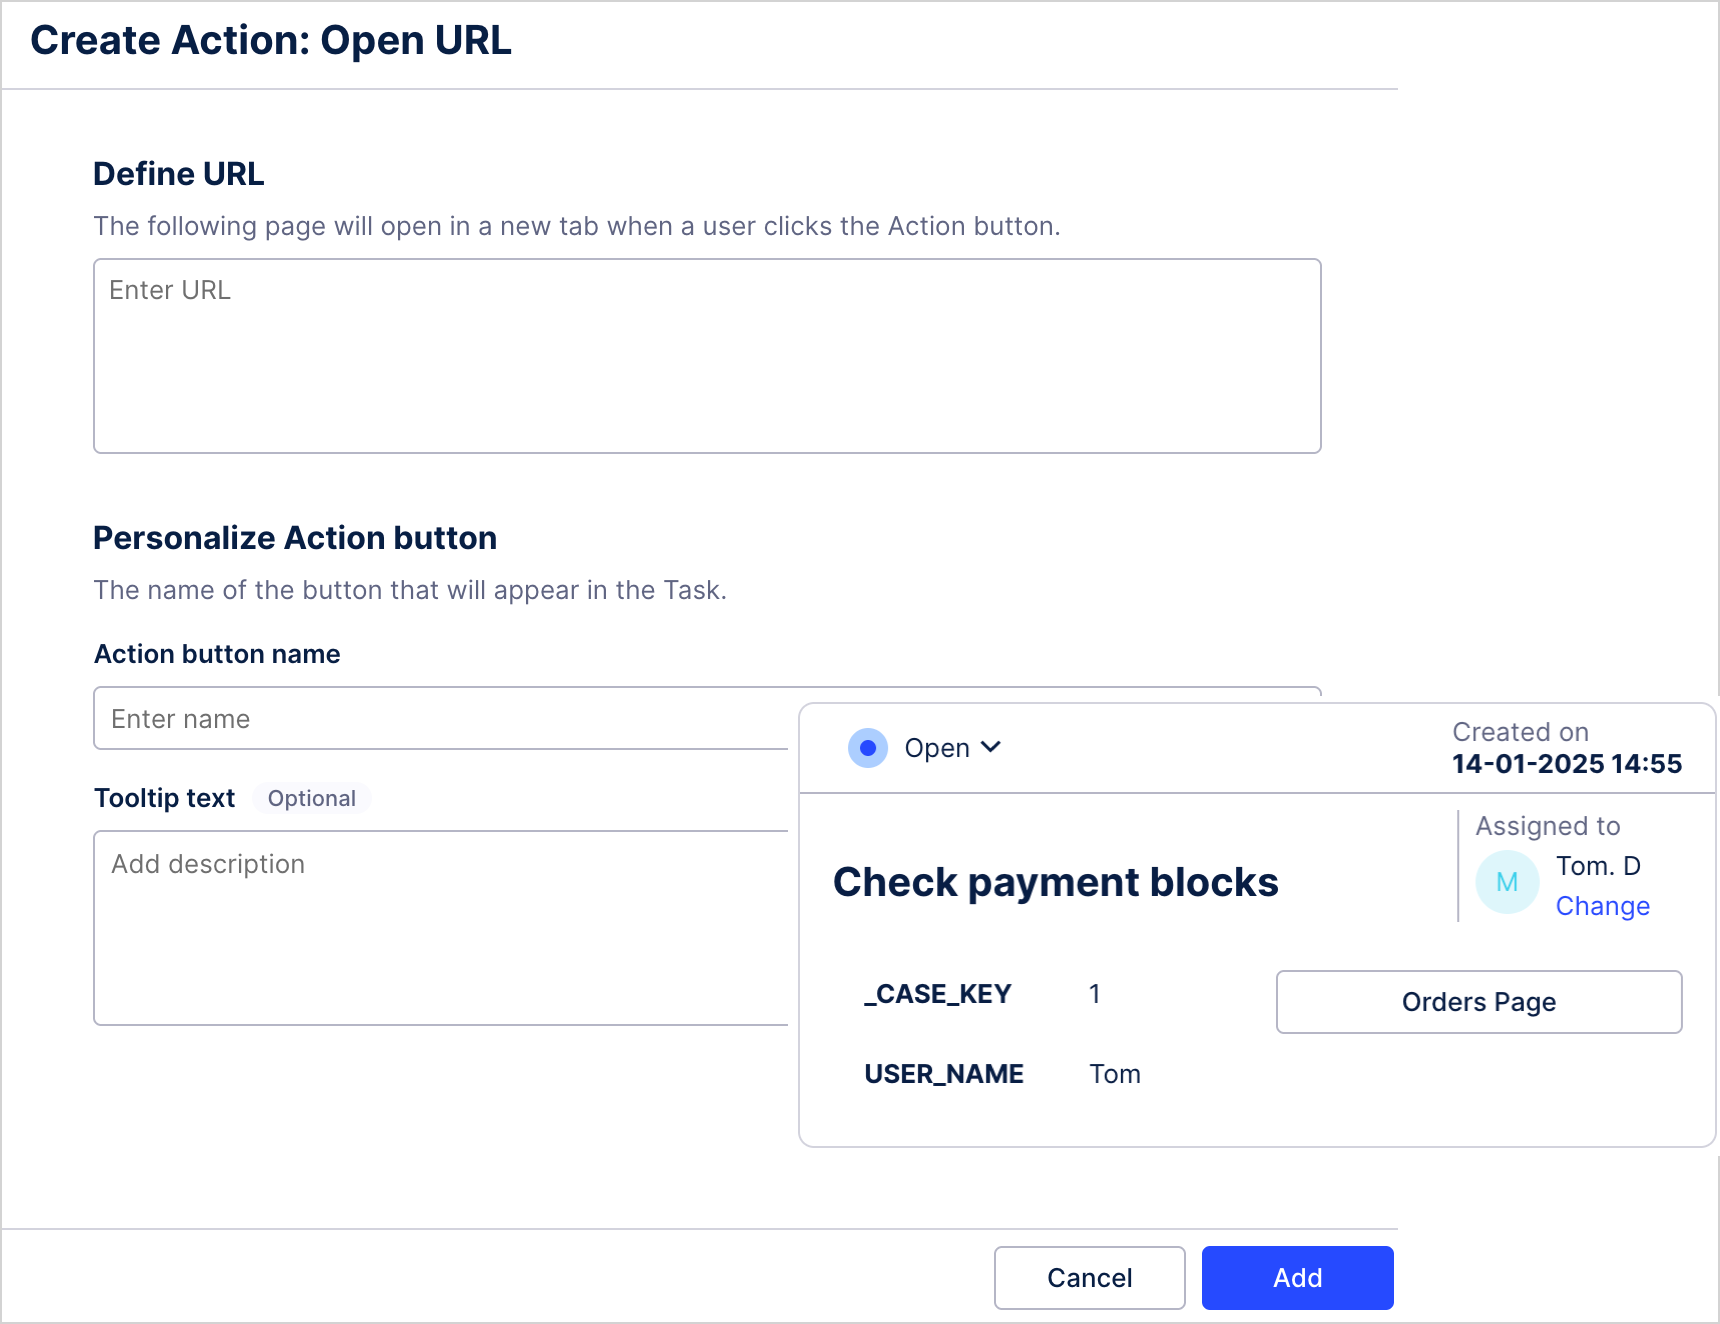
AUTOMATION Open URL tasks (2025-01-16)
This new action allows you to add a clickable button to your Tasks. When clicked, the button will open the specified URL in a new browser tab.
 |
For more information on using actions, see Creating Task Types.
STUDIO Use our App building guidelines to create effective content (2025-01-14)
You can create and publish highly customizable Apps using the View editing experience in Studio. To support you with this content creation, we've created App building guidelines for common business focused use cases and scenarios. These guidelines contain suggested App layouts, provide support for configuring relevant Studio components, and give you best practice advice.
Included in our App building guidelines are use cases such as:
Benchmarking: Create an App that allows you to compare business processes and performance metrics between dimensions, over time, or when considering specific activities. See: Benchmarking guidelines
Management overviews: Management over views or executive dashboards take siloed data and combine them into a single view, allowing executives and managers to identify issues and track progress towards company goals. See: Management view guidelines
Use case deep dive: Configure views that let users find opportunities for improvement, identify which inefficiencies are affecting the performance of processes, and find solutions to problems. See: Use case deep dive guidelines
The following image is an example of a suggest app layout for a use case deep dive view, with similar graphics provided for all use case guidelines:
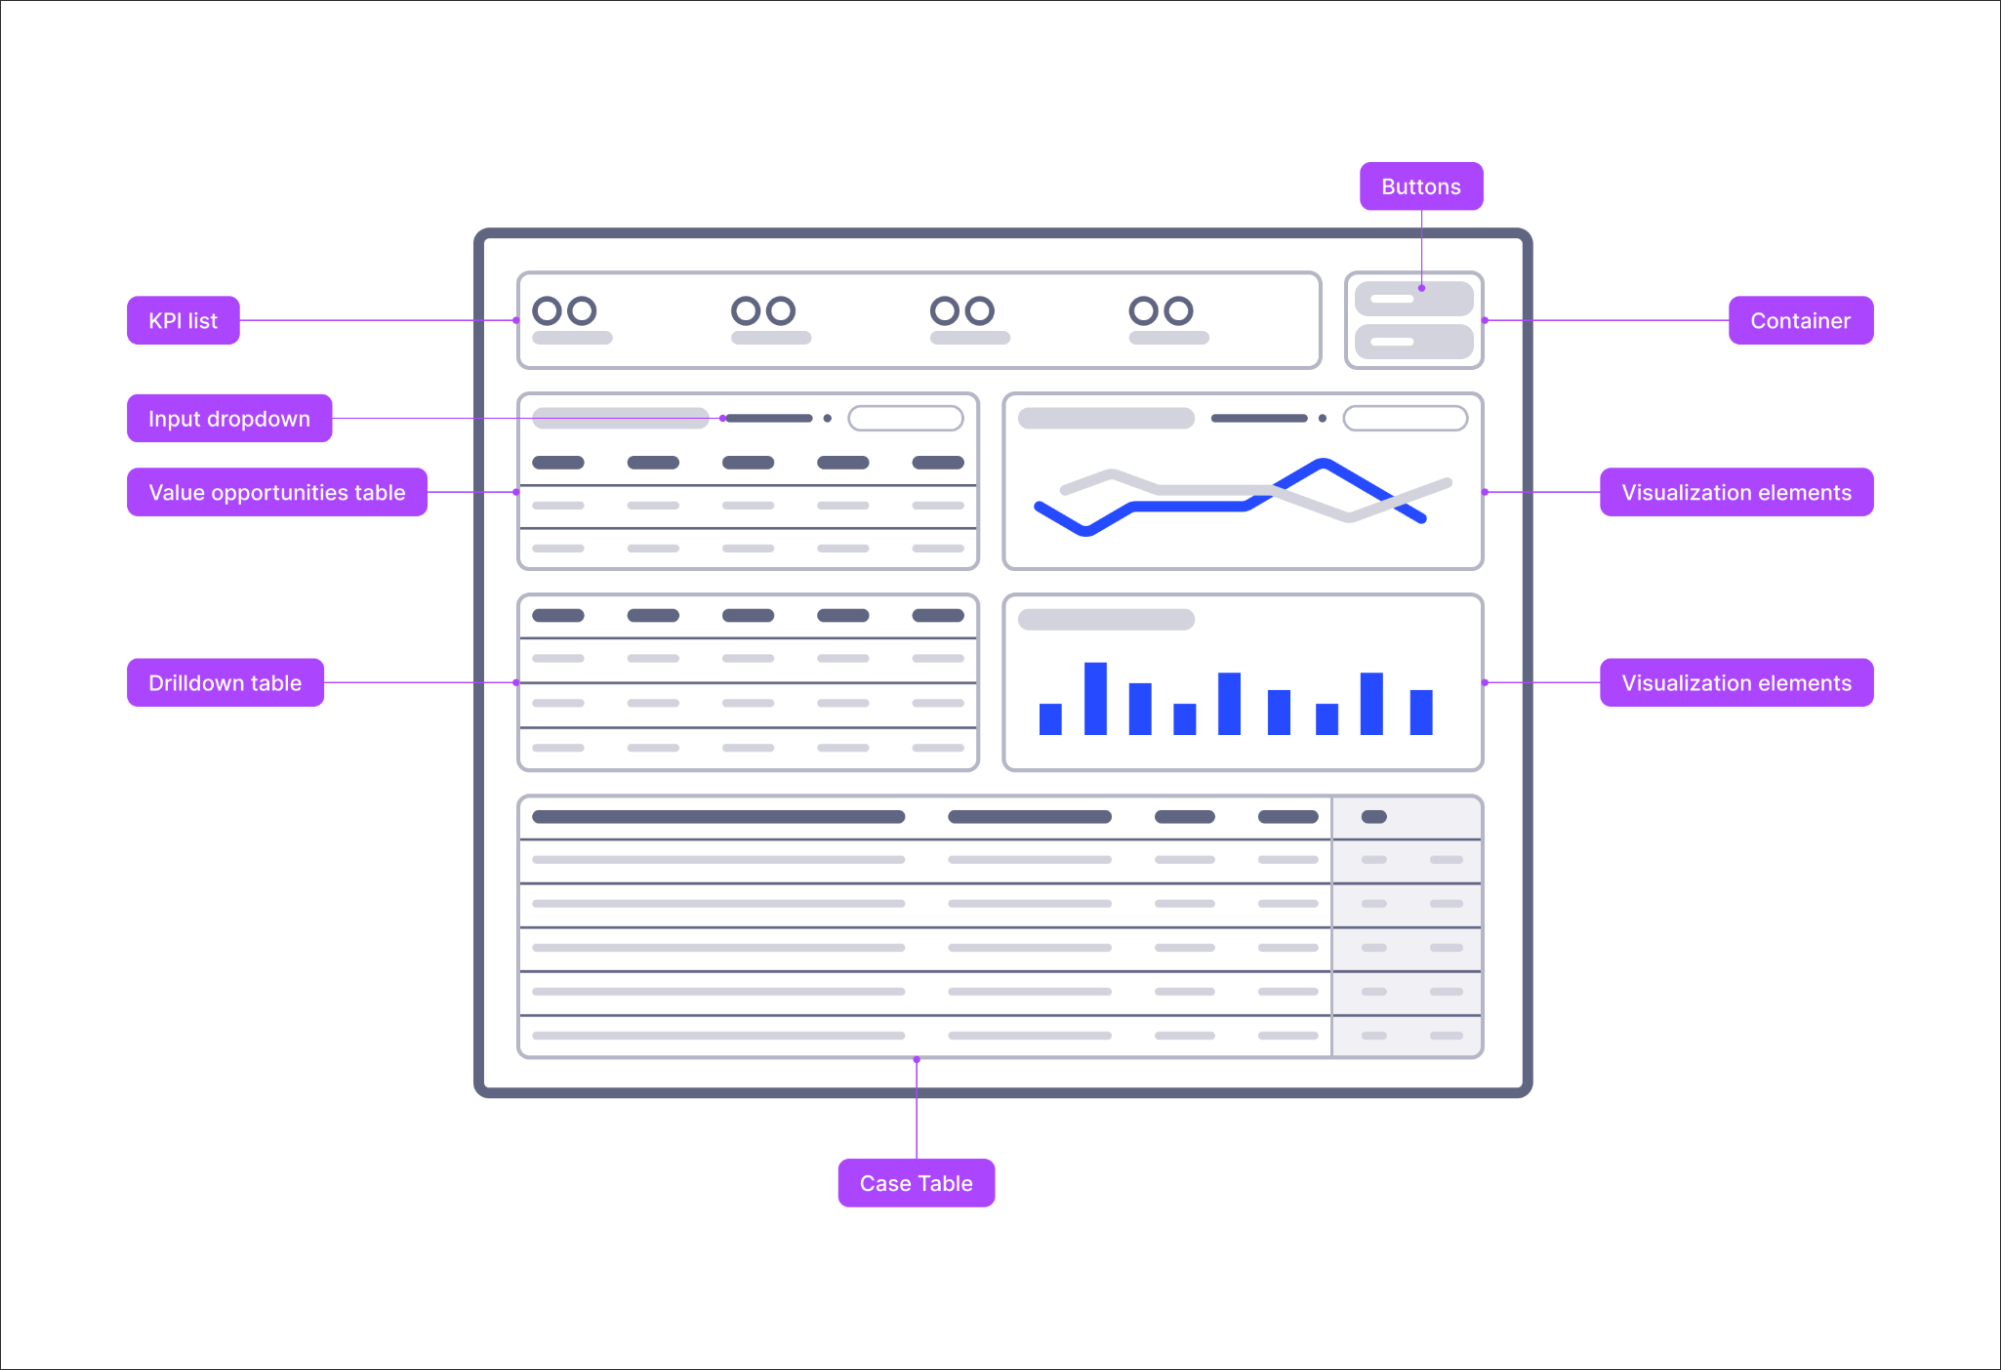
You can find an overview of our full set of App building guidelines and further descriptions here: App building guidelines.
PROCESS ADHERENCE MANAGER Improved management of Knowledge Models (2025-01-09)
We've simplified working with Knowledge Models in Process Adherence Manager (PAM).
You can now see which Knowledge Model is used in PAM. You can also select a new or updated Knowledge Model, with any Knowledge Model changes automatically reflected in your PAM target process model.
Automatic checks flag any incompatibilities with the existing Knowledge Model, with error messages providing information on how to fix them.
For more information, see Creating a Process Adherence Manager model.
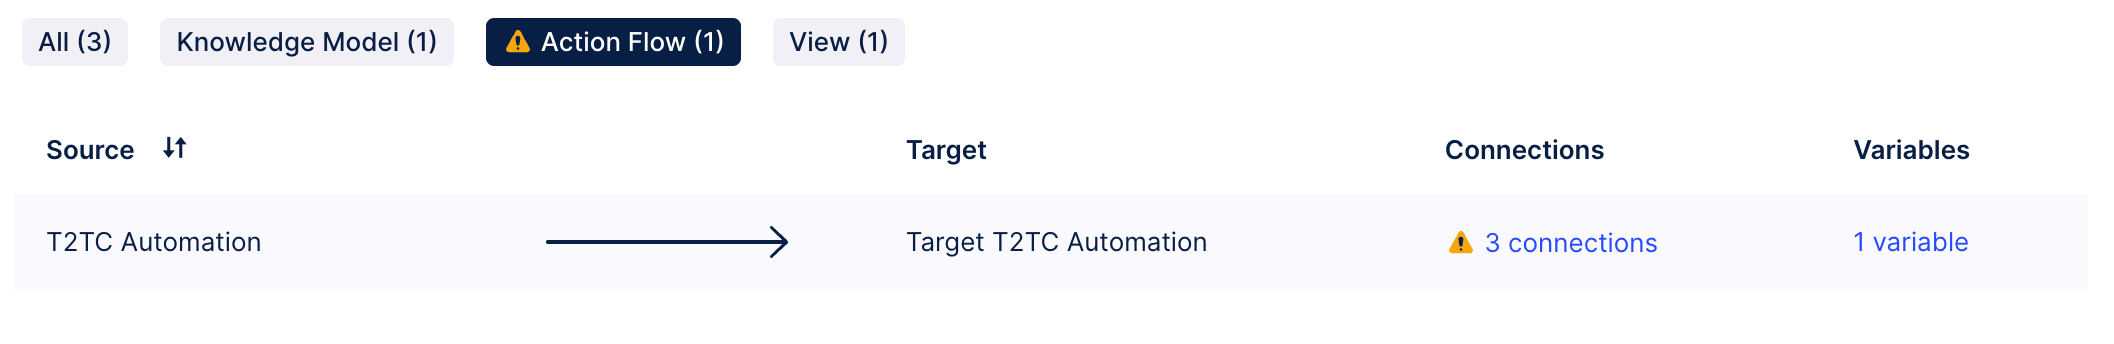
ADMIN & SETTINGS Team-to-team copying of Action Flows (2025-08-01)
Action Flows are now also copied as part of the Team-to-team package copying. As an admin, you can map connections and update variables for Action Flows in the target team during copying. This functionality is currently in limited availability. If you’re interested in trying it out, get in touch with us at Celopeers.
For more information on the team-to-team copying functionality, see Team-to-team copy.