Process Simulation results
When opening the Results view there are three groups of KPIs to recognize: The Process, the Pool and the Activity level KPIs.
You can view results of the Digital Twin, or compare one or multiple scenarios with the Digital Twin.
To view the results of the Digital Twin, click on the results button next to the Digital Twin. This will open a view with only the Digital Twin.
To compare the results of one scenario with the Digital Twin, click on the results button next to one of the scenarios. The Digital Twin will be shown in black, and the Scenario will be shown in a different color.
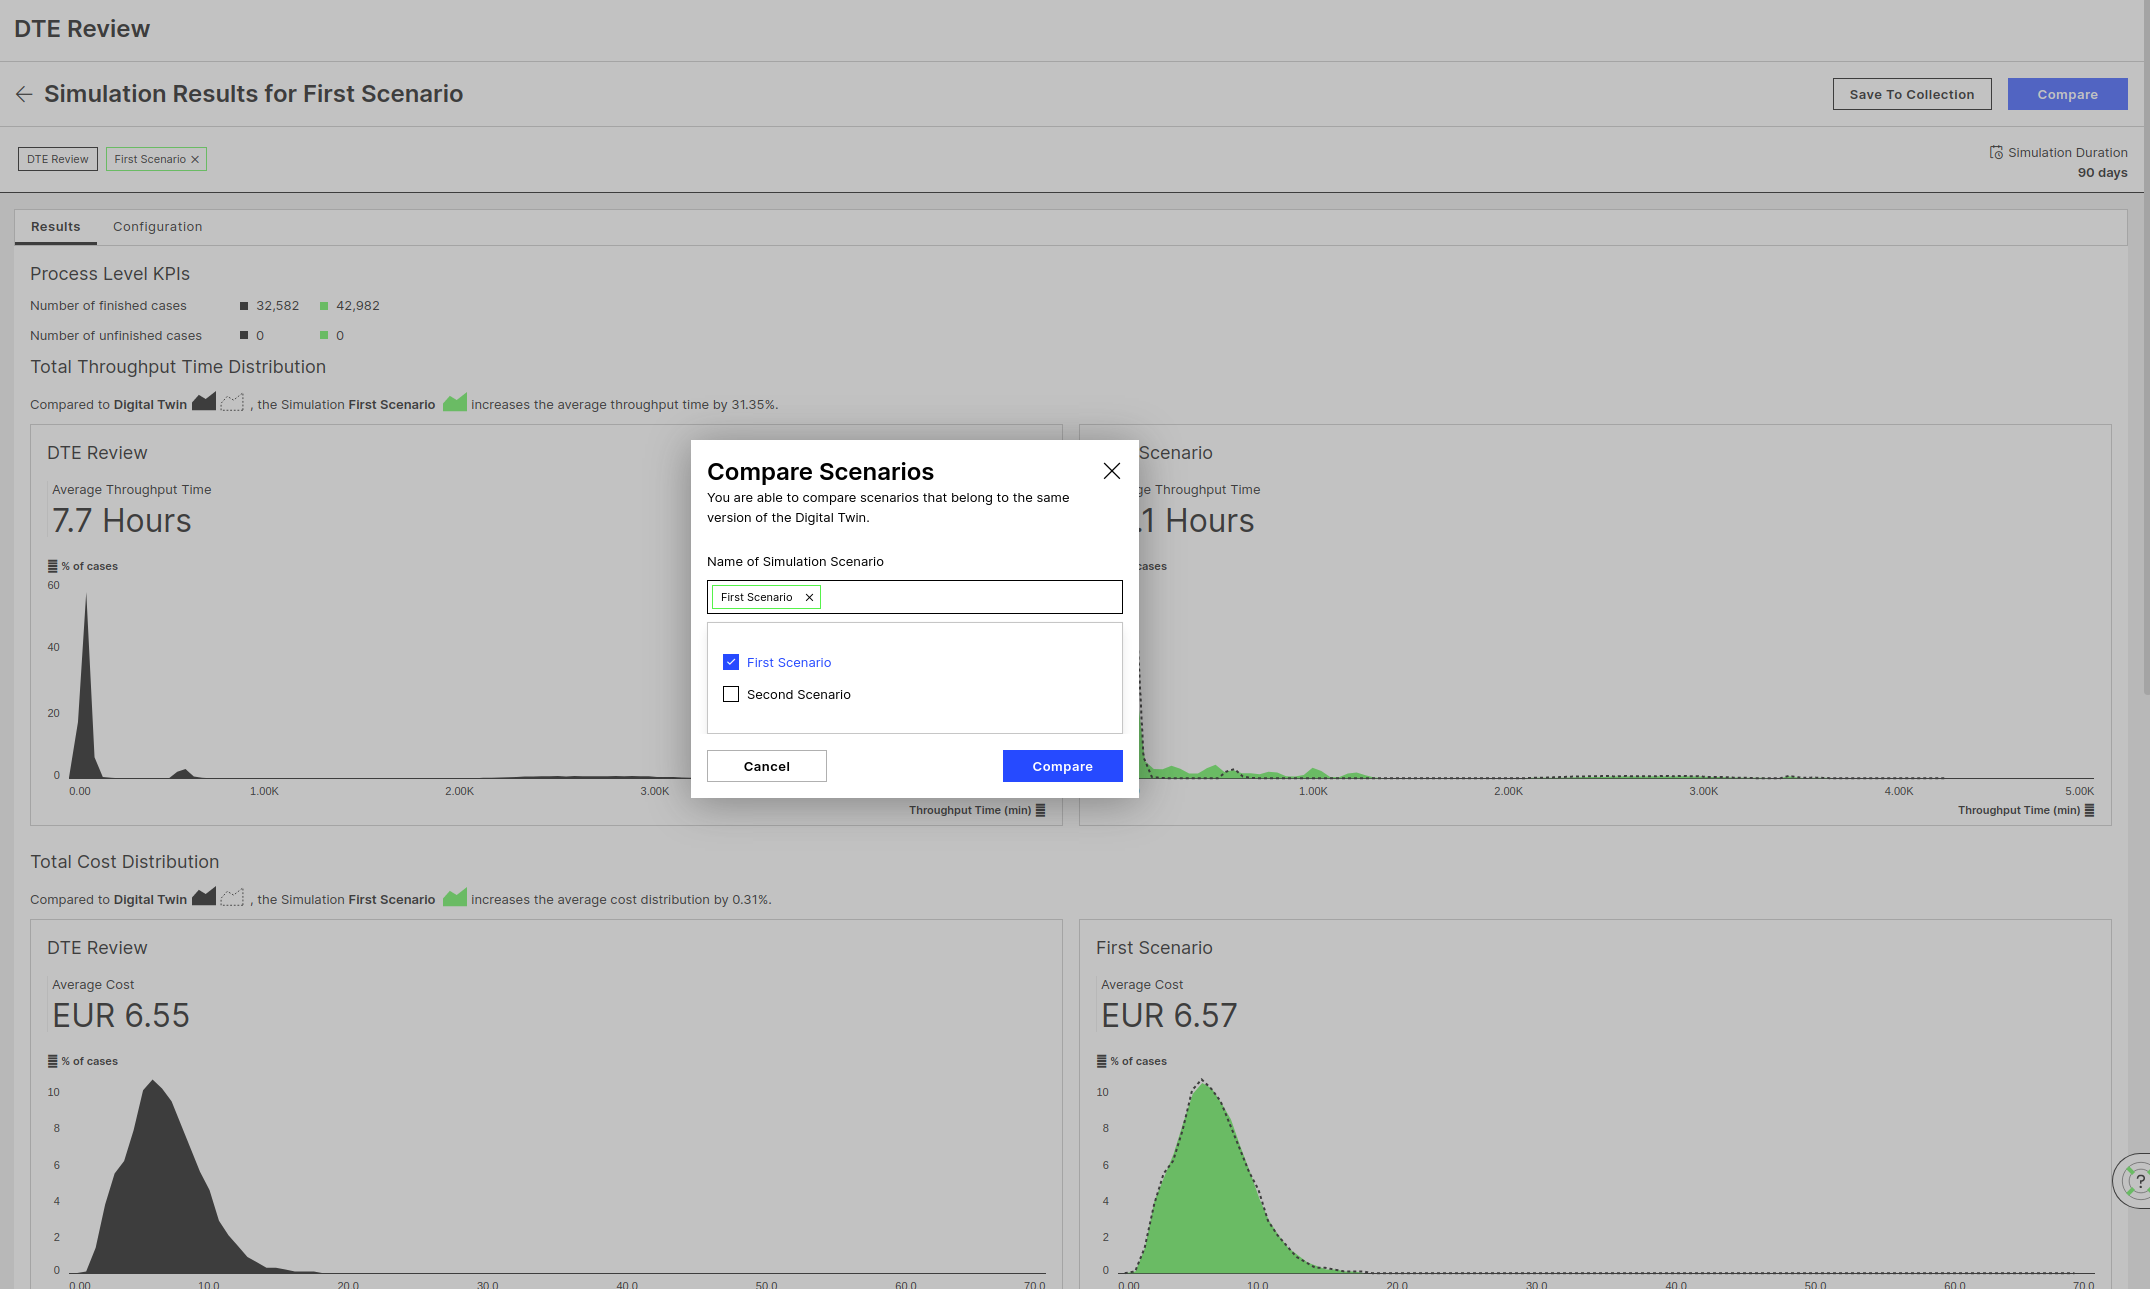
To compare multiple scenarios with the Digital Twin, first, open a comparison of one scenario with the Digital Twin. Then, click on the “Compare” button in the upper right corner. In the modal, select the Scenarios you want to compare and click “Compare”. Currently, a comparison of 3 Scenarios with the Digital Twin (4 in total) is possible.
Note
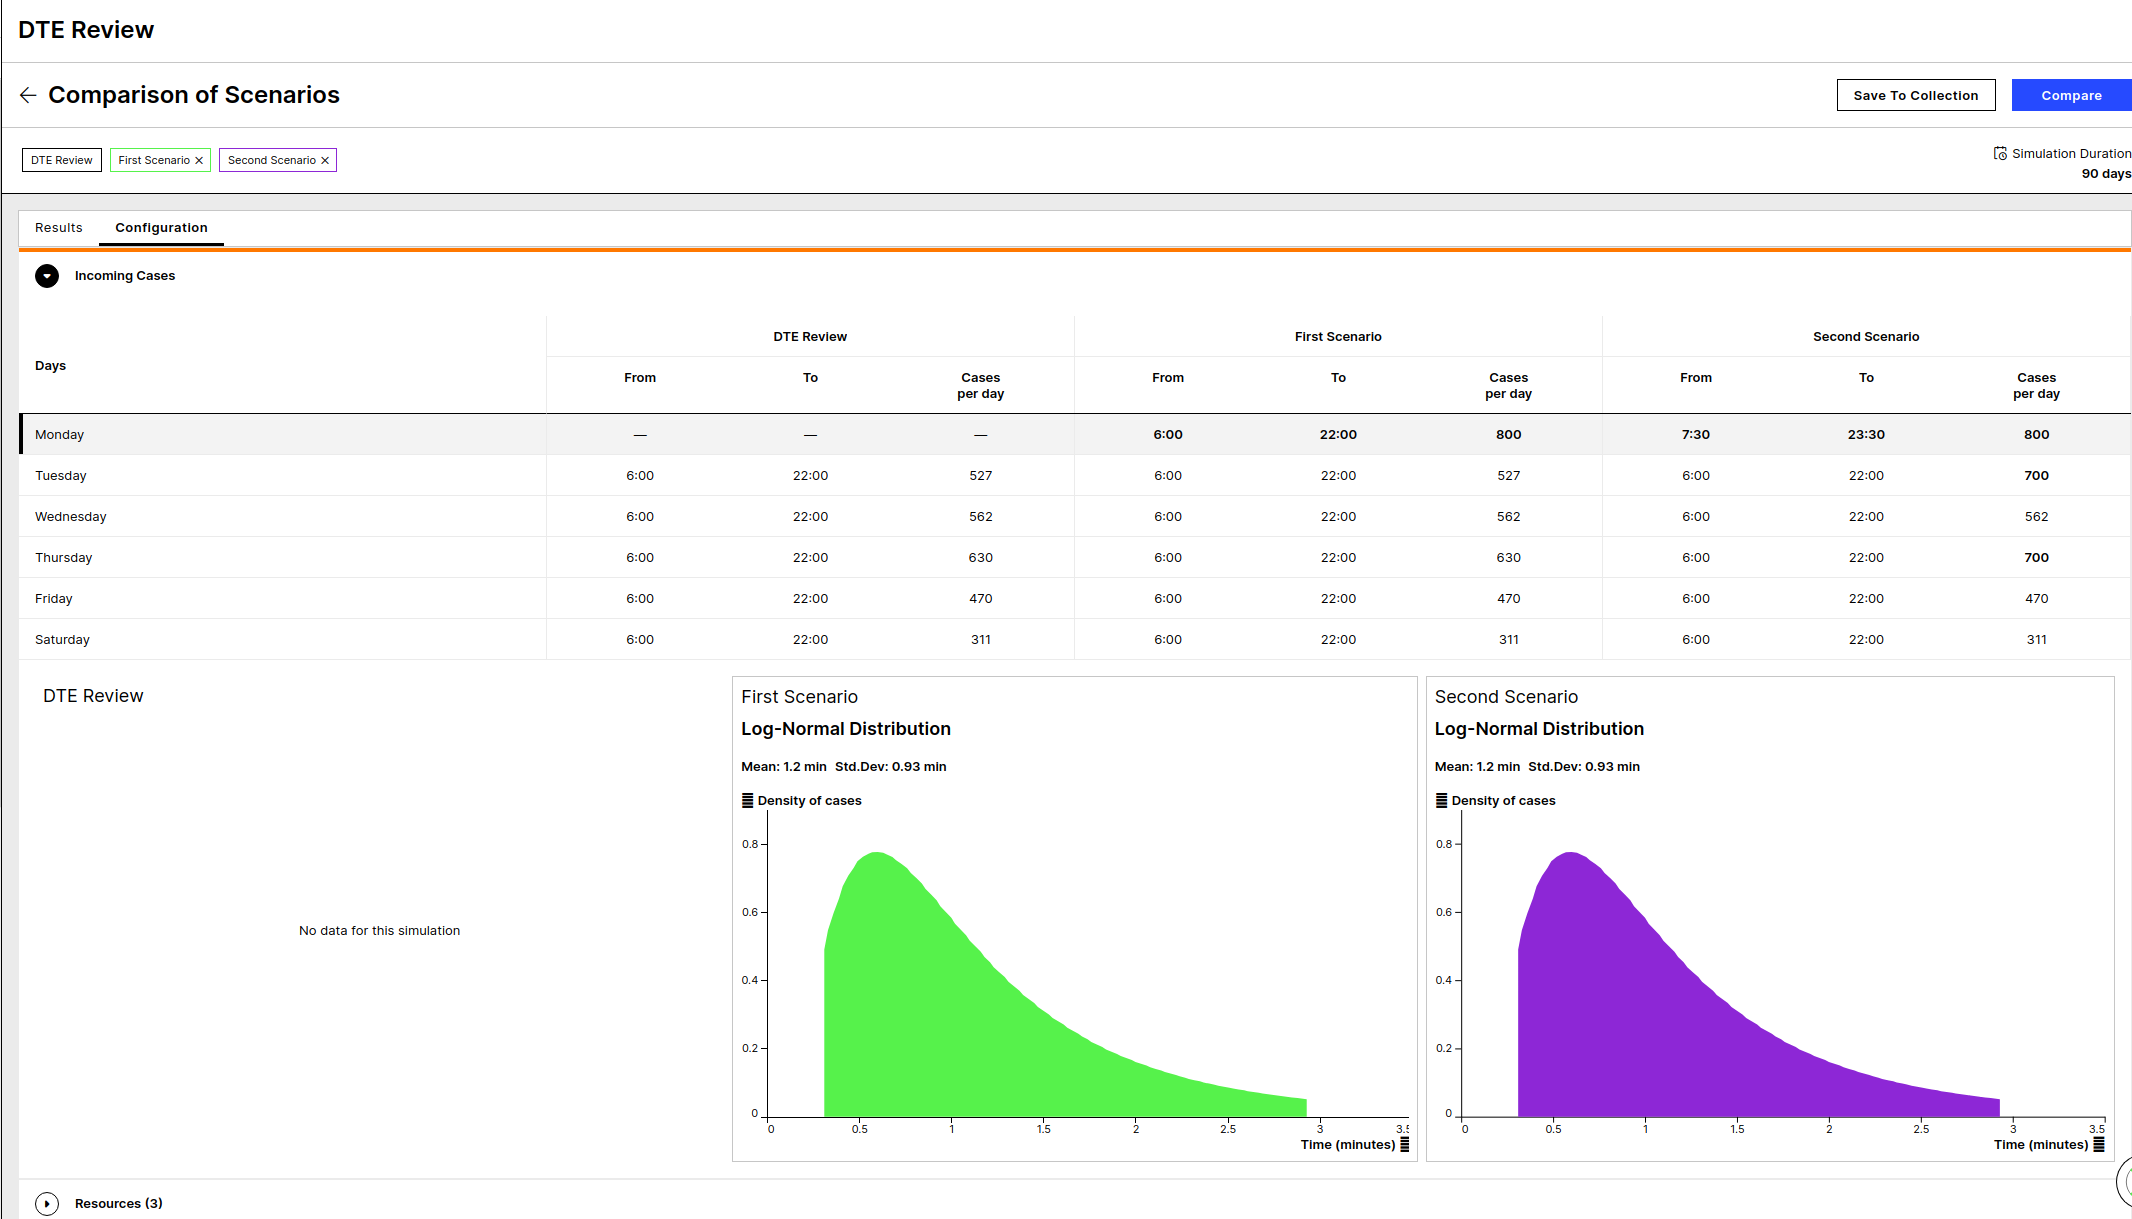
Note: In order to get an overview of all the changes accross the scenarios and the Digital Twin, open the "Configuration" tab where all the differences are highlighted.
 |
 |
Results
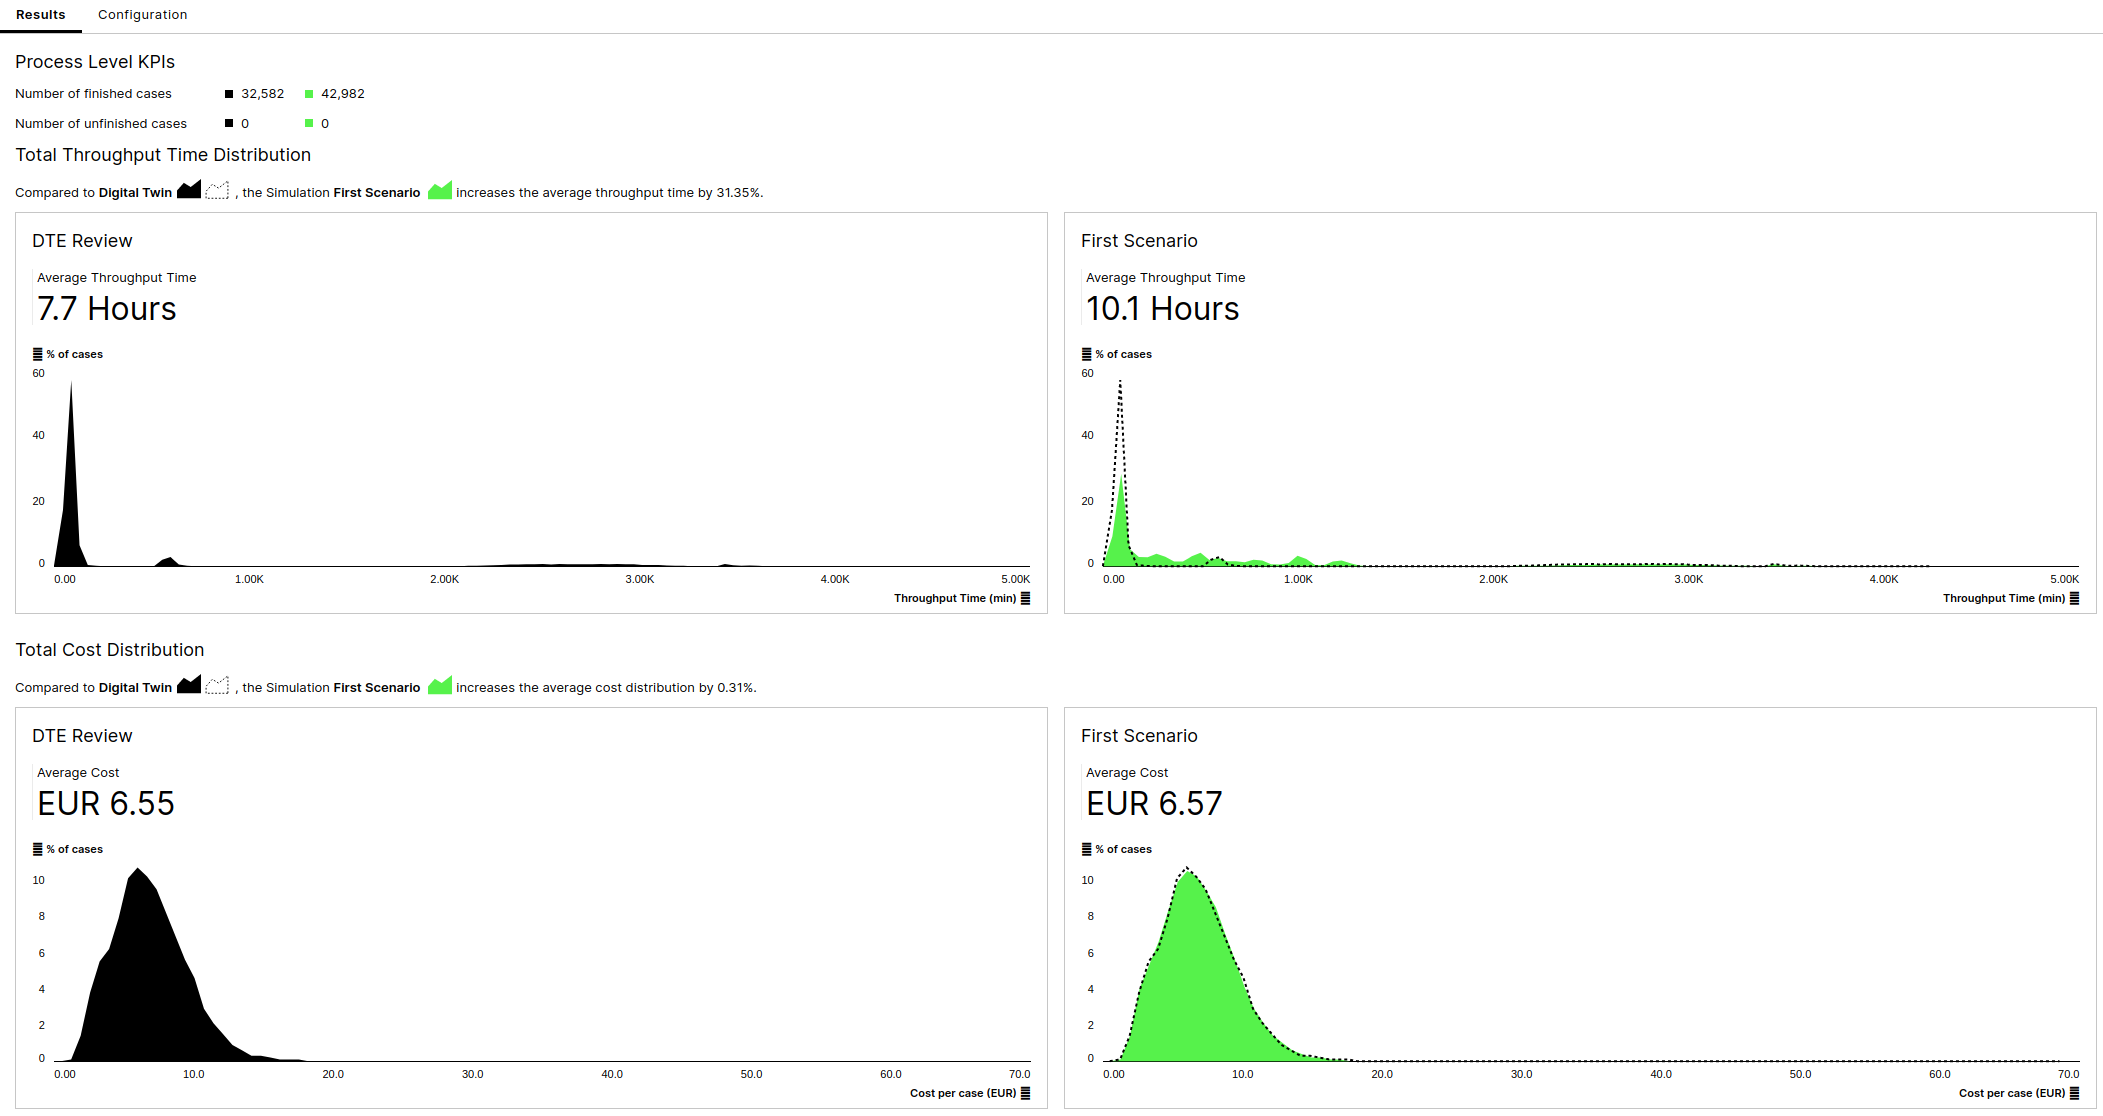 |
Number of Cases
The first KPI to see are the number of finished and unfinished cases that where created in the process during the simulation duration. This KPI is useful for both understanding the input quantity of cases to the system and how many cases the process can manage finishing over a time period, but also for interprating the KPIs that follow, many of which are aggregated over the finished cases only.
Throughput Time
The Throughput Time of all finished cases displayed on average and on a frequency graph.
Cost
The Cost of all finished cases displayed on average and on a frequency graph. The Cost is calculated based on the time the resources were actively processing a case multiplied by the FTE cost per hour.
Results
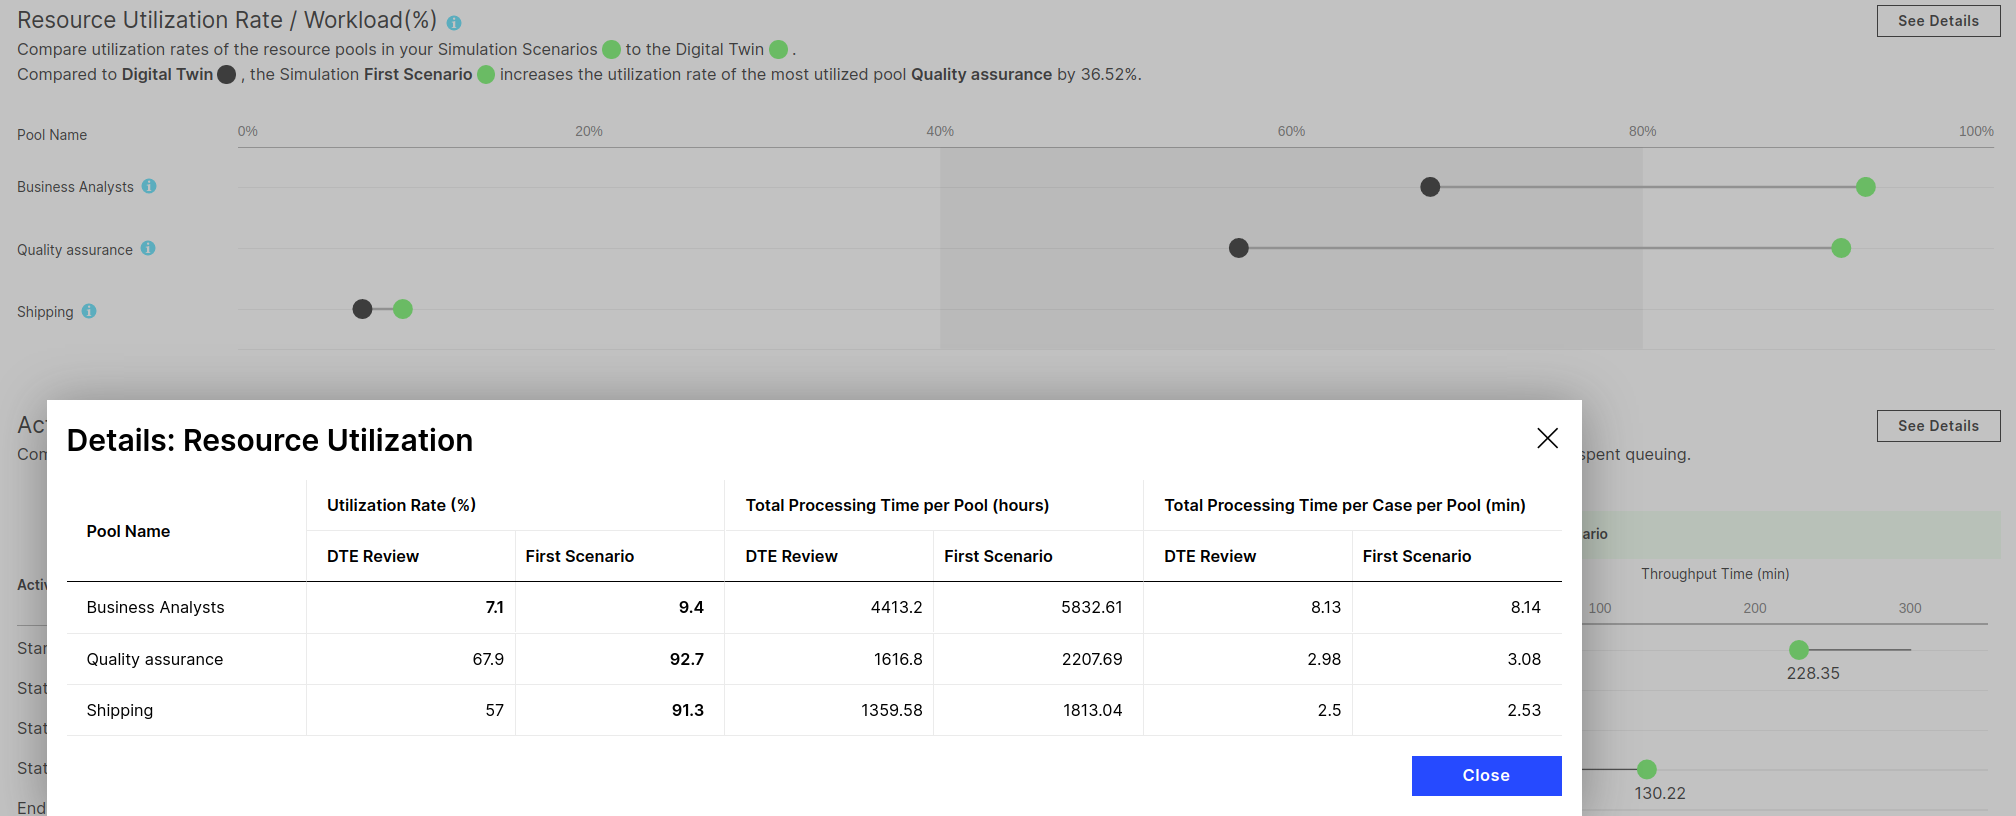 |
Utilization Rate
Resource Utilization Rate shows the percentage of working hours a resource pool is spending performing their activities. A utilization rate of 80% means that this resource pool is occupied at 80% of its capacity. The grey shade between 40% and 80% indicates something like a “best practices” interval - below that the resources are under-utilized, above that over-utilized. This is just an indicator based on what we learned when working with customers. Utilization of 100% means that all work hours are spent performing process activities. However, it does not factor in breaks, meetings, and other activities that are not part of the simulation model.
Total Processing Time per Pool
The total time the resources of a Pool spent procesing cases, both finished and unfinished.
Total Processing Time per Case per Pool
The average Processing Time a case spends on Activities assigned to the specific Pool until it is finished. Aggregated only over finished cases.
Results
Queuing Ratio
The Queuing Ratio defines how much of the overall Throughput Time a case is waiting in a queue. Only finished cases are considered in this step. Aggregated only over finished cases.
Throughput Time
The Throughput Time is the sum of Enabling Time, Queuing Time and Processing Time of a case. Aggregated only over finished cases.
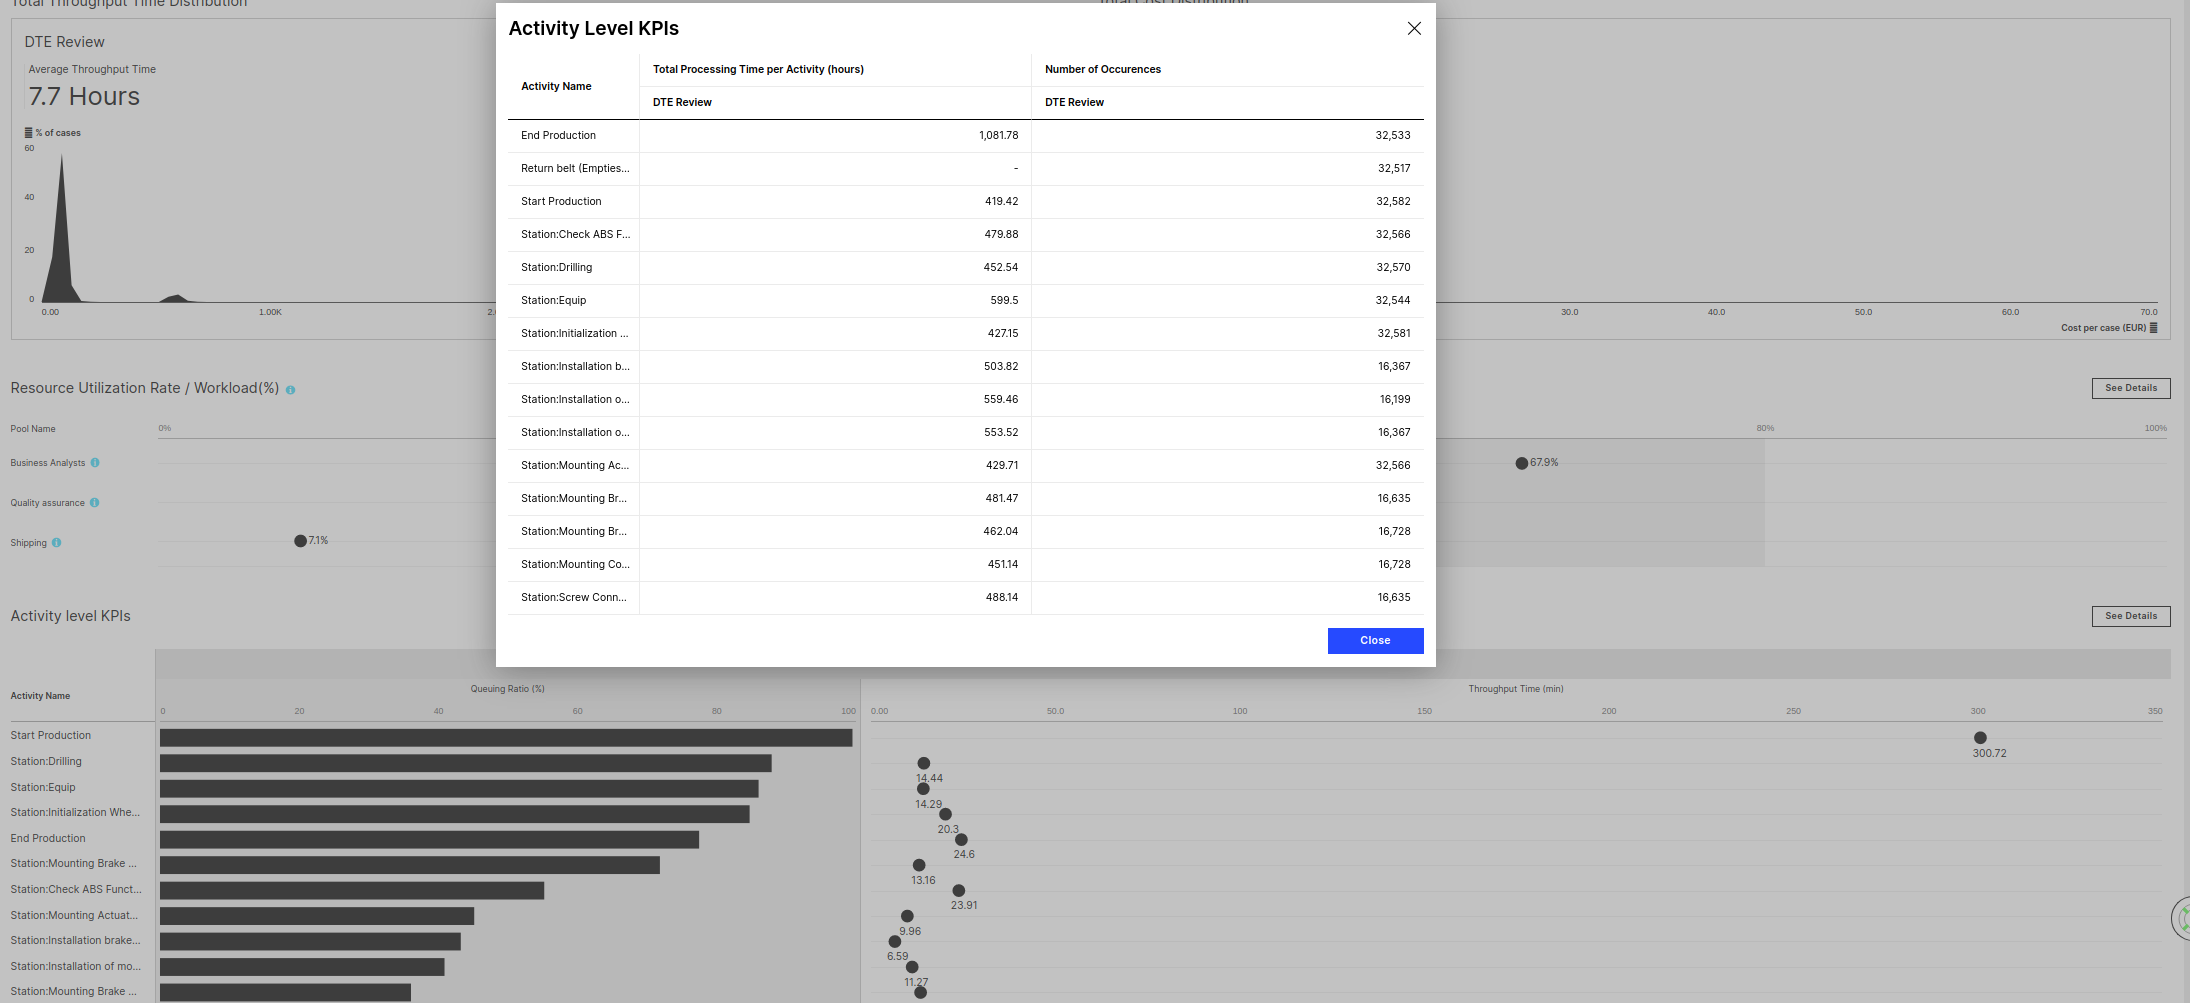
Total Processing Time per Activity
The average Processing Time a case spends on Activities assigned to the specific Pool until it is finished. Aggregated over both finished and unfinished cases.
Number of Occurences
The number of events with the given Activity. Aggregated over both finished and unfinished cases.
 |