Studio App Building Guidelines - Value framing
As a part of the Value Journey of every Celonis implementation, after validating and discovering value opportunities and insights, the next step is to size how much value you can generate from that use case. This process is called value framing, and creating a value framing view is a great way to go through the calculation of the value, scope the use case, and align the relevant stakeholders around a number that will serve as the goal to achieve for the next Fiscal Year (or any other meaningful timeframe).
When creating a value framing view, consider the following:
Value framing usage and example
The Value Framing View focuses on framing/measuring the value for one use case. Before building the Value Framing view for your application, consider how many use cases it tackles (one or multiple). If your application tackles numerous use cases, build multiple value framing tabs inside one view.
Think about the types of value your app can achieve for that use case. There is monetary value and non-monetary value, such as percentage improvements and metrics not measured with money. The usual types of monetary value you can have are Free Cash Flow (FCF), Profit and Loss (P&L), and Labor Productivity (LP) improvements. Non-monetary value examples include tons of CO2 saved, hours saved, and percentage of improvement in customer satisfaction (e.g., Net Promoter Score). If your use case tackles multiple value types, we recommend creating a different tab for each type, with its formula for the value calculation, tables, charts, and other components.
One way of calculating value is by multiplying the volume (number of cases, total net value), the impact per case, and a potential improvement factor (which defines how much value you can realistically get with the use case in a year). For more information, check out the Celonis Academy course on Value Framing here.
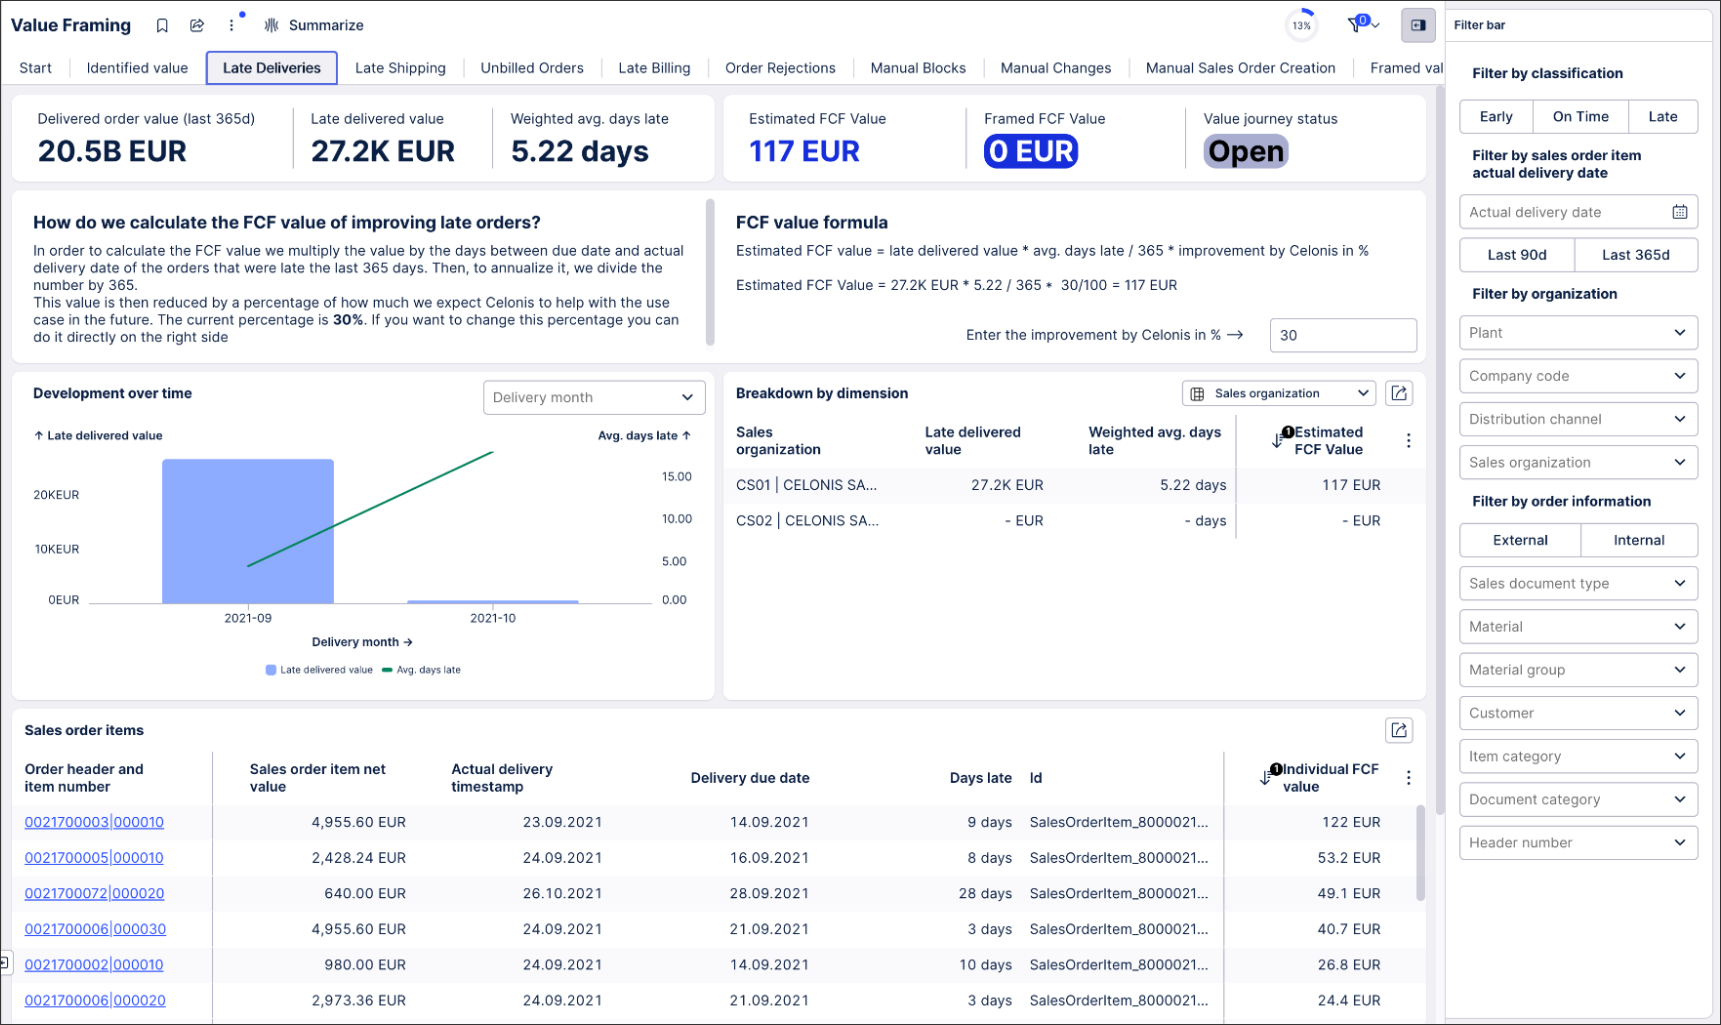
For an example of a Value framing view, see the Value Framing view as part of the Order Management Starter Kit in the Celonis Marketplace.
 |
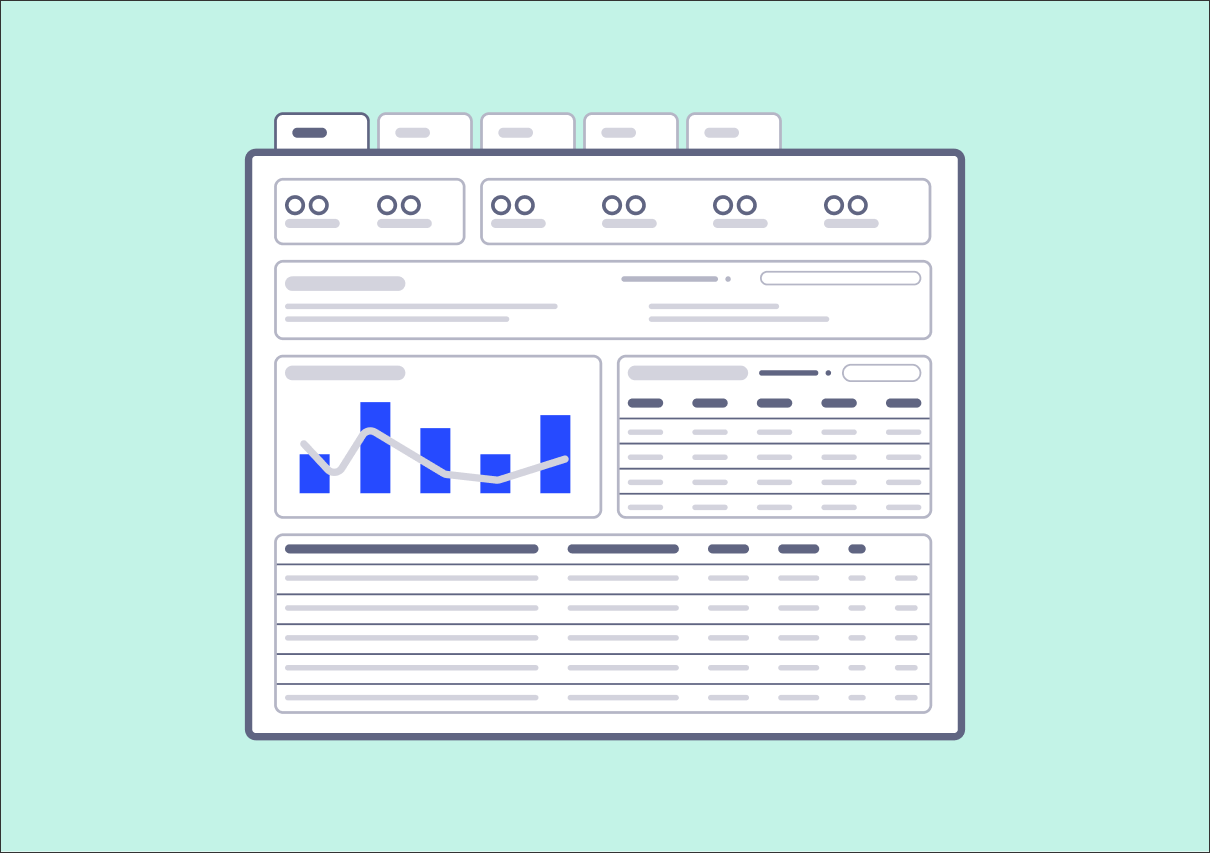
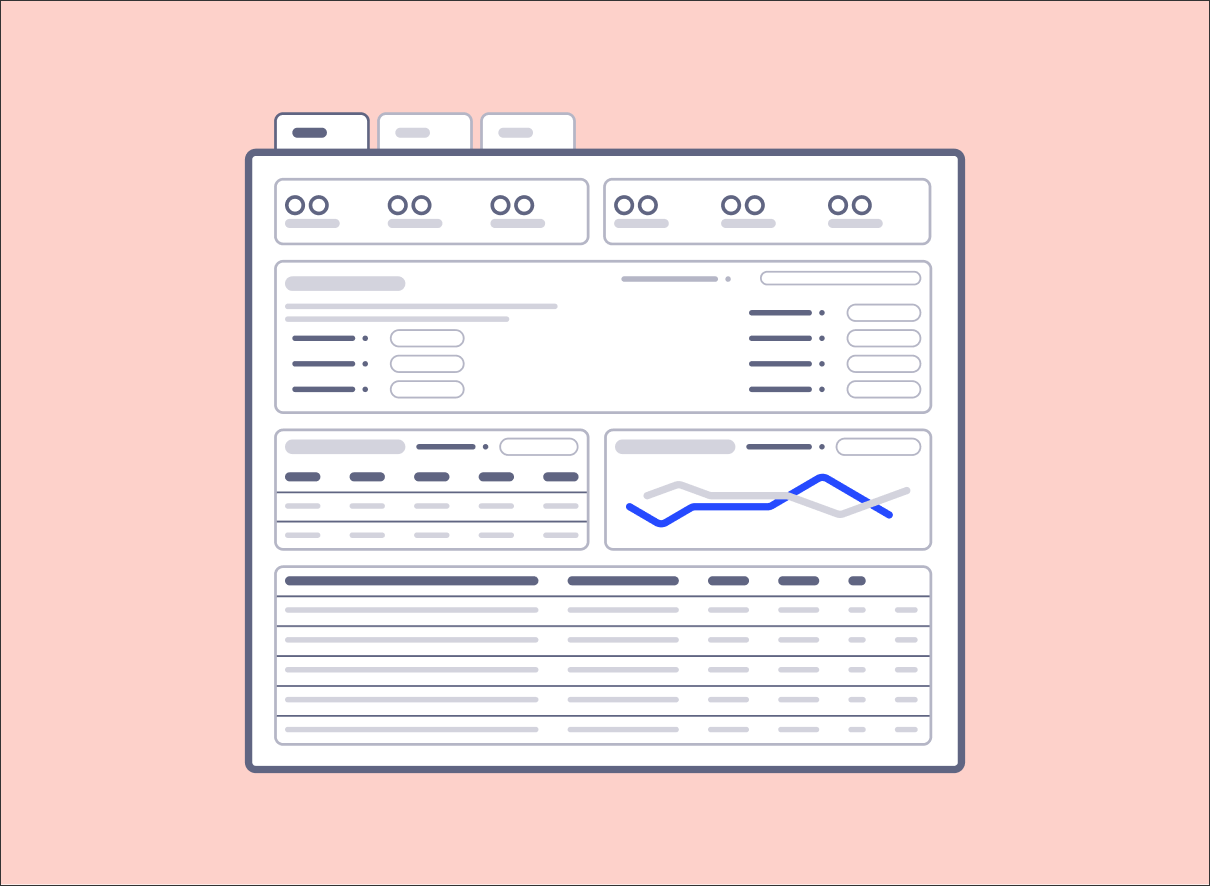
When creating a value framing view, we recommend dividing your view into the following areas:
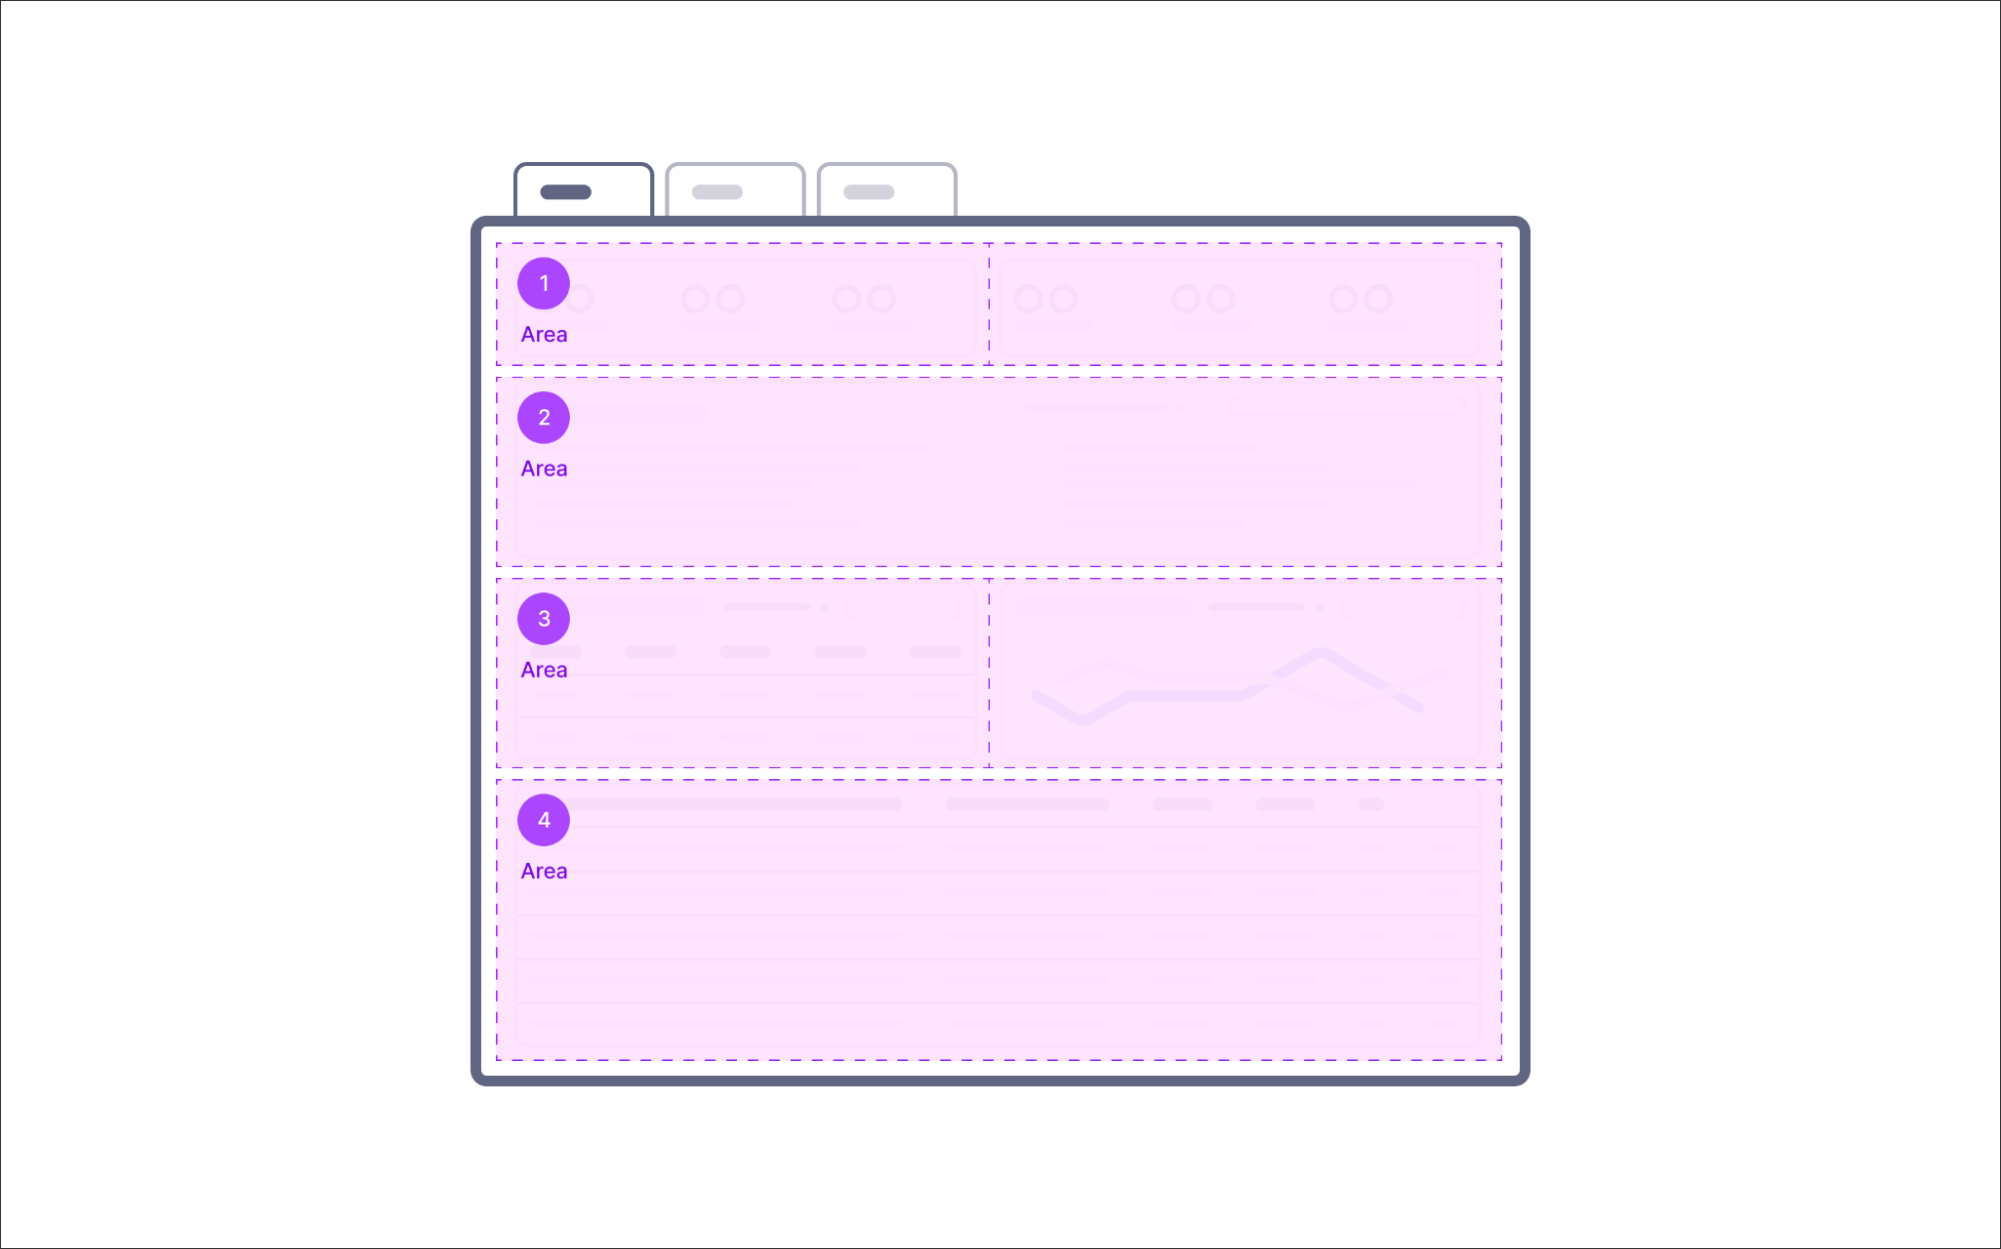 |
These areas can then be created using a combination of Studio components:
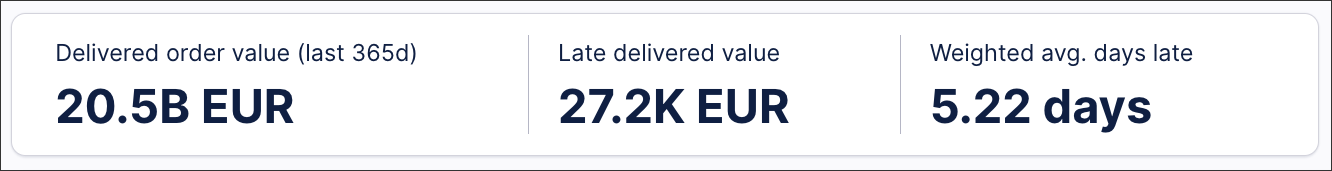
KPI list to display the metrics for value calculation
Use a KPI list to display the most critical parameters/metrics for calculating the value (e.g., Weighted average delay, late delivered value of the 365 days). Displaying them will let the CoE or Analyst user get a feeling for the size of the issue and will change when the user filters on the view (e.g., a user might want to filter the framed value for only one business unit or region).
 |
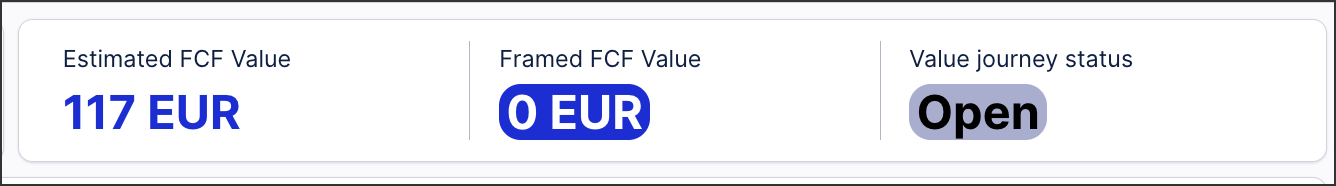
KPI list to display value framed and value estimate
Use the KPI list to display the current estimated value for the use case and the current framed value. Optionally, you can also add the value journey status as a KPI to display whether there is an agreement on the framed value and whether the value framing has already happened. By default, the value journey status are “Open”, “Value framed”, “Value realized.”
Text box to show how/explain value is calculated
Explain in as simple terms as possible how the value is calculated, what the scope is (which filters are applied by default), and provide a short description of every metric/parameter used to calculate the value.
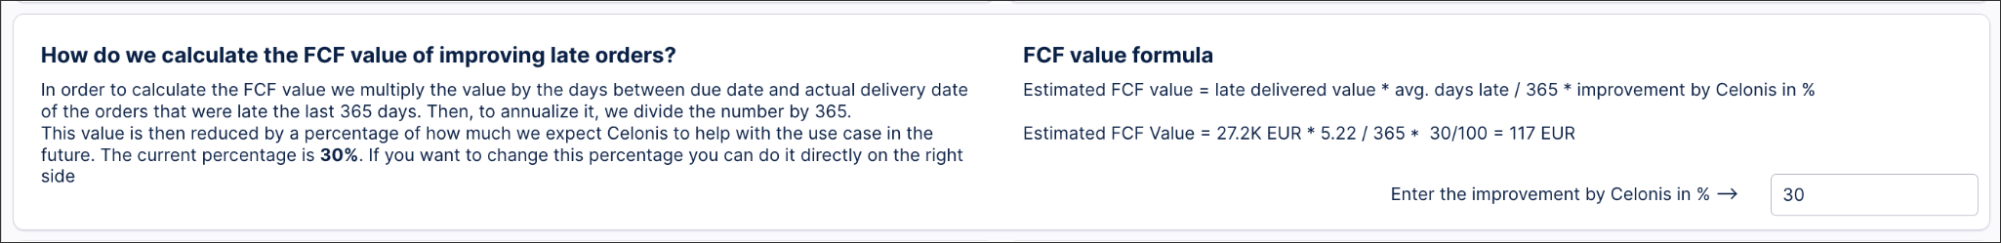 |
Input boxes and Input dropdowns to change the parameters used to calculate the value
Input boxes and input dropdowns let business users define the parameters used to calculate value. They take information from the view and update a variable in the background that is then used in the value calculation formula.
To learn how to configure an input dropdown to change a variable, see: Input dropdown.
If you have more than 2 or 3 parameters to configure for the use case and value calculation, we recommend creating a separate view for use case configuration and setup. To read more about setting up a configuration view, see: Initial app setup guidelines.
 |
Time series chart to display the development over time of the primary metrics
Time series show the user how the metrics change over time. This will let the user decide on the relevant scope (e.g., when the delay was the highest) or check for any problems in the data (e.g., problems that happened during data extraction).
Some things to take into account here are:
The time dimension to use should be linked to the use case (e.g., delivery due date for late deliveries use case).
Consider whether it makes sense to have an aging chart or a time series chart (e.g., for the unbilled orders use case, an aging chart makes more sense).
Always use the total value for the y-axis metric, not the sum of cases, as this view is focused on value.
Breakdown table to help with scope filters
We recommend adding a table with a breakdown dropdown with all the relevant dimensions (e.g., the attributes/dimensions from the filterbar) to let the user filter on the table to define the scope of the value framing.
Some of the things we recommend to keep in mind when building the table are:
Add the most important metrics for value calculation, but keep the number of columns minimum to avoid horizontal scrolling.
Limit the length of the column header names and use human-readable names.
Sort the table by the value to highlight the areas the user needs to focus on and filter on them.
Object table to validate the value
An object or “case” table is beneficial when validating if the parameters you have set up are the right ones and ensuring that users who haven't configured the use case can trust the data they are seeing.
When creating this table, make sure to:
Have the table at the bottom of the view and make it full-width.
Add all parameters used to calculate value as columns to allow for quick calculation.
Add a column for the value per case (without the Celonis improvement parameter) and use this to sort the table.
Link each row with an object details view to get additional information on that object, such as related objects and process flow. More information on how to build such a view can be found here.
When creating your value framing views, we recommend:
Building a value framing view if you want to give confidence to the business that is working on this use case. Seeing the data inside Celonis will help users trust what they are seeing.
Separating each value type and use case into different tabs. If you have many use cases in your app, we recommend that you create an overview tab with each of the use case estimated and framed values.
 |
And when creating your value framing views, we'd discourage:
Using the value framing view to track the realized value. The Transformation Hub is designed to help you with that.
Building a value framing view if you already have a good idea of the use case you want to pursue, and this is a one-time use app. Building a value framing view can take time, so it makes most sense if you can scale it by using it multiple times.
Adding too many dropdowns to configure parameters. It's better to bundle them in a linked view that you can open by clicking a button.
 |