
Celonis Product Documentation

View architecture

The SK has some central Base views in which the standard layout and standard components for the respective context are defined. The following views are the main Base Views.

  • Process | Base

  • Validation | Base

  • Outline | Base

  • Sidebar | Base

  • Widget | Base

  • Chart | Base

  • Overview | Base

  • KPI Detail | Base

  • KPI Calculation | Base

  • KPI Tab | Base

  • KPI Chart Documentation | Base

  • Settings | Base

This means that if you want to adjust the content (e.g., change the type of chart, adjust the size of the sidebar, add a new component), those views are the starting point.

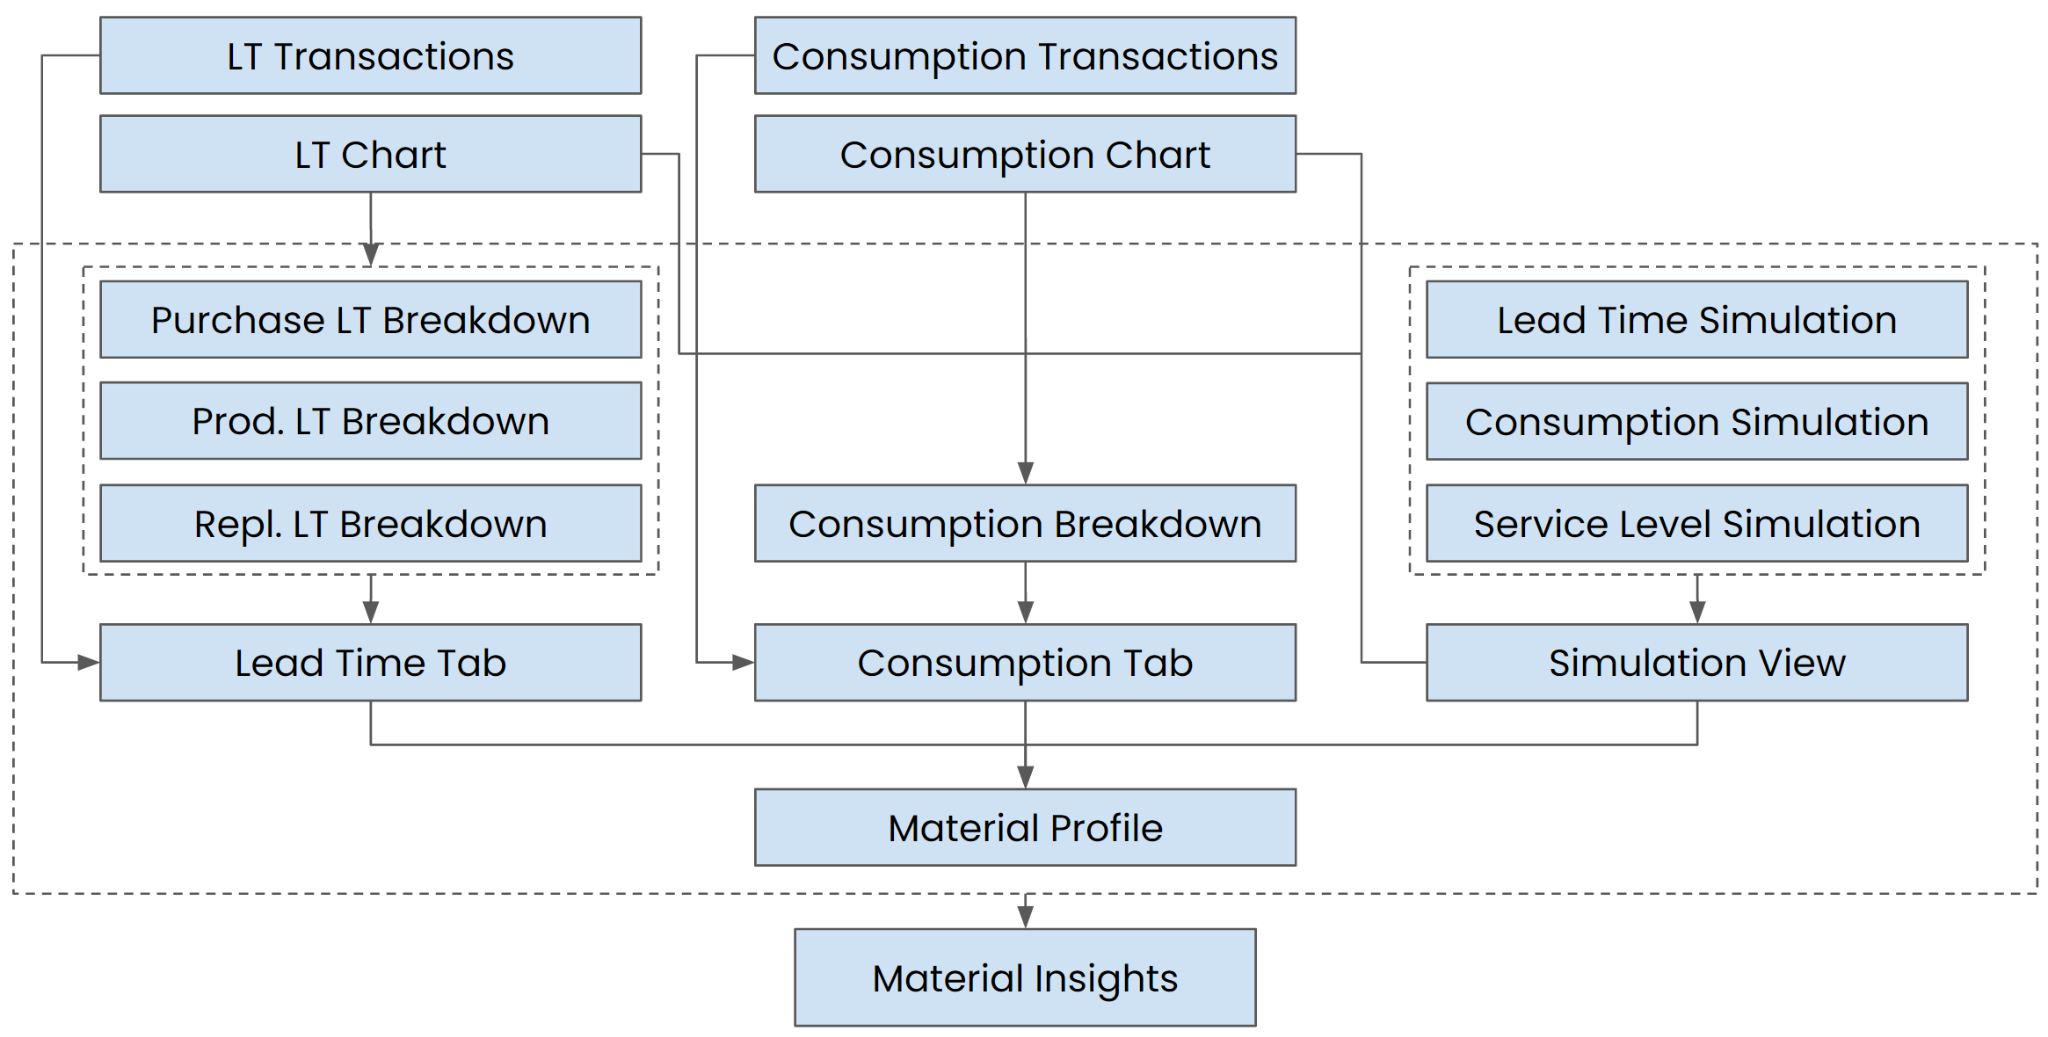
The architecture diagram below shows how the individual components are connected. The use cases (Excess Inventory Rate, Material Availability, Turnover Rate, Days of Cover, and Service Level) extend the Base Views “Process | Base” and “Validation | Base” while the Overview views extend the “Overview | Base” view. The Sidebar is used in every view as an embedded view. The “Widget | Base” defines the base which the Widgets in the “Overview” extend and the “Chart | Base” is the base view for embedded views inside the widgets.

image2.png

The following diagram shows in more detail how the Excess Inventory Rate Validation Cockpit view is built. It has the Material Profile and the Settings views as profile views, the Sidebar, and Excess Inventory Rate Chart as embedded view and the Validation | Base view as a base.

image11.png

The next diagram shows how the Process Cockpit Overview is built. It has the sidebar and the settings view as profile views, the sidebar and widgets as embedded views and the overview base as a base view.

image10.png