Filters
Filters and routers allow users to navigate through Skills.
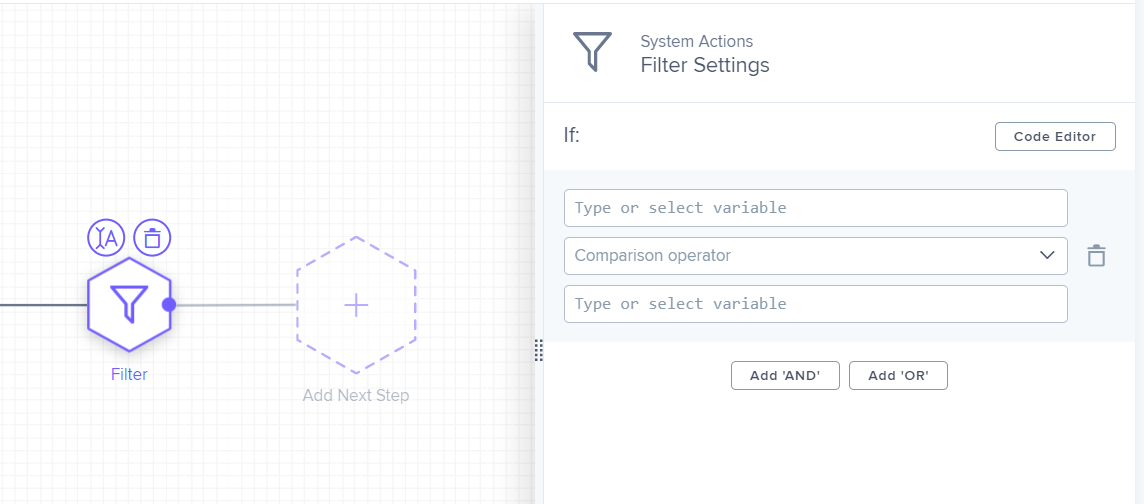
Filter
Type or select variable (required): Define the variable which will be used for filtering. This variable can, e.g., be passed to the Skill from the Action Engine. Click on the field to select a variable or manually type a variable.
Comparison operator (required): Choose the operator which will be used for comparison of the variable. Use the dropdown to select an operator.
Type or select variable (required): Define the variable which will be used for comparison. Click on the field to select a variable or manually type a variable.
Add 'AND' (optional): Add additional filters. Filters can be connected with an 'AND' to define that all filter conditions must be true.
Add 'OR' (optional): Add additional filters. Filters can be connected with an 'OR' to define that at least one filter condition must be true.
 |