Analysis Interaction
Analysis - Maintenance only
Effective August 1st 2025, Analysis features can no longer be purchased as part of a Celonis Platform license. Celonis continues to maintain Analysis (by fixing bugs and ensuring that performance remains strong) but no further feature development will take place.
You can migrate your existing Analysis assets to our enhanced Studio Views, giving you access to our intuitive View creation capabilities. To learn how to migrate your existing Analysis to Studio Views, head to: Migrating Analysis to Views.
And for an overview of our enhanced Studio features, see: Studio feature availability matrix.
Analysis Header includes case coverage, selections, bookmarks, access to edit mode to publish and edit analyses.
Selections can be applied from components and are shown in tabs in the header.
Exporting functionalities allow the user to download .xlsx, .csv, or png files of components and a documentation.
Sheets provide the possibility to include a structure in the analyses.
Structure and Navigation
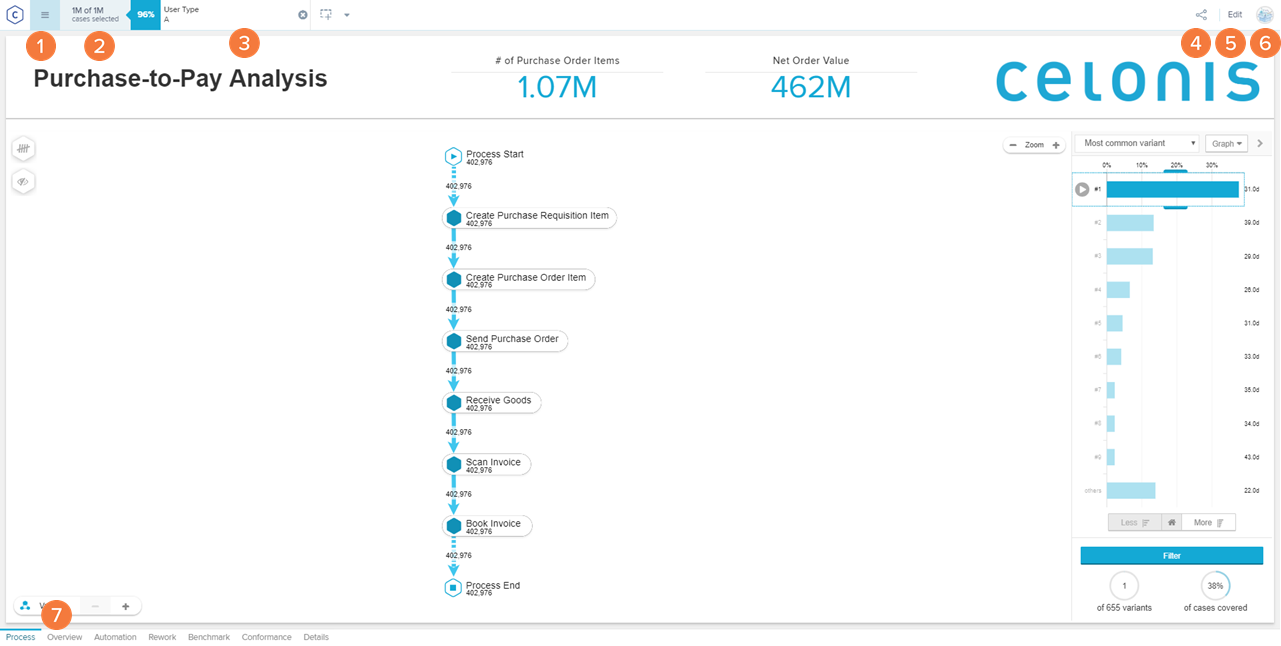
Analysis Options: The icon provides access to the analysis options.
Case Coverage: The case coverage at the top left shows you how many cases of the total dataset are currently selected.
Selection Bar: Active selections are shown in the selection bar that is applied to the whole analysis
Share Selections: Selections can be directly shared with other users (see Bookmarks and Share Selections)
Edit: An analyst can enter the edit mode, viewers do not have this option available.
Viewer and Analyst
In the screen above, the selection is the view of an analyst when in viewer mode (e.g. after having published the analysis). Permissions of viewers and analysts can be set in Admin & Settings and the difference between viewer and analyst is further described with examples in the section Viewer and Analyst.
Analysis Options
Analysis Options for the viewer are shown on the left, for the analyst in edit mode are shown on the right.
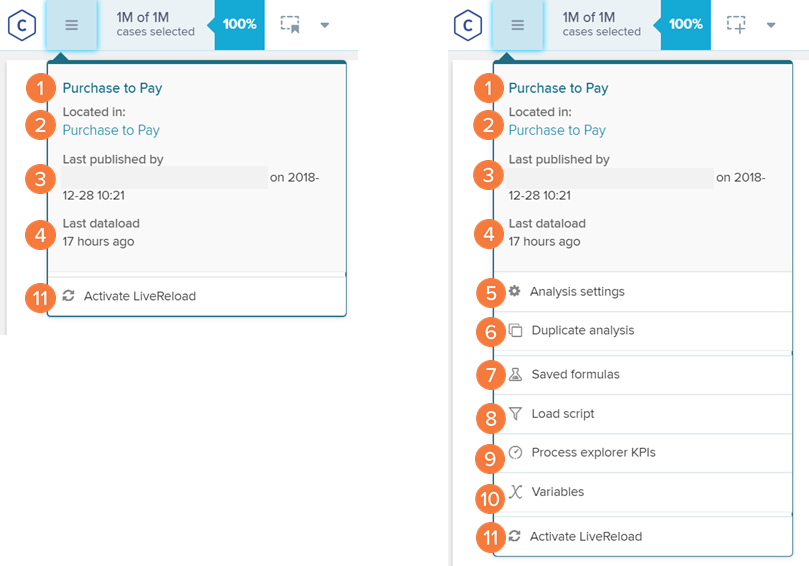
Analysis Name: The unique analysis name is shown here. The name of the analysis can be edited by analysts in workspaces
Location: See the Workspace where the currently opened analysis is located. By clicking you can go to the corresponding workspace.
Last published: This information shows you which user last published a new version of the analysis and when this version was published. Only analysts can publish analyses.
Last data load: Here you get shown when the last data load was executed.
Analysis Settings: Analysis Settings open the settings for the analysis.
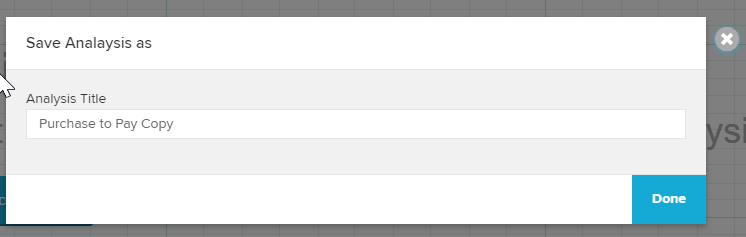
Duplicate Analysis: An analysis can be saved with a new name. By default the analysis name + Copy (e.g. Purchase to Pay Copy) is generated. Once the analysis is saved the user gets automatically forwarded to the new analysis. The analysis is saved in the same workspace as the original analysis.
Saved Formulas: Saved formulas are a useful tool to save PQL statements. The saved formulas may be also be used by other analysts in the analysis.
Load Scripts: Load Scripts are scripts that automatically run when the analysis is loaded. With them, you are able to assure, for example, that your analysis always begins with a certain filter applied or with a selector option displayed.
Process Explorer KPIs: Process Explorer KPIs are used in the Process Explorer component to modify the metrics calculated and displayed in it.
Variables: PQL statements can be saved as variables and re-used in different parts of your analysis.
Activate LiveReload: This option will switch in a live refresh session. The analysis session will be refreshed each 30s (can be changed in the URL) and updated to the new data. New data points are automatically shown in the charts and visualizations.
Important
This does not automatically reload your data but rather displays the newest content of your Data Model. If the Data Model does not change, no new data will be shown.