Creating benchmarks in Views
Benchmarking involves comparing key metrics or practices from different units, product lines, departments, programs, geographies, etc. By benchmarking your processes, you can identify areas for improvement and enhance your overall efficiency.
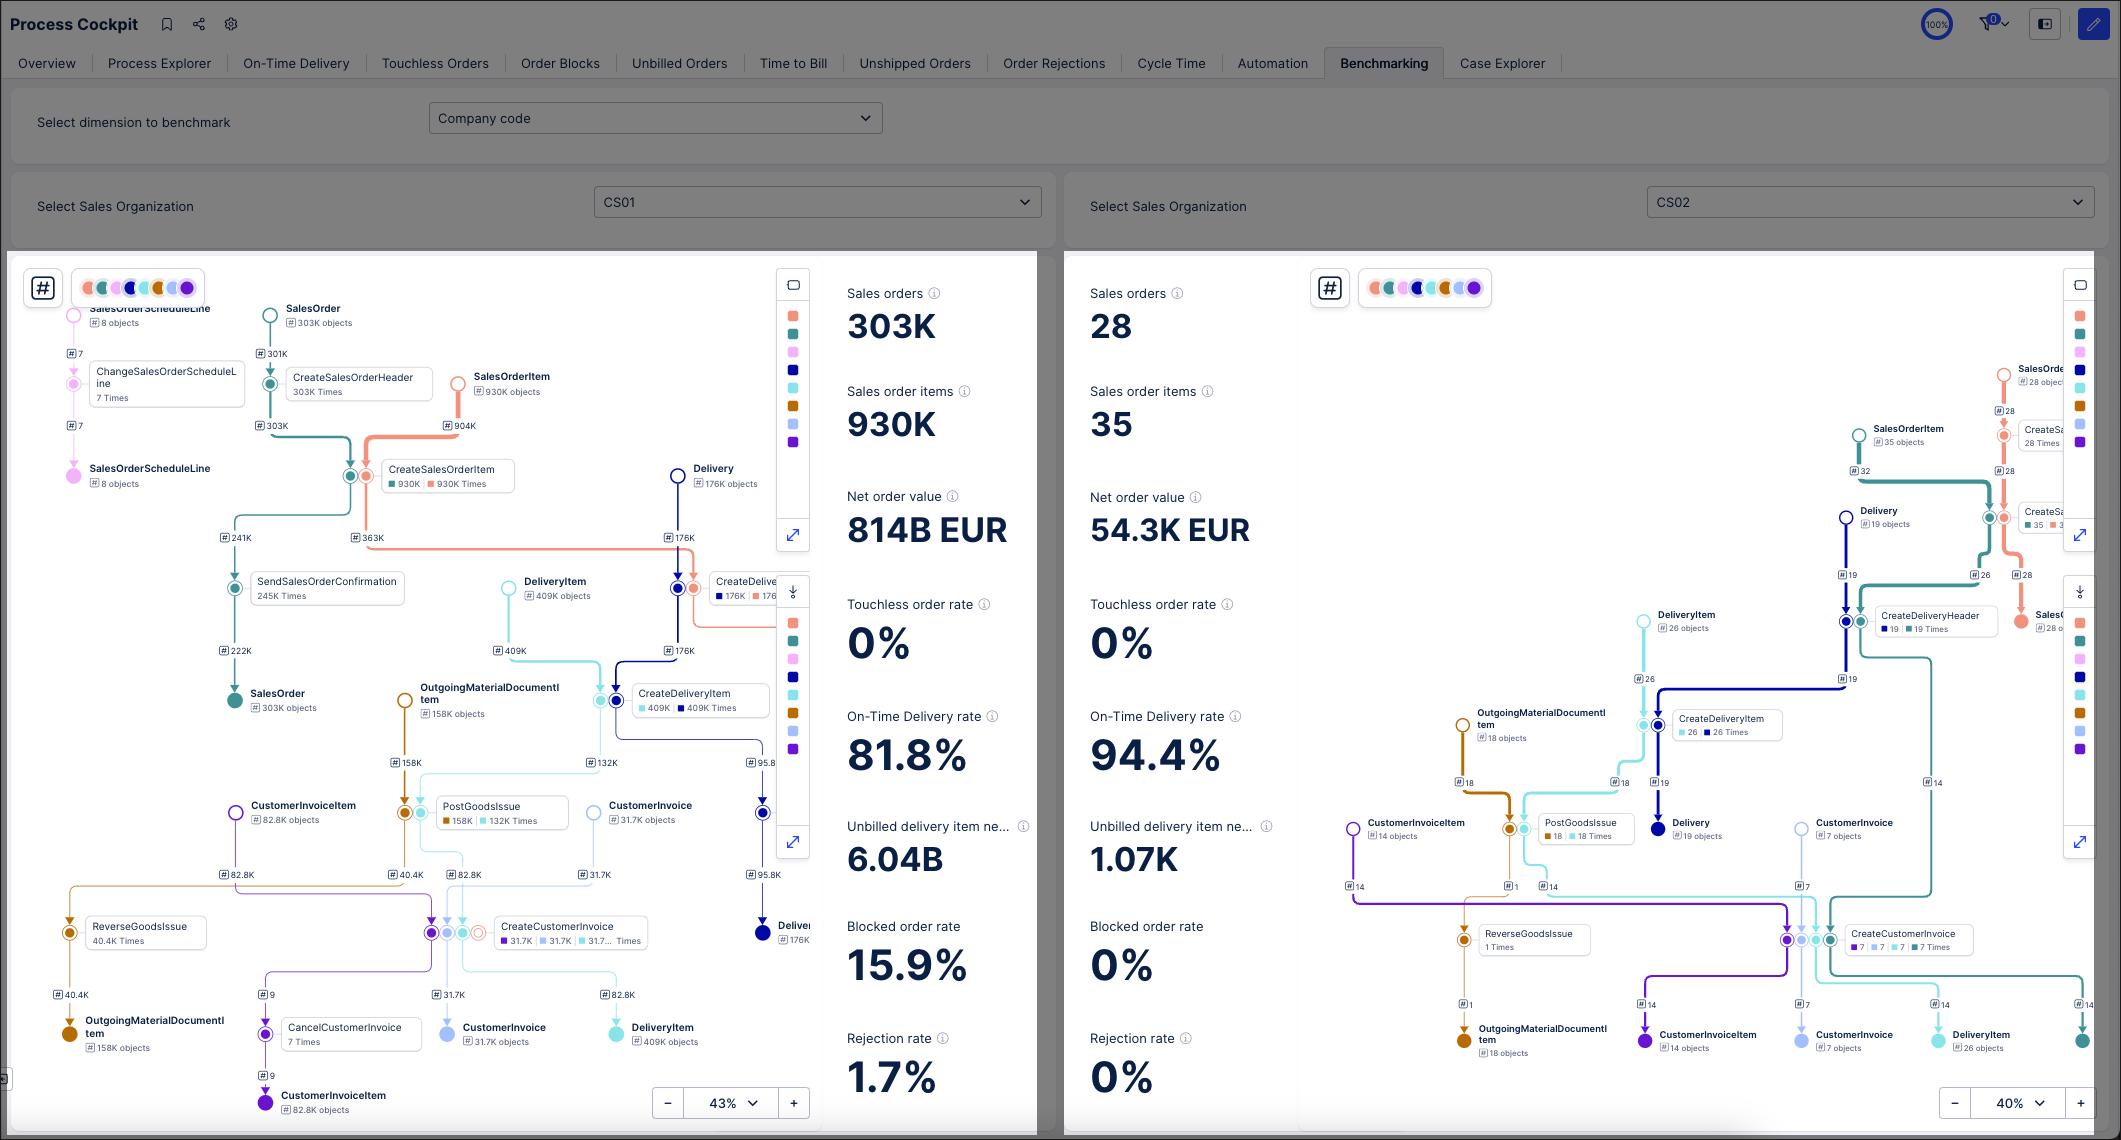
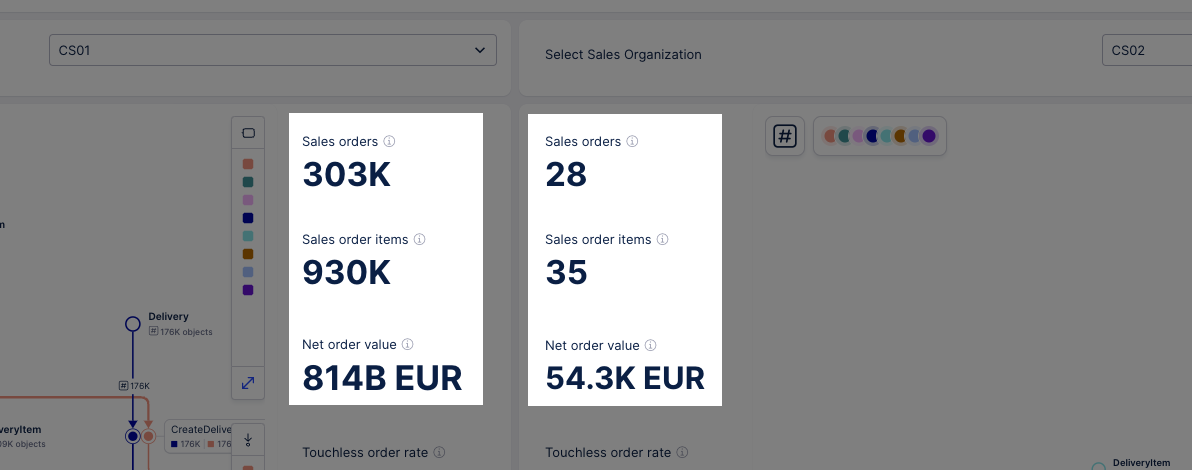
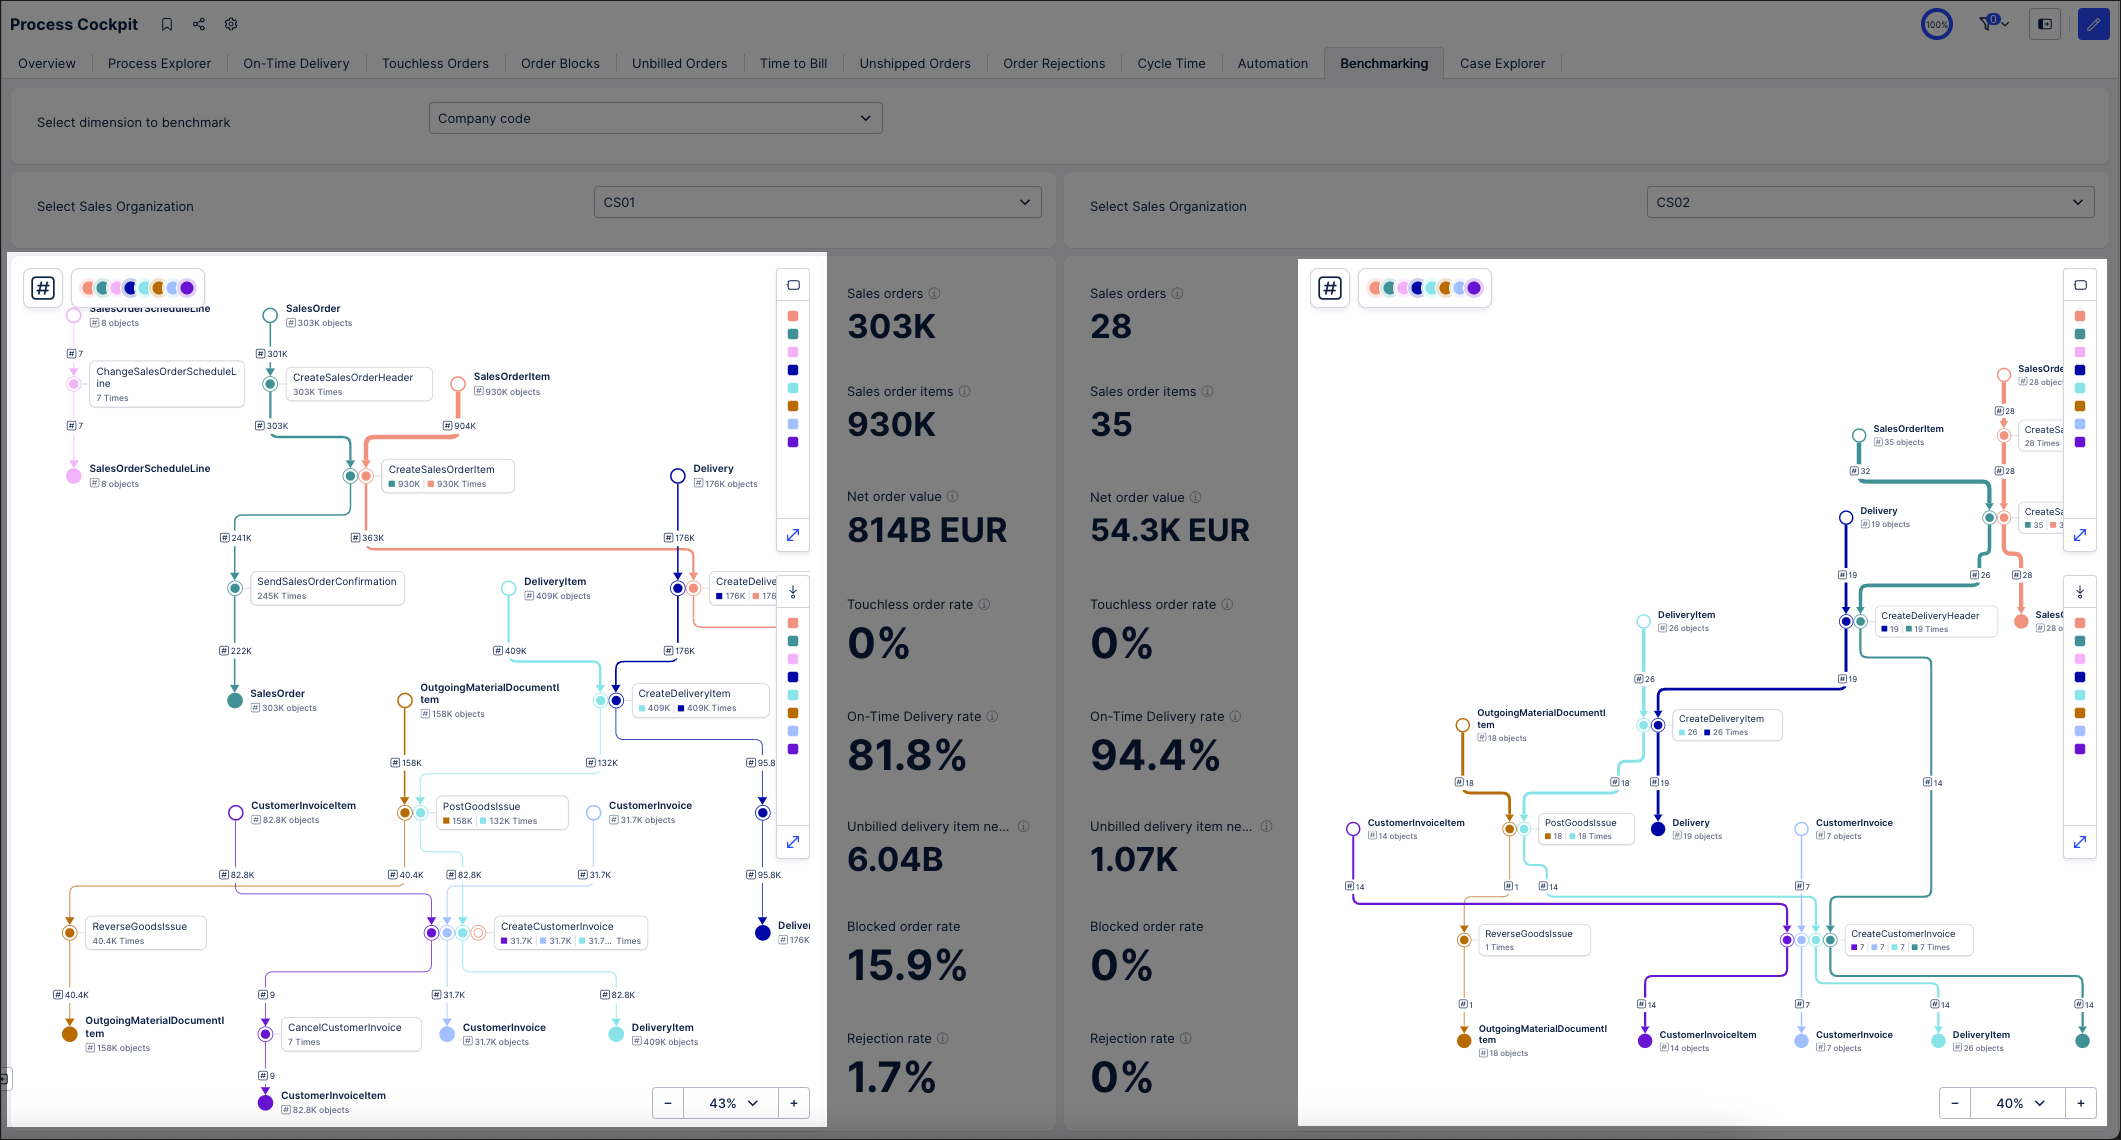
In the following example, we are using a tabbed View to benchmark the performance of two example sales organizations (CS01 and CS02).
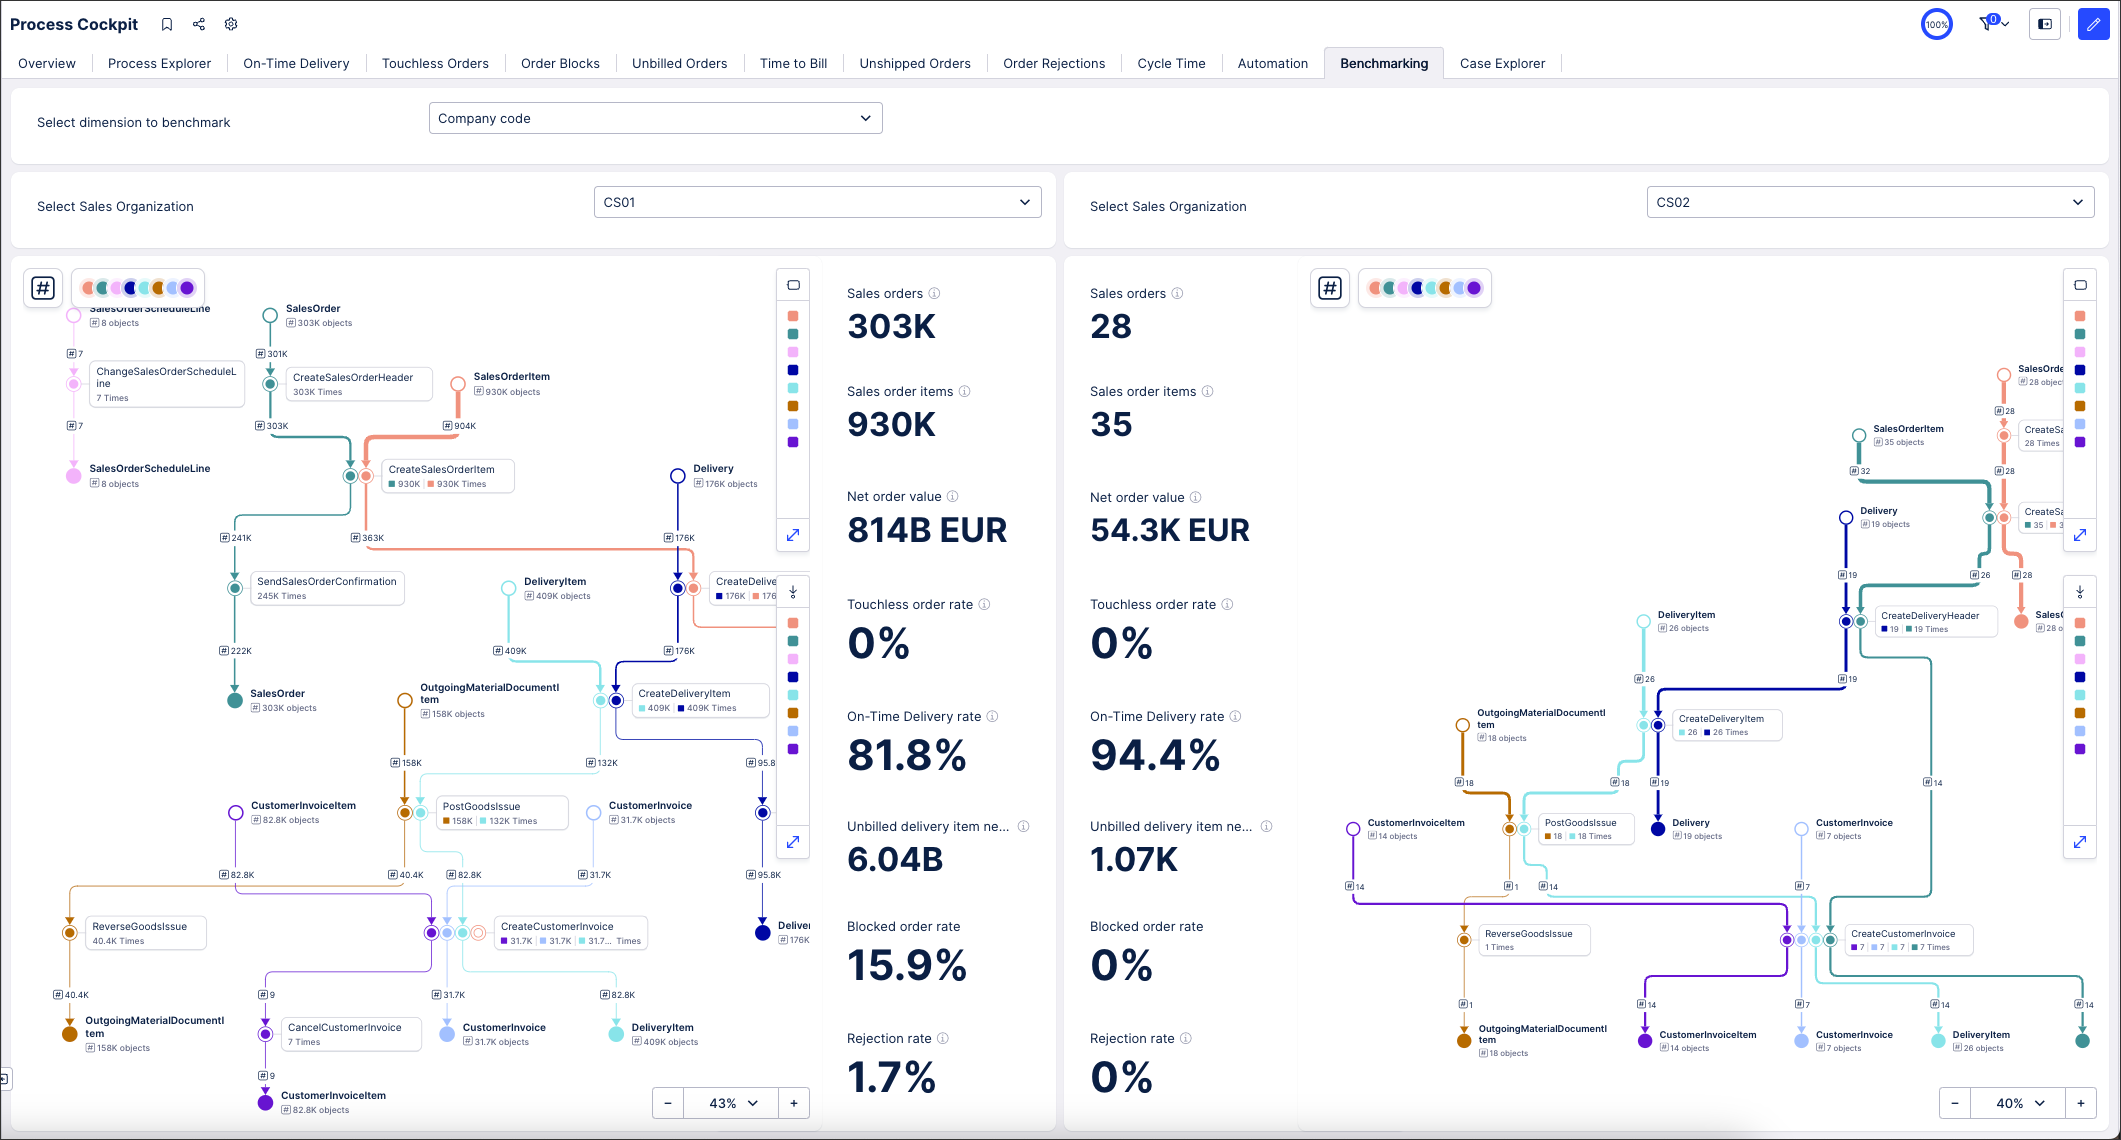 |
This benchmark can be changed using the dimension dropdown, allowing us to benchmark against other dimensions such as plants, materials, and distribution channels.
 |
To create this benchmark, we've used the following View features and components:
In the following sections, we'll break down each component and show you how they've been configured for this example. When creating your own benchmarks, you can choose your own style and use different components as required.
Before creating our benchmark, we created a number of enhanced View and Knowledge Model variables to use within our View components. These variables act as placeholders for information, either based on dynamically inserted context (such as company names, countries, and sales orders) or with manual input by the app user (such as entering the cost of an item).
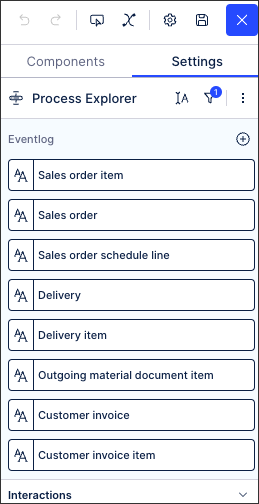
Enhanced variables can be viewed and accessed from the Variables menu:
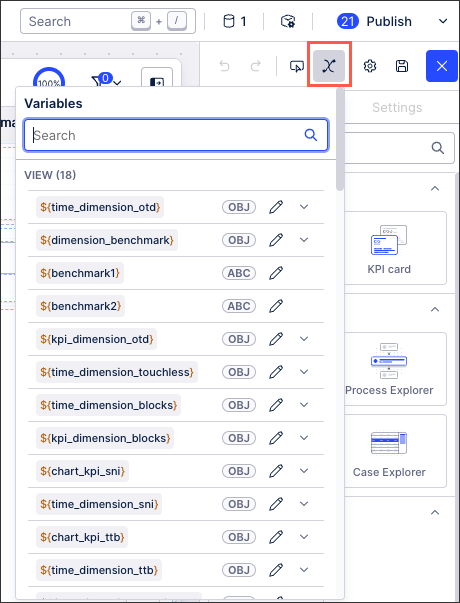 |
They can also be inserted into components, such as in the input dropdown and text box examples in the following sections.
For an overview of enhanced variables, see: Enhanced variables.
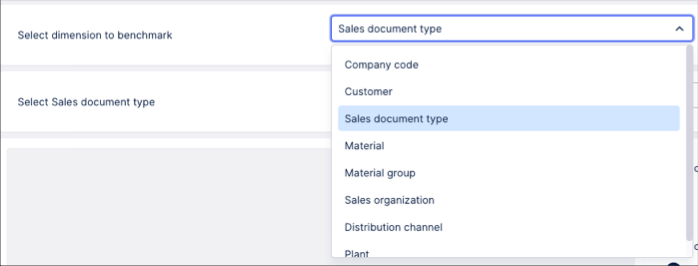
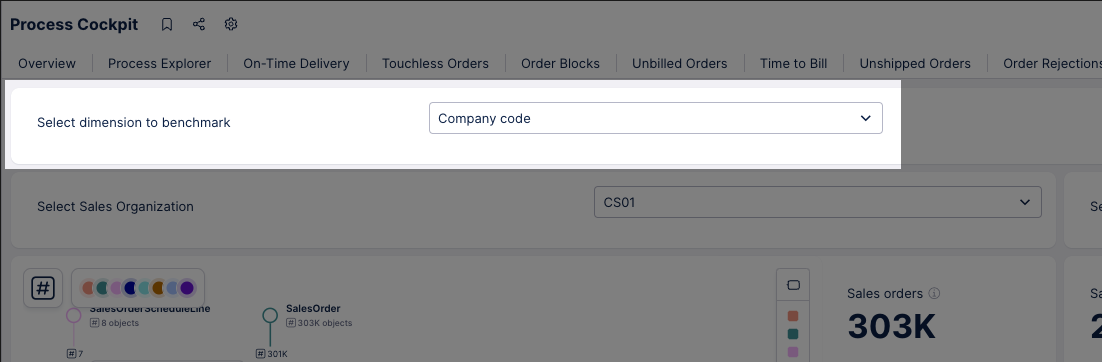
To allow users to benchmark based on a number of dimensions, we've used an input dropdown where the users selection is saved as a variable. This variable can then be inserted into other components, dynamically updating the options available to the user.
In our example, the user has selected 'Company code' (which is configured to display all sales organizations):
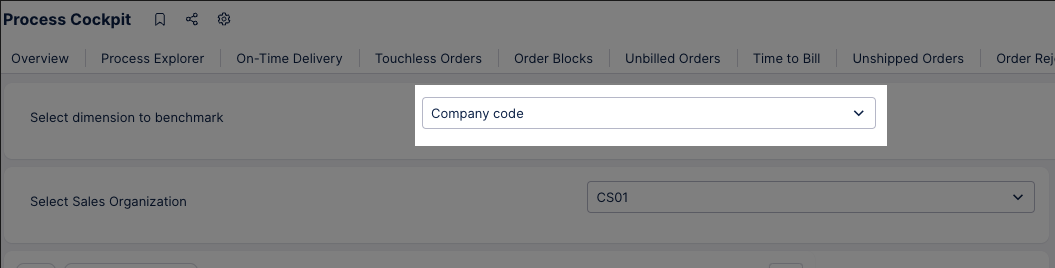 |
To configure this, we have used manual inputs (such as 'Company code' and 'Customer') that are based on selections we've made in our PQL editor. We are then saving the option the user selects as a variable (in this example, it's 'dimension_benchmark').
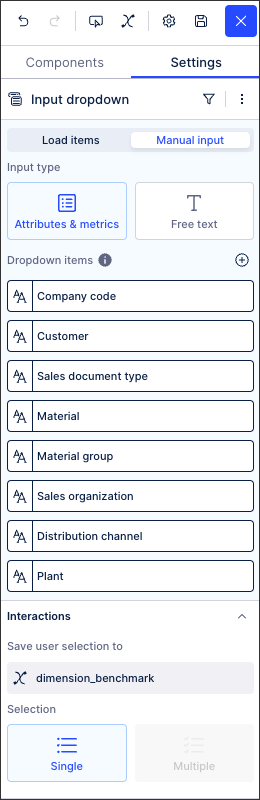 |
To learn more about configuring input dropdowns with manual inputs, see: Input dropdown.
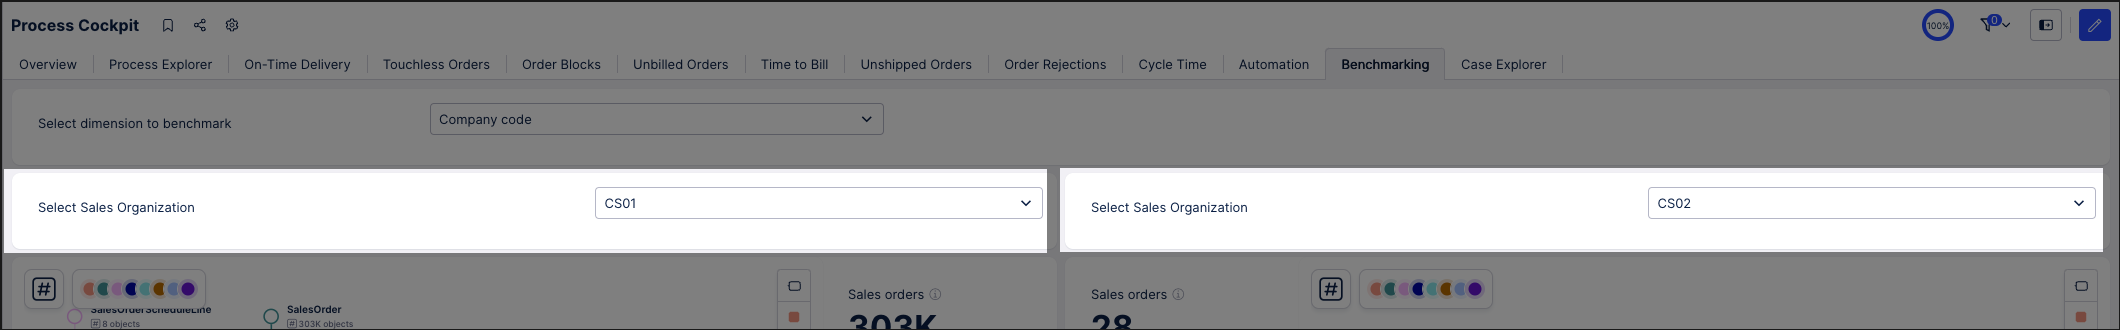
When the user selects the dimension from the dropdown, we then want to give them the ability to select from the metrics associated with that dimension.
In our example, our users can select from the available 'Sales Organizations' (such as CS01 and CS02):
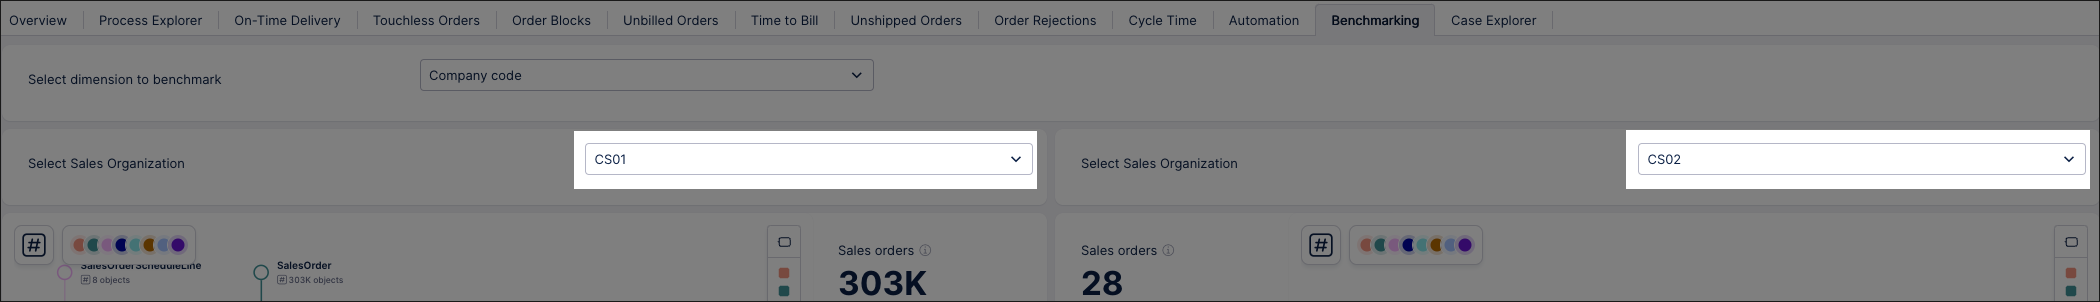 |
To configure this, we've used two input dropdown where the options are loaded from the 'dimension_benchmark' variable that the user selected. The users selection in this dropdown are then also saved as variables for us to use in the subsequent components.
The left input dropdown is saved as 'benchmark1':
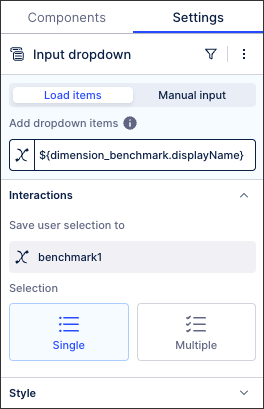 |
And the right input dropdown is saved as 'benchmark2'
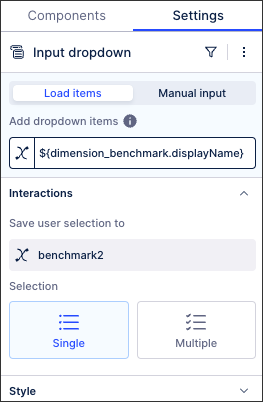 |
To learn more about configuring input dropdowns with loaded inputs, see: Input dropdown.
In our example, we use three text boxes. One of them is a plain text box ('Select dimension to benchmark'), whereas the other two use an enhanced variable to dynamically change the text (in this example, 'Select Sales Organization') for each side of the benchmark.
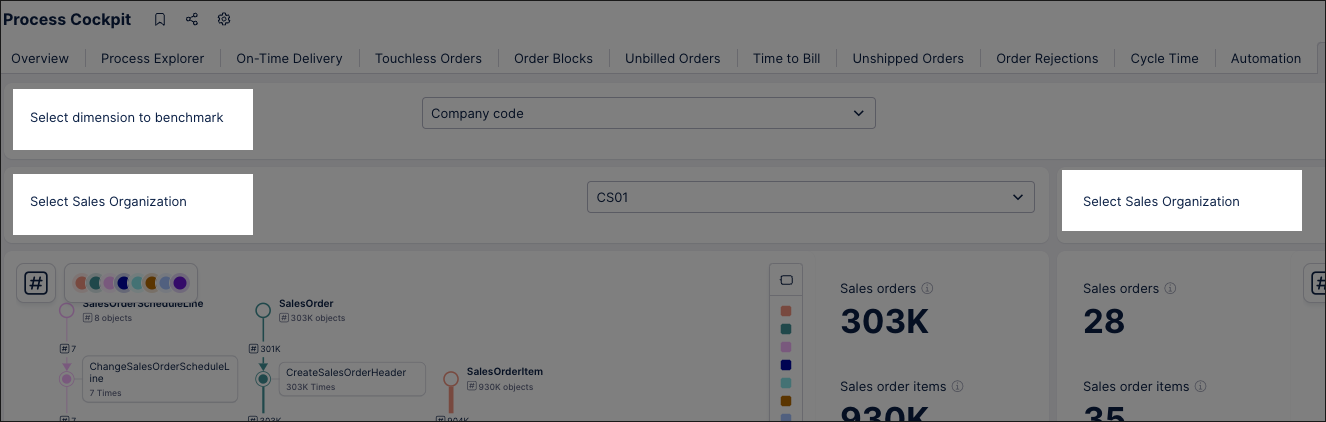 |
If we start by looking at the plain text box, this is a label informing the user that they should select a dimension from the dropdown. As such, the configuration is just text on a white background:
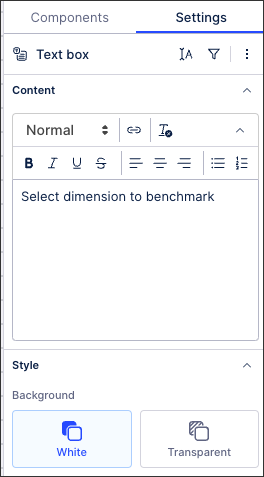 |
The other two text boxes are configured to display the name of benchmark dimension that the user selects (using the input dropdown described in the earlier section). As such, the configuration includes both plain text (Select) and the enhanced variable we're saving the user input to (dimension_benchmark.displayName):
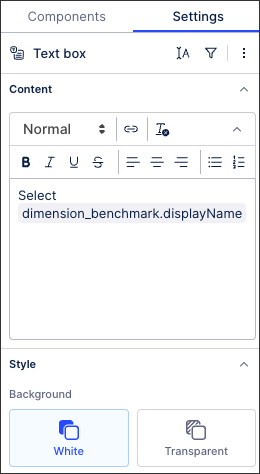 |
We now need to configure the benchmarking metrics themselves, some of which we've configured using KPI lists.
In our example, when the user selects the sales organizations (CS01 and CS02) they are then shown metrics such as Sales Orders, Sales Order Items, and the Net Order Value for each organization selected:
 |
To display this information, we have configured individual KPI list components for each metric we want to show. These KPI lists then filter the metric using the variables created from user selections in our Input dropdowns (with options loaded from a variable) example.
If we take 'Sales orders' as an example, we have configured both the left and right KPI lists to used a filtered sales order PQL statement. The component configuration looks like this:
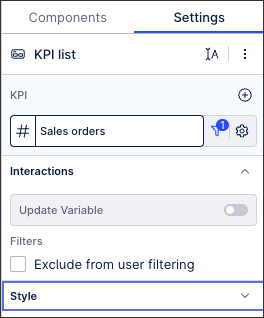 |
And then clicking into the PQL editor, the statements we've used for the left side are based on the variable 'benchmark1' (which in this case is CS01):
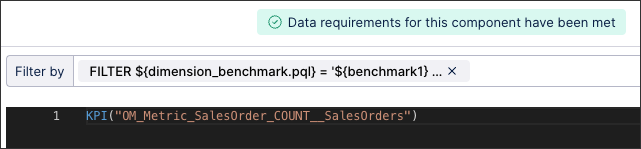 |
And the statement we've used for the right side are based on the variable 'benchmark2' (which in this case is CS01):
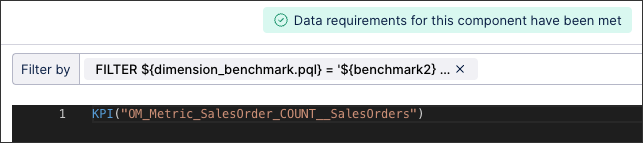 |
We've then repeated this for each KPI list we want to show, ensuring that the components on the left are configured using the variable 'benchmark1' and those on the right use 'benchmark2'.
Another way we've visualized our benchmarking is to use the Process Explorer component. The Process Explorer component allows you to add a visual overview of a selected business process to your Studio view, with the most frequent process activities and connections highlighted. This component uses event logs from your Knowledge Model, allowing the activity table (and related data) from your data to be displayed.
In our example, we have configured a Process Explorer for each side of the benchmark:
 |
For each side of the benchmark, our Process Explorer event logs are configured using a filtered PQL statement.
For example, the left side references 'benchmark1':
FILTER ${dimension_benchmark.pql} = '${benchmark1}'And the right side references 'benchmark2':
FILTER ${dimension_benchmark.pql} = '${benchmark2}'These allow us to visualize event logs such as 'Sales order item' and 'Delivery item':
 |
For more information, see Configuring Process Explorer in Views.
And finally, we've used five white containers in our View to help us visually combine components together.
The containers have been used to combine the following components (all of which were configured in the earlier sections):
Container 1: This combines the plain text box and the input dropdown using manual inputs.
Containers 2 and 3: These both combine the dynamic text box and the input dropdowns using loaded inputs, one for each side of the benchmark.
Containers 4 and 5: These both combine the Process Explorer and the KPI lists, again for each side of the benchmark.