Knowledge Input for your Process Copilot
The Knowledge Input section of the Configuration screen is used to select the relevant metrics, attributes and event logs that this Process Copilot will have access to when generating responses.
Selecting the knowledge used by your Process Copilot
Use the sections below to choose the specific metrics, attributes, and event logs made available to your Process Copilot.
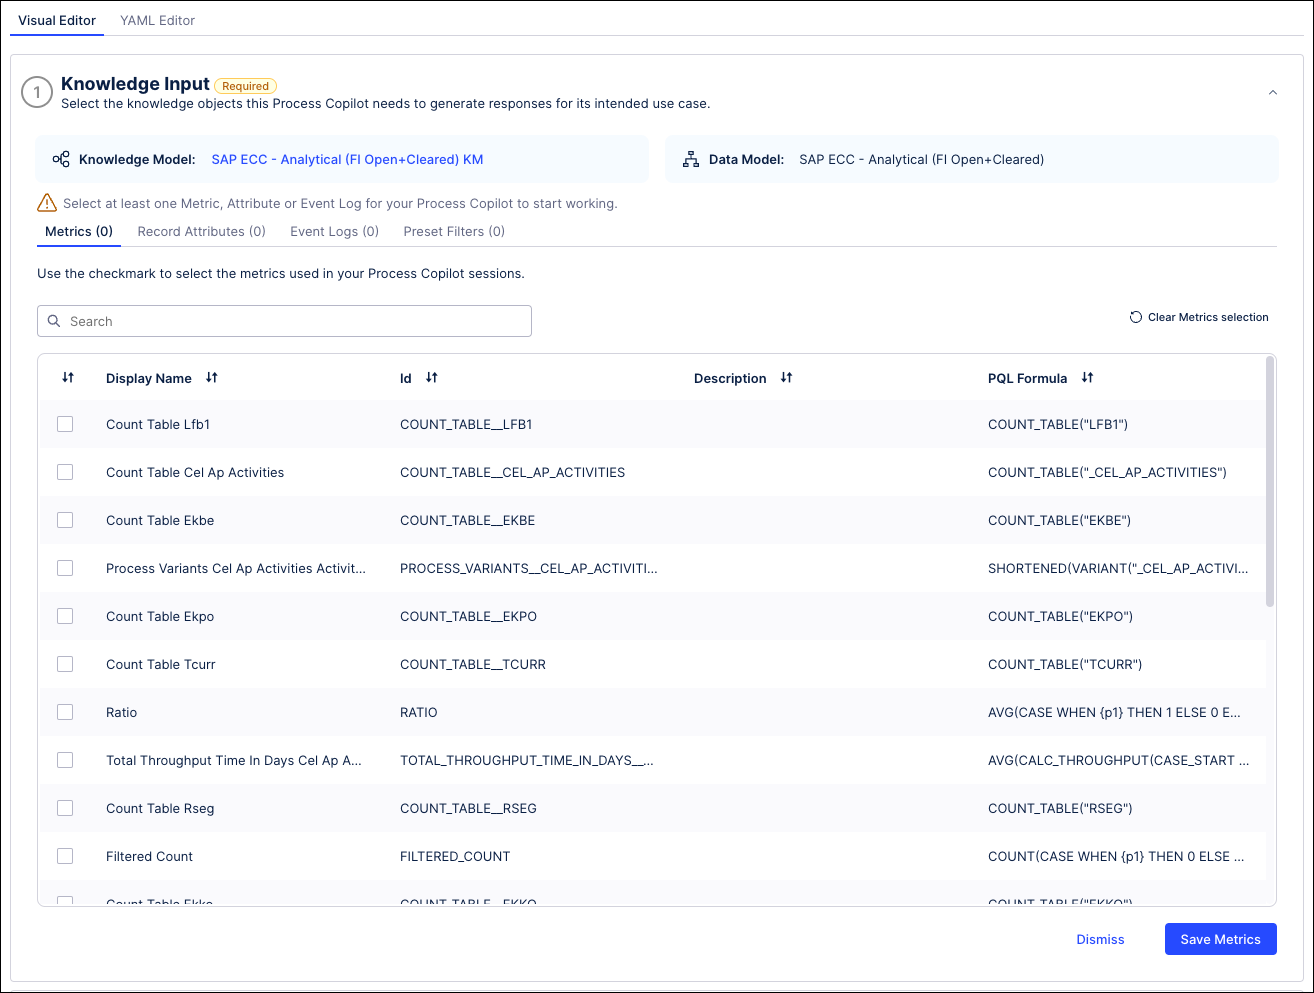
The Metrics tab shows the individual KPIs within the Knowledge Model that can be used with this Process Copilot. For each KPI, you can see the name and ID of the KPI, as well as the description.
Note
The metrics selected on this screen are also used to create the default questions shown on the start screen when accessing this Process Copilot.
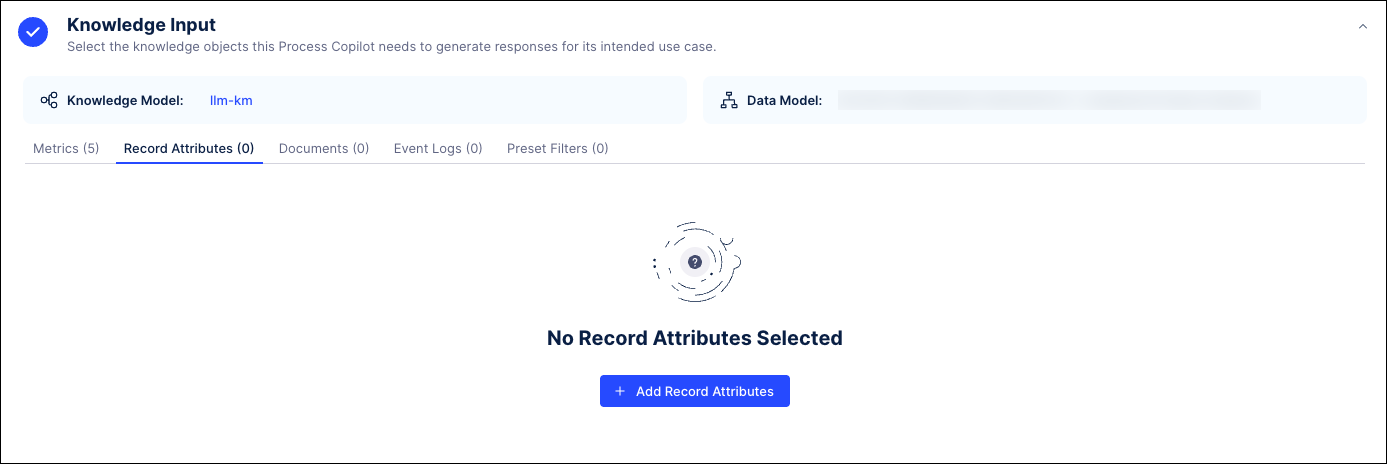
Click the Knowledge Input section to expand it.
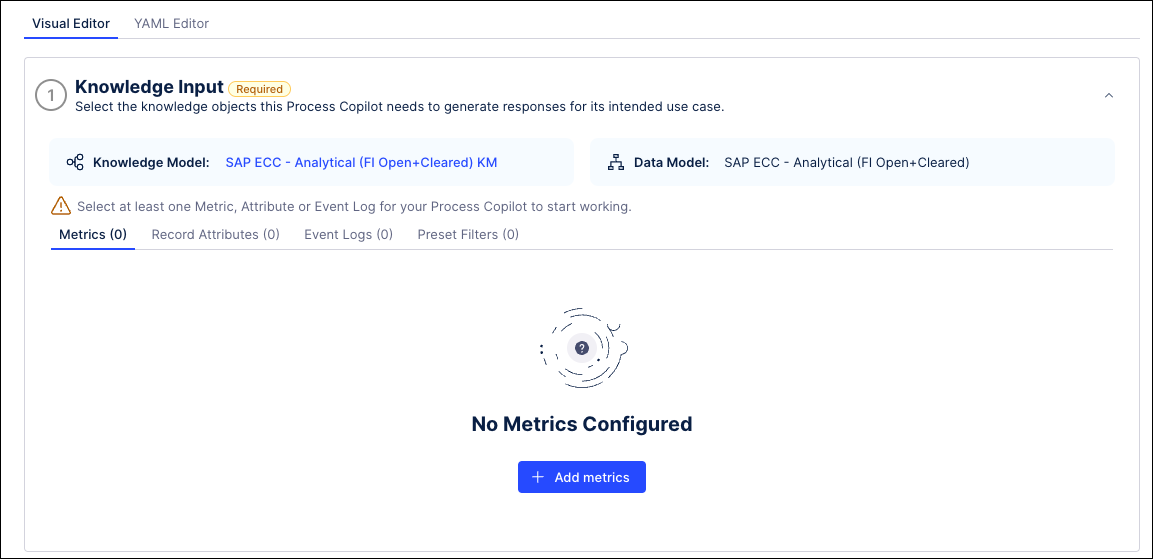
On the Metrics tab, click the Add Metrics button.
From the list, use the checkboxes to select which metrics you want this Process Copilot to have access to when generating responses.
Caution
Select only key KPIs that are truly relevant for the use case you are building. We recommend starting with no more than 5 to 6 KPIs for your first iteration. Once you have a working end-to-end implementation, you can expand the scope by selecting more KPIs.
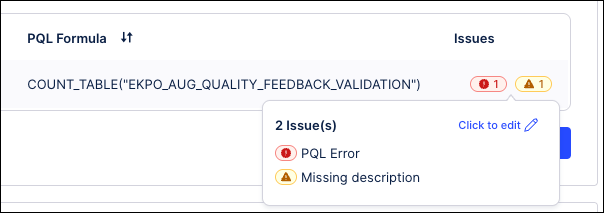
If any of the selected metrics have error or warning icons in the Issues column, hover over the icon to see a description of the problem and then select the "Click to edit" link to update the issue directly in the Knowledge Model.
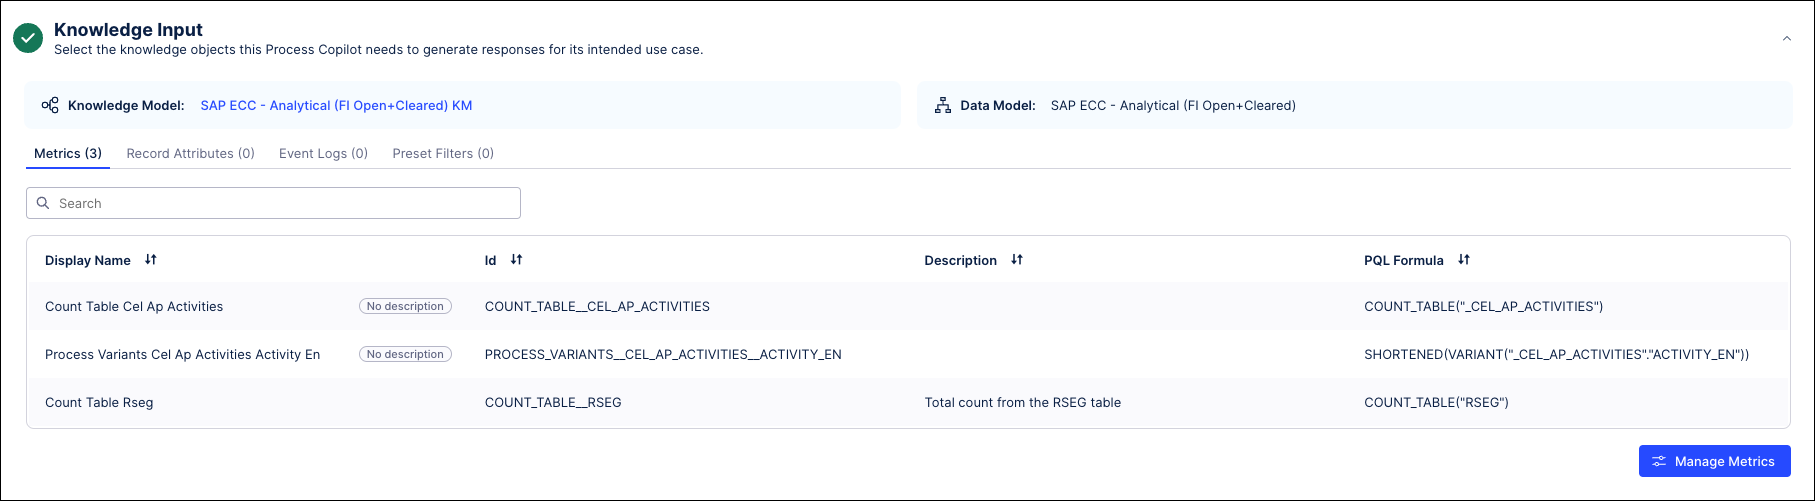
Click Save Metrics. The heading of the Metrics tab is updated to show the number of selected metrics.
To make changes to the selected list of metrics, click the Manage Metrics button at the bottom of the section to add or remove metrics.
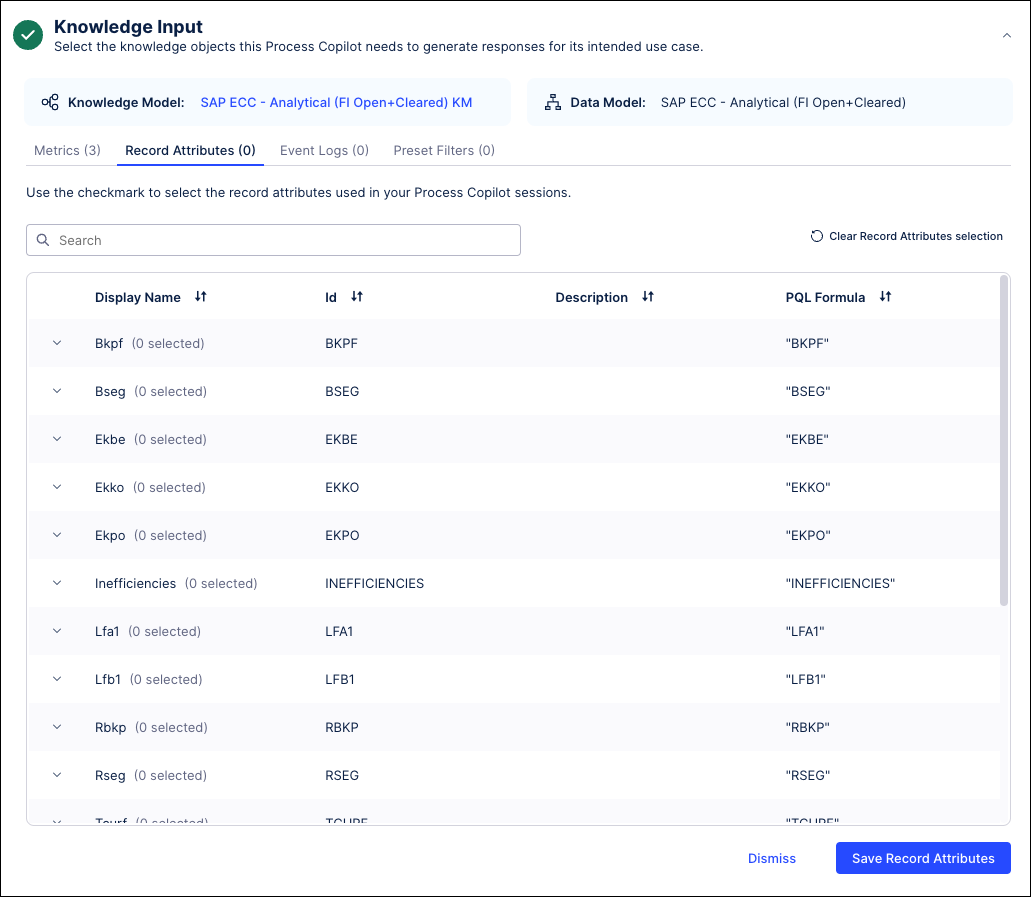
The Record Attribute tab shows the individual attributes that have been made available to this Process Copilot.
Click the Record Attributes tab.
Click the Add Record Attributes button.
From the list, use the checkboxes to select which attributes you want this Process Copilot to have access to when generating responses.
Caution
Select only key attributes that are truly relevant for the use case you are building. We recommend starting with no more than 20 attributes for your first iteration. Once you have a working end-to-end implementation, you can expand the scope by selecting more.
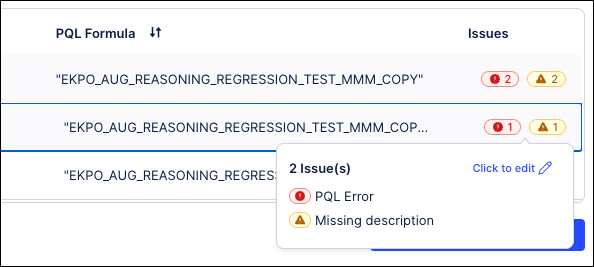
If any of the selected attributes have error or warning icons in the Issues column, hover over the icon to see a description of the problem and then select the "Click to edit" link to update the issue directly in the Knowledge Model.
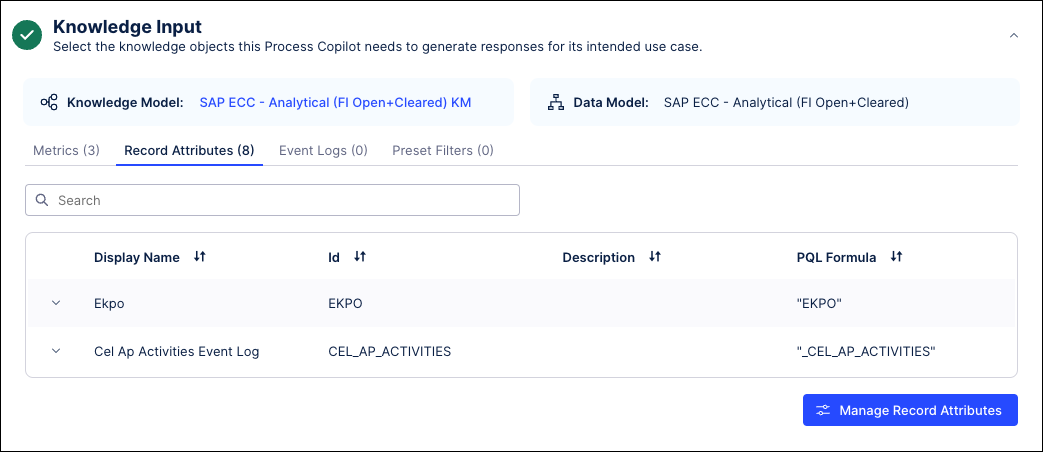
Click Save Record Attributes. The heading of the Record Attributes tab is updated to show the number of selected attributes.
To make changes to the selected list of attributes, click the Manage Record Attributes button at the bottom of the screen to add or remove attributes.
The Event Logs tab shows the specific logs used by this Process Copilot to generate responses. Click the Add event logs button to select one or more event logs from your Knowledge Model.
Caution
Only add an event log to your Process Copilot if it is essential for your use case.
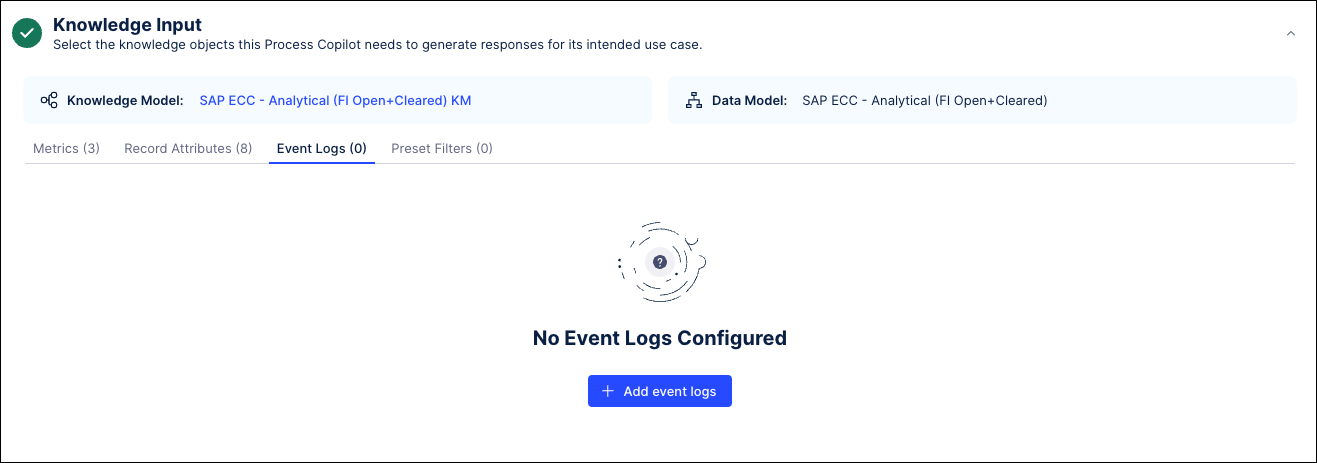
Click the Event Logs tab.
Click the Add Event Logs button.
From the list, use the checkboxes to select which attributes you want this Process Copilot to have access to when generating responses.
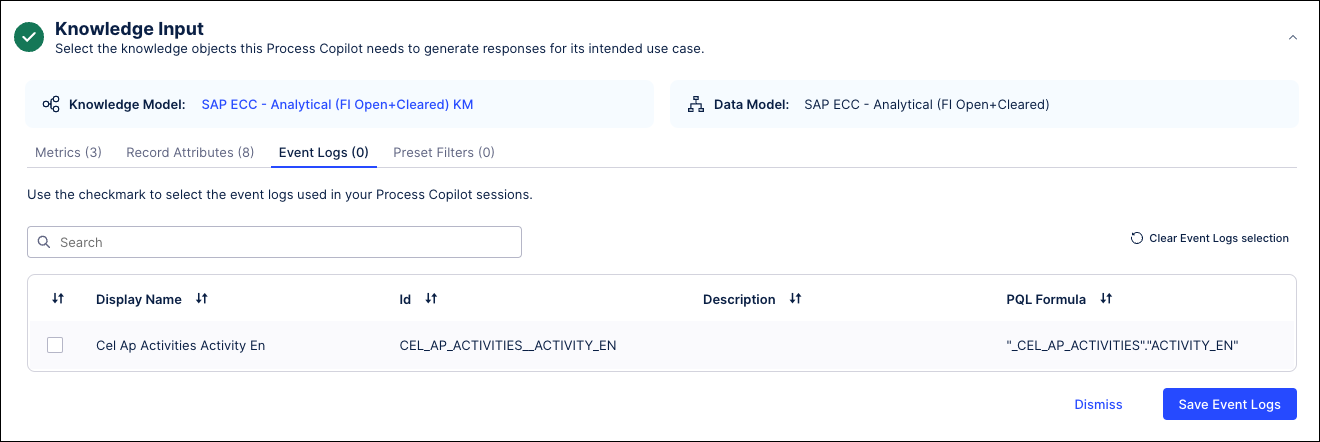
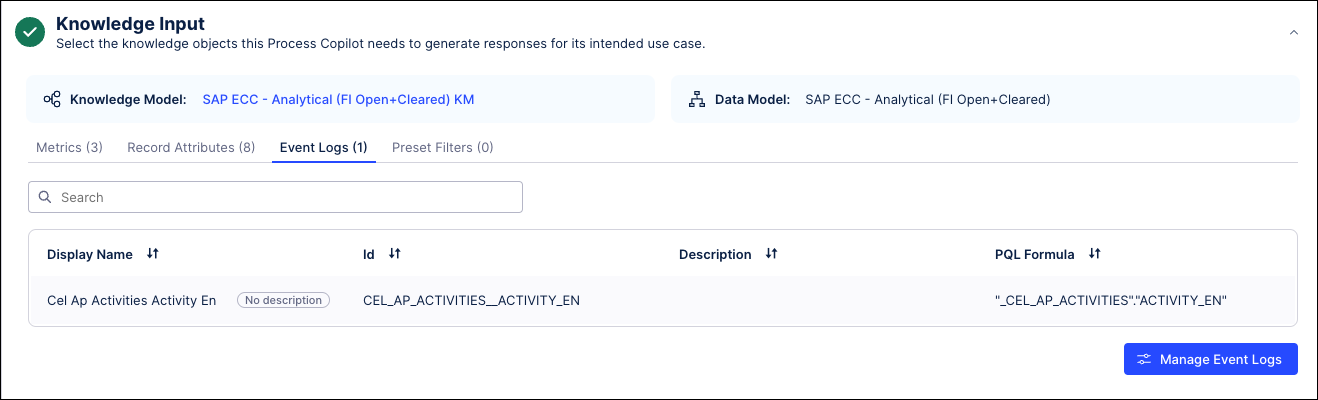
Click Save Event Logs. The heading of the Event Logs tab is updated to show the number of selected logs.
To make changes to the selected list of event logs, click the Manage Event Logs button at the bottom of the screen to add or remove logs.
Once you have finished selecting the knowledge objects you want to give this Process Copilot to have access to, you can move on to the Tool Activation section and add any tools the Process Copilot will need to use for its intended task.
When you open Knowledge Input section of your Process Copilot configuration, you may see error and warning icons on the Metrics and Record Attributes tabs. These icons are the result of an automated check designed to assess if the content meets the basic requirements for Process Copilot's capabilities.
These issues have different levels of severity:
An error indicates a critical issue. The impacted metric or attribute cannot be added to the configuration.
A warning indicates a non-critical issue or default assumption the system makes. The impacted metric or attribute can be added to the configuration, but addressing the warning is recommended for optimal results.
To see the cause of these errors and warnings, hover over the icon in the Issues column to view a description of the problem. Select the "Click to edit" link in the hover window to access the associated metric or attribute record in the Knowledge Model. If multiple metrics or attributes have issues, you may need to expand the top level to view the individual issues. Once the problem has been resolved in the Knowledge Model record, the error and warning icons will no longer display.