Process-level KPIs
Results
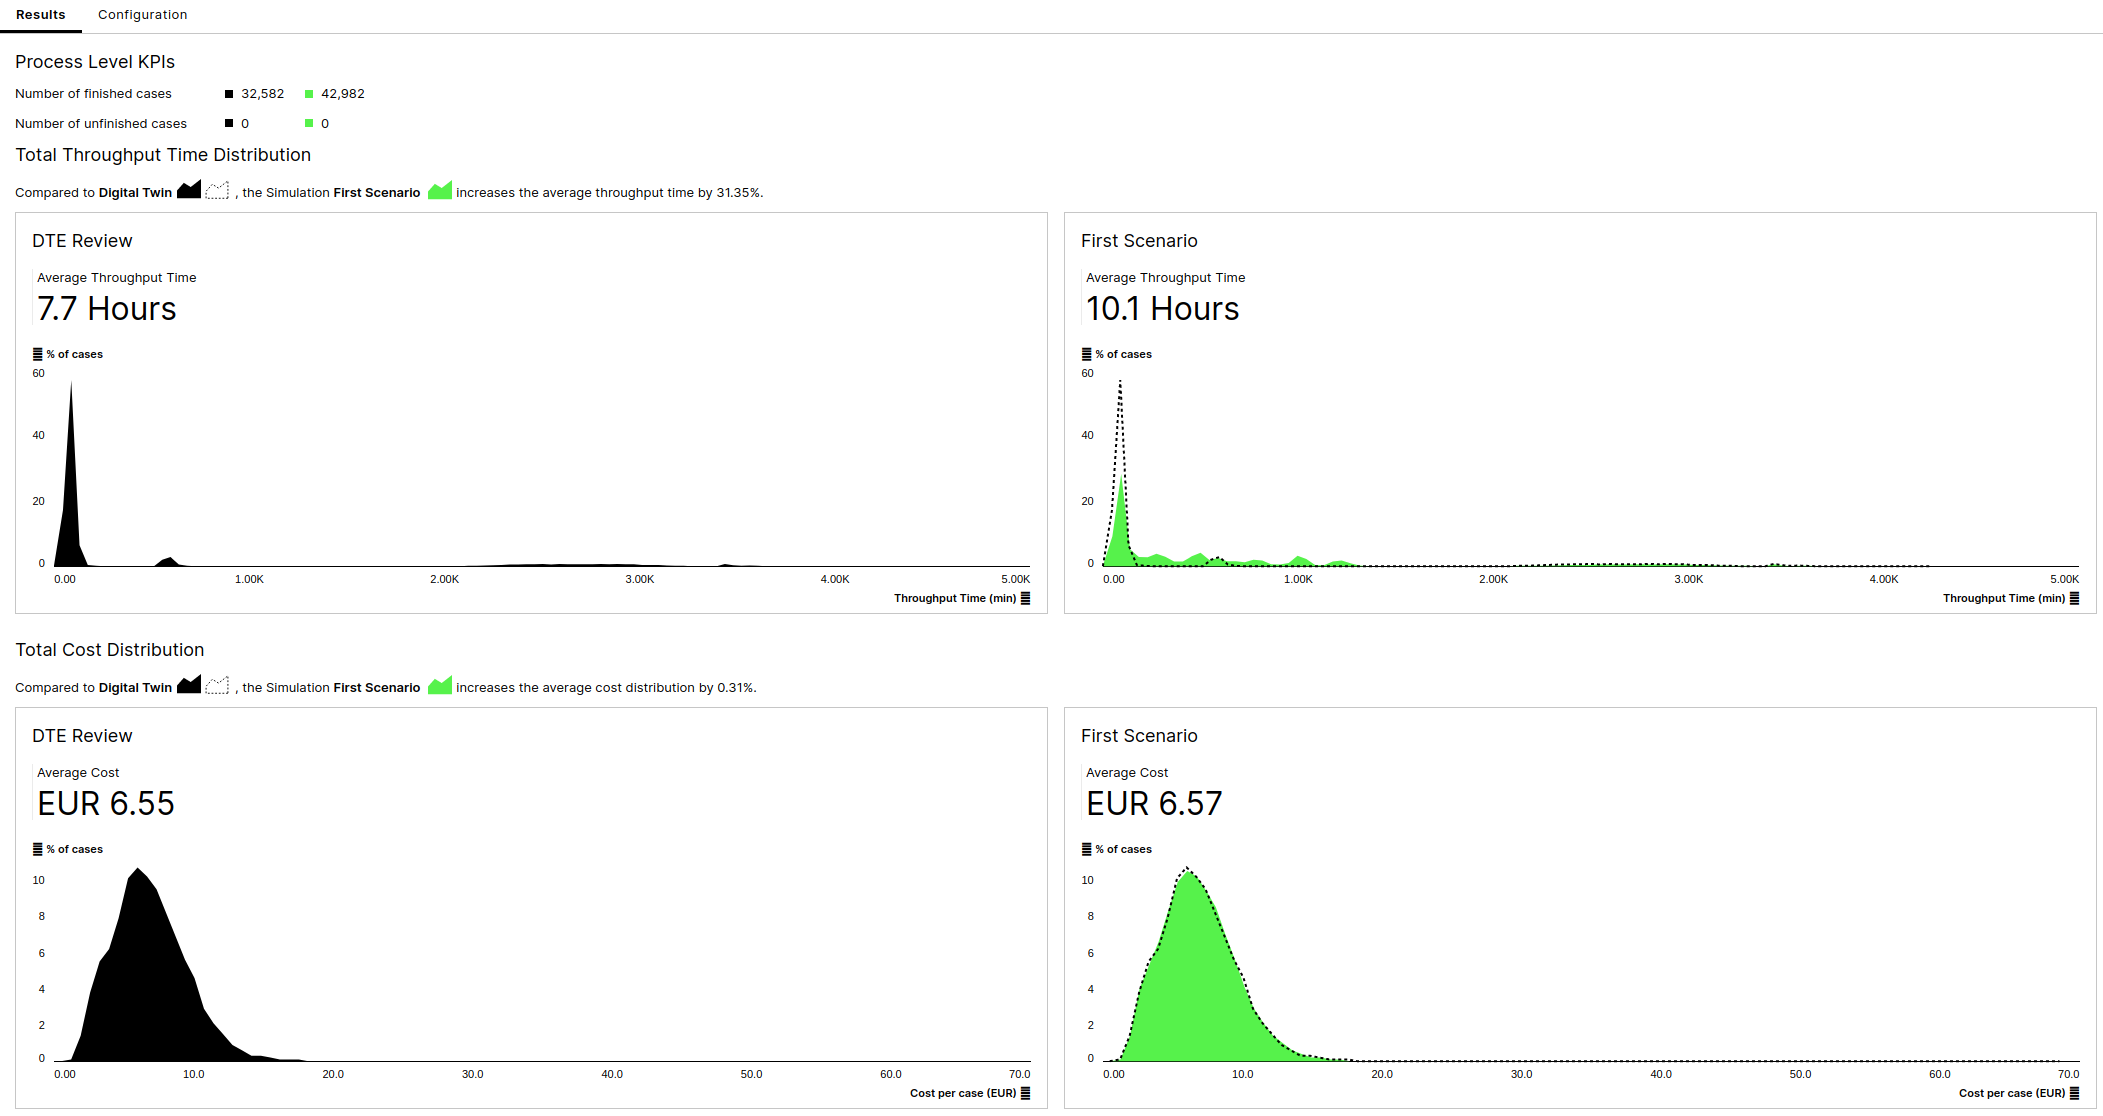 |
Number of Cases
The first KPI to see are the number of finished and unfinished cases that where created in the process during the simulation duration. This KPI is useful for both understanding the input quantity of cases to the system and how many cases the process can manage finishing over a time period, but also for interprating the KPIs that follow, many of which are aggregated over the finished cases only.
Throughput Time
The Throughput Time of all finished cases displayed on average and on a frequency graph.
Cost
The Cost of all finished cases displayed on average and on a frequency graph. The Cost is calculated based on the time the resources were actively processing a case multiplied by the FTE cost per hour.