October 2025 Release Notes
October 27, 2025
PRIVATE PREVIEW PI GRAPH Coherent Versioning and Deployments now available in Private Preview
Both the Studio and Objects and Events modules are getting upgraded with new versioning and deployment functionality that provides a content management solution for your releases. This feature will offer the ability to create new versions of your packages, track and compare previous versions, deploy specific versions, and rollback changes to previous releases.
This content versioning feature will be used to create and manage versions of your packages, which allows multiple engineers to work on different implementations simultaneously. You can select which assets to include in each version, compare versions to see how assets change, and maintain your drafts until that version is ready for release.
The new deployment feature will allow you to track your release history, retain previous versions and revert back to an earlier release when necessary. For failed releases, you will be able to troubleshoot the errors that occurred and make any required changes before republishing.
October 24, 2025
IMPROVED ORCHESTRATION ENGINE Input mapping and Annotation Builder
We're excited to announce a fast follow-up to our initial launch, bringing handy new capabilities to enhance your Process Orchestrations:
Direct Input/Output Mapping for Action Flows: To empower all users to effortlessly build, configure, and manage complex business processes with Orchestration Engine, we’re introducing an intuitive, no-code UI for data input and output mapping. Input/Output mapping ensures that accurate data is passed between all automated steps. Right now, you can map Action Flow inputs and outputs directly within the Orchestration Engine step to streamline your workflow configuration.
Annotation Builder integration (Private Preview release): this AI-enhanced Studio asset processes your data and generates informed guidelines based on your specific instructions. You can use the Annotation Builder logic as a starting point for your new automations. This can be helpful with, for example, dynamically routing workflows and automatically triggering correct further actions.
NEW STUDIO Live Insights in Insight Explorer
Insights are no longer static snapshots from the last analysis run. All insights in Insight Explorer are now live-computed, meaning they are always calculated using the most current data and Knowledge Model definitions at the moment you view them.
October 22, 2025
NEW AUTOMATION Orchestration Engine
Introducing Orchestration Engine (OE), a new Celonis Platform tool designed to help you optimize your company’s business operations based on real-time, end-to-end process intelligence. OE lets you organize digital actions into workflows (Process Orchestrations) where they can be easily planned, managed, and executed. By using real-time internal and customer data, you can adjust these workflows dynamically for maximum efficiency.
October 21, 2025
NEW STUDIO Insight Explorer in Apps
You can now access Insight Explorer in the Apps module as a non-Analyst Celonis user. As an Analyst, you can publish Insight Explorer like any other Studio asset. Insights can be discovered independently by users in both Studio and Apps, while bookmarked insights are synced between Studio and Apps to allow for collaboration and consistent findings. Opening the insights details page is also available in Apps, but exporting as views and editing the configuration remain Studio-only actions.
October 15, 2025
PRIVATE PREVIEW DATA INTEGRATION Enabling email alerts for scheduled data jobs
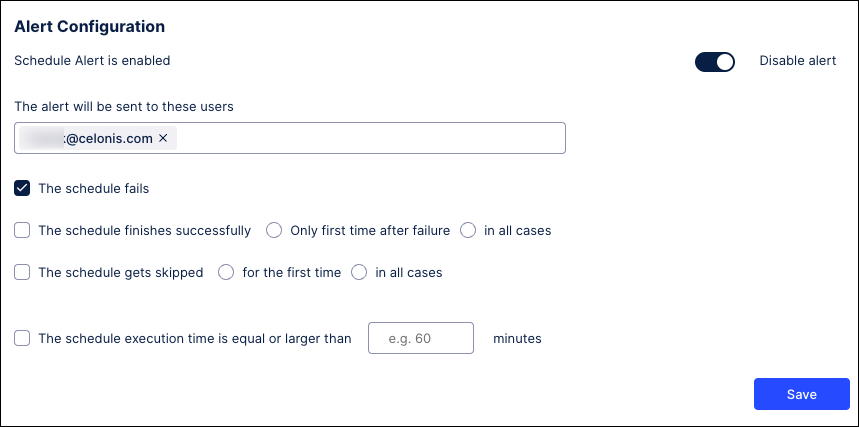
You can now enable email alerts for both data jobs and scheduled data jobs, keeping you informed about the status of your data in the Celonis Platform.
Alerts can be configured for the following events:
Schedule fails: Whenever a data job schedule fails, send an email notification.
Schedule finishes successfully: When a data job schedule runs successfully, send an email notification for either the first time after a previous failure or in all cases.
Schedule gets skipped: When a data job schedule is skipped for either the first time or in all cases, send an email notification.
Schedule execution time: Send an email when a data job schedule execution time equals or exceeds the number of minutes entered.
For more information about scheduling the execution of data jobs, see: Scheduling the execution of data jobs.
And to learn more about configuring data job alerts, see: Enabling data job and data job schedule alerts.
October 14, 2025
PRIVATE PREVIEW STUDIO Optimize your Views with the AI View feedback tool
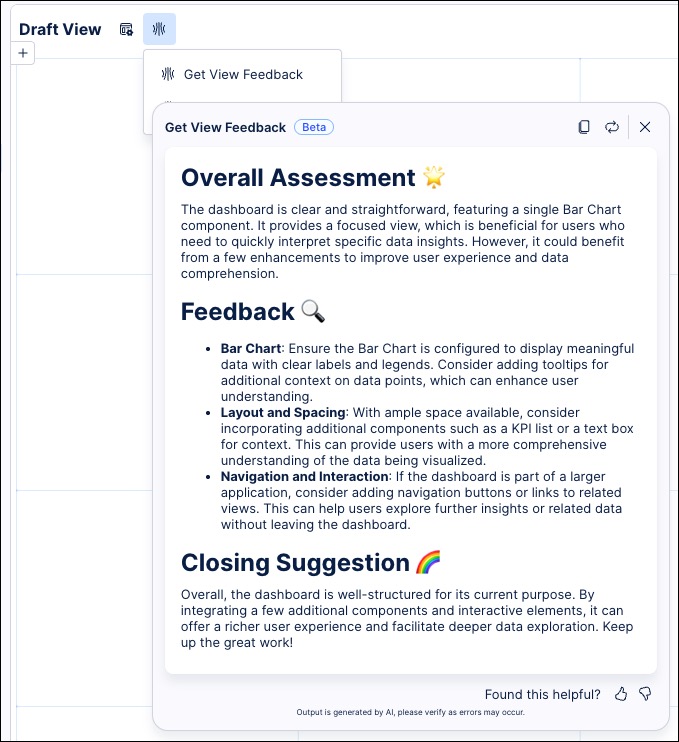
The AI View feedback tool, available while editing your Views, analyzes your content and provides best-practice recommendations for improvement. These recommendations are based on insights gained from reviewing and analyzing a large number of previously created Views and configured components.
When viewing your feedback, you'll get an overall assessment of your View, feedback about the components you've used and their arrangement, and some closing suggestions.
To use the View feedback tool while editing your Views, click AI Tools - Get View Feedback:
 |
To learn more about AI features in Studio, head to AI tools for Views.
And to understand how our private and public preview releases work, see: Feature release types.
PRIVATE PREVIEW STUDIO Full Analysis to Studio View migration available
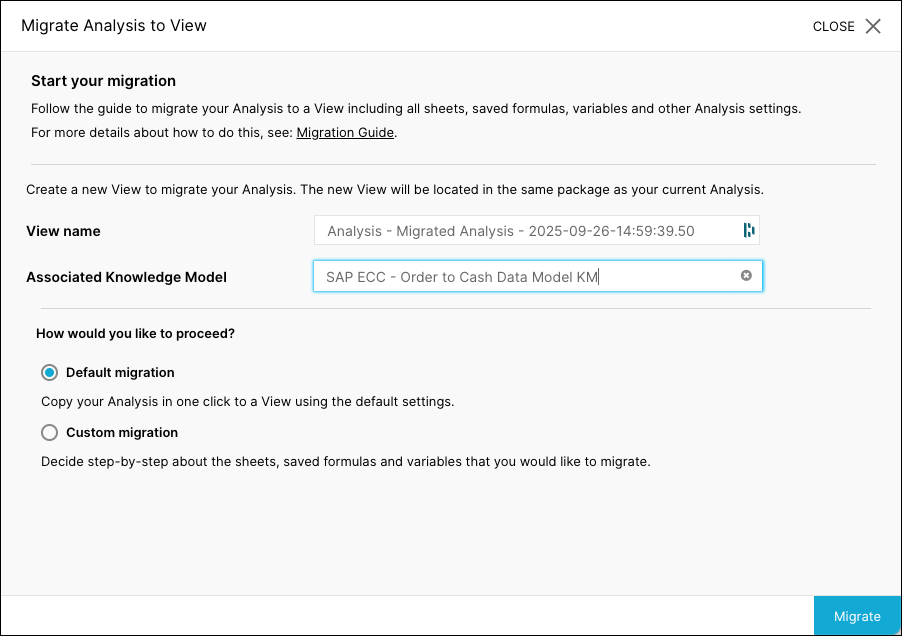
You can migrate your full Analysis assets and setting to Studio Views with the migration wizard, enabling you to create dashboards and reports using our enhanced View editing experience.
While Celonis continues to maintain Analysis (by fixing bugs and ensuring that performance remains strong) but no further feature development will take place. As such, we recommend you migrate your Analysis assets to Studio Views.
 |
For more information, see our guides here: Migrating full Analysis asset.
To learn more about our Private Preview releases, see: Feature release types.
October 13, 2025
IMPROVED STUDIO AI-generated filter explanations in Insight Explorer
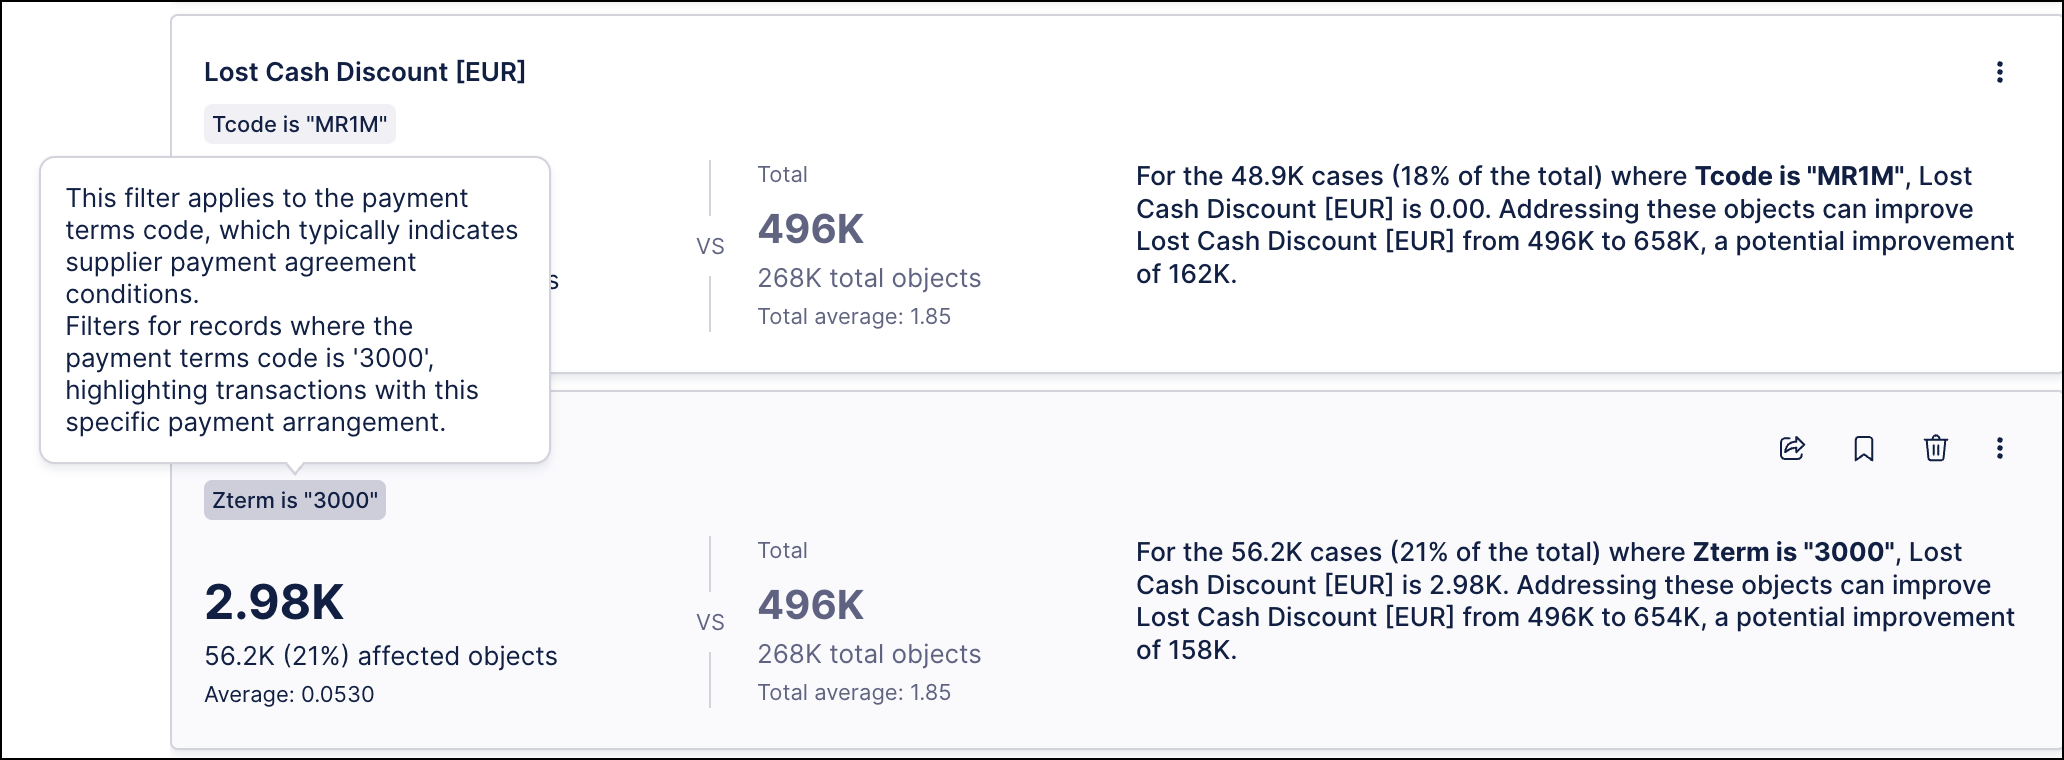
Insight Explorer now includes AI-generated explanations for the filters shown on each of the insight cards generated. To view the explanation, hover your cursor over the gray rectangle below the heading on any insight card to open a pop-up window containing an explanation of the filter and how it was applied to this insight. These explanations provide information such as an overview of the filter criteria applied, a translation of any jargon such as the names of source-system columns or country codes, or suggestions for possible solutions to improve the metric used in this insight.
 |
For more information, see Generated insights.
IMPROVED STUDIO Aggregation Selector added to PQL Editor
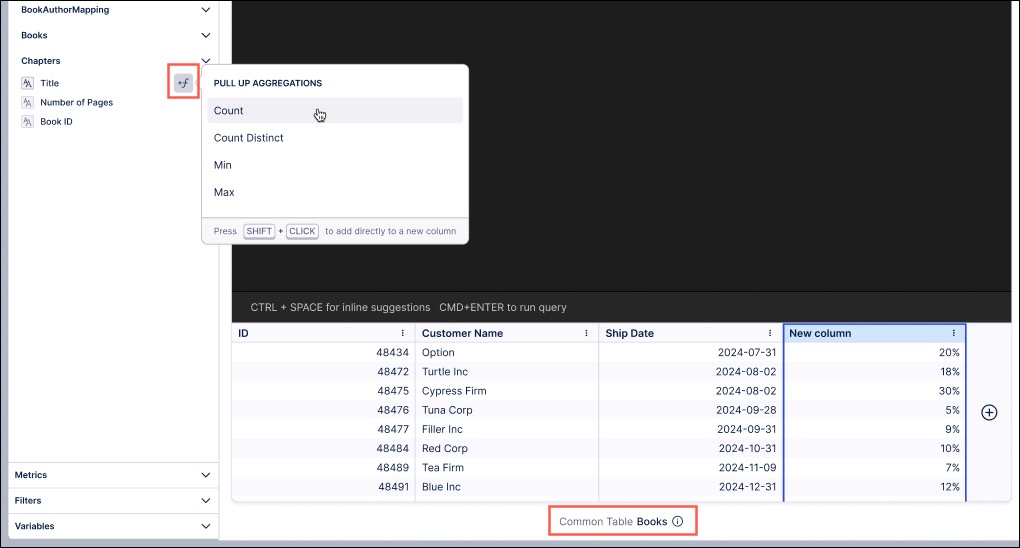
In Celonis PQL, when you define or use a common table, you often need to decide how the data from that table should be aggregated before it can be used in components. To help with this, an aggregation selector is available in the PQL editor whenever a common table can be referenced.
When a common table can be referenced, the aggregation selector works as follows:
If the common table has a direct 1:N relationship to the source column, then the functions menu offers to apply PU functions.
If the common table has a indirect 1:N relationship to the source column, then the functions menu offers PU functions for every relevant connection.
In this example, the common table is 'Books' and the aggregation selector can be used to perform a pull up aggregation of the data:
 |
To learn more about the PQL editor, see: PQL editor.
October 10, 2025
IMPROVED STUDIO OBJECTS AND EVENTS Versioning and deploying packages to replace publishing workflow
We’ve replaced and upgraded the publishing workflow in Studio and Objects and Events with a new versioning and deployment system, giving you greater control over your content. Initially released in public preview, these features allow you to create and manage package and data models versions, track changes, deploy to development and production environments, and efficiently roll back to previous releases.
Studio: Studio lets you deploy packages and control which versions of packages and assets App end-users can access. With version control and support for multiple package versions, you can test new features and configurations before roll out, and offer different App versions for specific use cases via duplicating the package (e.g., locations, products, or teams).
To learn more, see: Versioning and deploying packages.
Objects and Events: Use versioning and deployment capabilities to create, test, and release numbered versions of your object-centric data models. You can deploy to development or production data pools and review or reload earlier versions at any time.
To learn more, see: Versioning and deploying OCDM.
For a video overview of these features:
PRIVATE PREVIEW STUDIO AI recommended metrics for object-centric event logs
With this private preview release for Studio, you can now generate AI recommended metrics when creating object-centric event logs in your Knowledge Model. This features analyzes your process (via eventlogs) and then suggests KPIs that could be interesting for you to monitor. These metrics can then be saved to the Knowledge Model, allowing you to use them in your Studio content.
You can view these recommendations during the event log creation or editing workflow by clicking Generate:
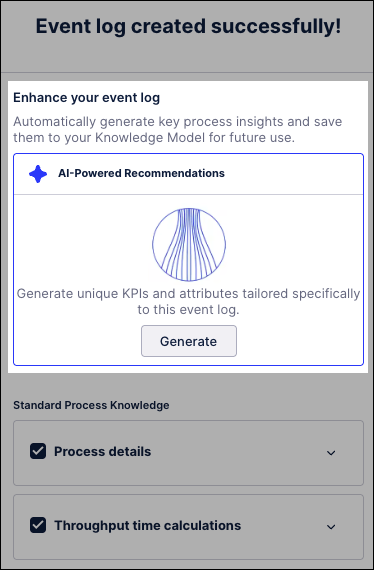
To learn more about creating object-centric event logs, see: Event logs (object-centric).
And for more information about our private preview releases, see: Feature release types.
IMPROVED ADMIN Content CLI now offers integration to Git
Content CLI now offers Git integration for both the batch export and import commands. This integration allows you to push exported packages from the Celonis Platform to your GitHub branches and pull your reviewed content back into the Celonis Platform. Using this new integration, you can leverage CLI to create backups by pushing your Celonis content into individual Git branches where they can be retrieved if needed.
For more information, see the Using Git Profiles section of the Content CLI documentation.
IMPROVED OCDM Content CLI now supports Objects & Events content
Content CLI now supports importing and exporting of OCDM content. This feature is in addition to Content CLI’s existing support for Studio packages. You can now leverage CLI to create backups of both your Studio and OCDM content and then leverage those backups to restore your content on the Celonis Platform.
For more information, see Content Management commands in the Content-CLI documentation.
October 8, 2025
NEW STUDIO Area chart type added to Views
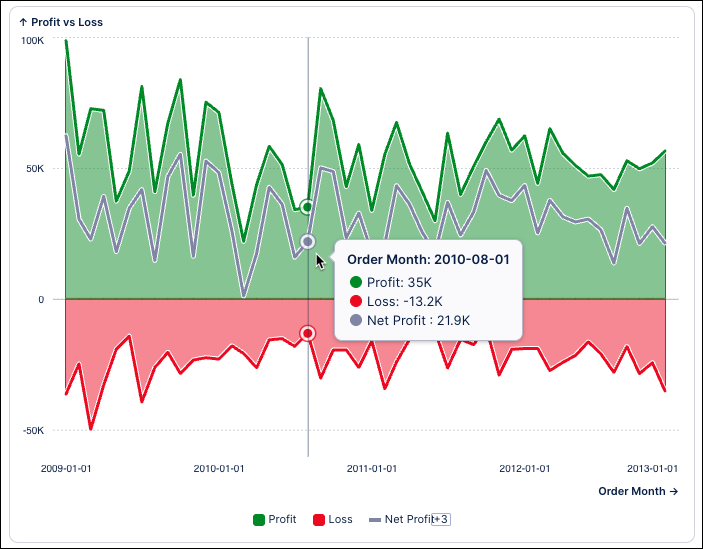
You can now configure an area chart for your Studio Views. An area chart visualizes quantitative data across a continuous dimension, such as time, by filling the area beneath a line to emphasize the size of the values. It works like a line chart but highlights the data through shading, making trends and cumulative changes easier to see.
In this example, an area chart is used to display the profit (metric), net profit (metric), and loss (metric) levels per month (dimension). The chart shows:
Green area (profit): The total profit earned in each month.
Red area (loss): The total loss in each month.
Gray line (net profit): Represents net profit (profit minus loss).
X axis / Y axis: Order month (dimension), profit / loss (metrics)
To learn more about configuring area charts, see: Area chart.
NEW STUDIO Event Grouping in Process Explorer and Variant Explorer
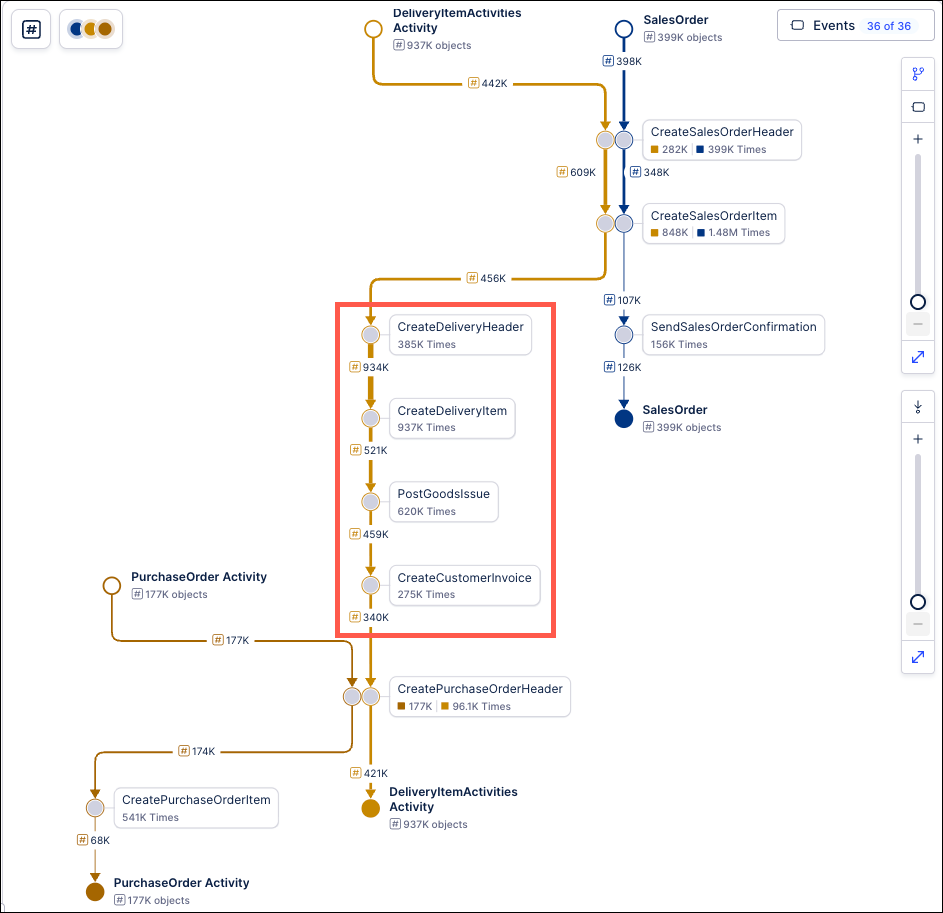
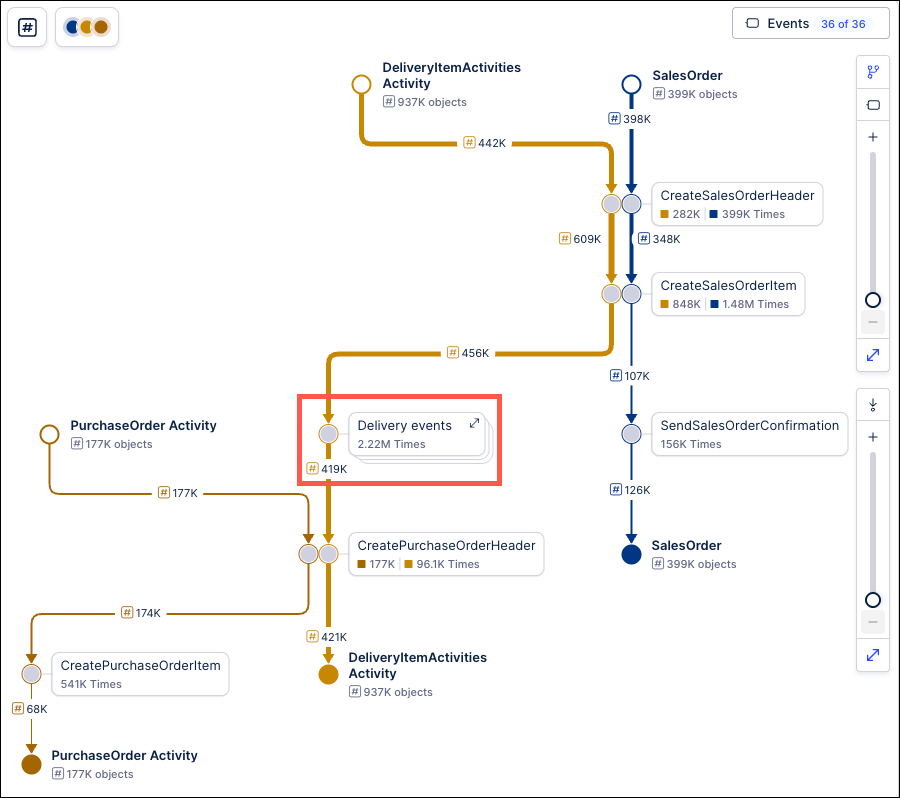
Users of both Process Explorer and Variant Explorer are getting a new feature that allows them to create custom groups of activities or events within the process graph. Grouping these activities/events together simplifies the process graph, making it easier to focus on other portions of the process. For example, users can group together activities or events that are not relevant to the analysis being performed, allowing them to simplify the rest of the process graph and improve the overall readability of the graph. Event grouping can also be used to help users visualize their processes by the individual phases or sub-processes, such as in Banking, Insurance, or Logistics processes.
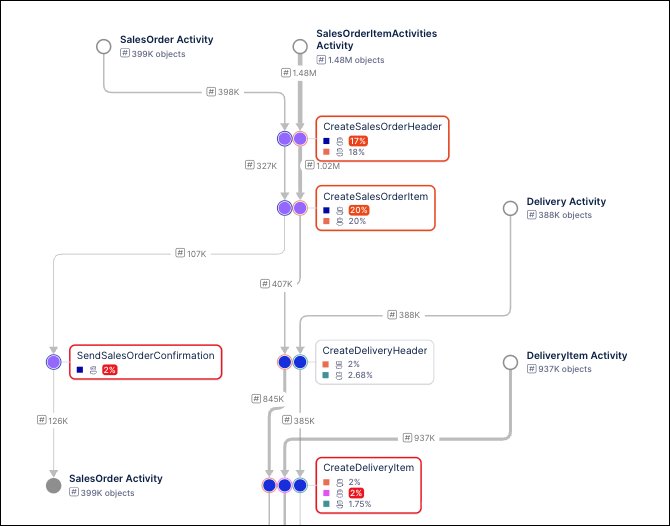
In the example below, the screenshot on the left shows the full process graph with four delivery events highlighted. The screenshot on the right shows a simplified version of the same process graph with the four delivery events grouped together.
|
|
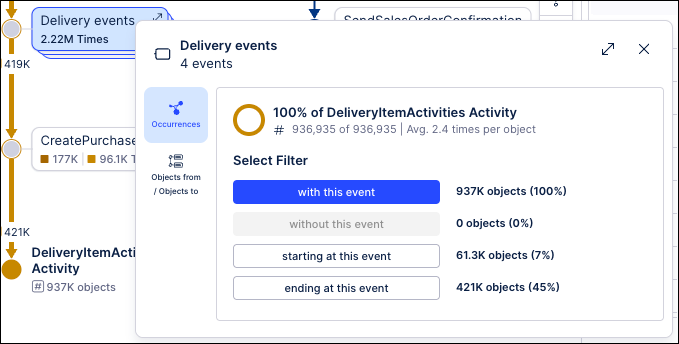
When activities/events are grouped together, the total occurrences for the activities/events in that group are aggregated within the Process Explorer and Variant Explorer. This means that the totals displayed on the group in the process graph will reflect the aggregate number of times that all the events in the group occurred. Users can view more details for the activities/events in the group by clicking on the group in the process graph. Clicking the Expand activity group icon  will allow users to see the individual activities and events within the group as part of the process flow.
 |
Users can create a group by going into Edit Mode in the Studio View and selecting the Process Explorer or Variant Explorer component. On the Settings tab, the “Event Groups” section is used to create new groups and assign the activities or events to include in the group. Specific activities or events can be located using the Search field or the Select all checkbox can be used to add all available activities or events.
Note
Groups are not saved to the Knowledge Model, which means that they are only available in the Process Explorer or Variant Explorer component where they were created. To use the same grouping in another component, it must be recreated.
For more information, see Event grouping.
October 7, 2025
PRIVATE PREVIEW ADMIN Choose the theme for the Celonis Platform
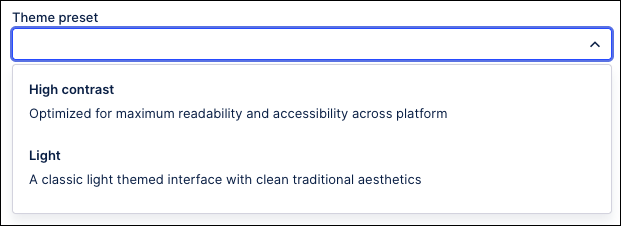
You can now choose the theme for the Celonis Platform, allowing you to adjust the user interface colors and contrast to suit your needs.
The following theme presets can be selected from your profile management screen:
Light (default) – A classic, clean light-themed interface.
Dark – Optimized for low light and reduced eye strain.
High Contrast – Designed for maximum readability and accessibility.
Note: The following products do not support themes: Analysis, Action Flows, Advanced Views, Simulation Asset, Transformation Center, Business Miner, Forms, and Celonis Process Management (CPM).
For more information about choosing the theme for your Celonis Platform experience, head to Managing your user profile.
NEW STUDIO Legend for coloring rules in Process Explorer and Variant Explorer
Since event coloring was added to Process Explorer and Variant Explorer, the process graph is being updated to include a color legend to explain the assigned color mappings. The legend will display at the bottom of the explorer next to the zoom controls, even if there are no color mappings applied.
The legend will show what events have been mapped to each color for the event coloring assigned to the explorer component. For color mappings that utilize threshold or gradient values, the legend will show the values assigned as a range of colors. The color swatches to the right of the assigned KPI colors will indicate the event log where the mapping has been assigned.
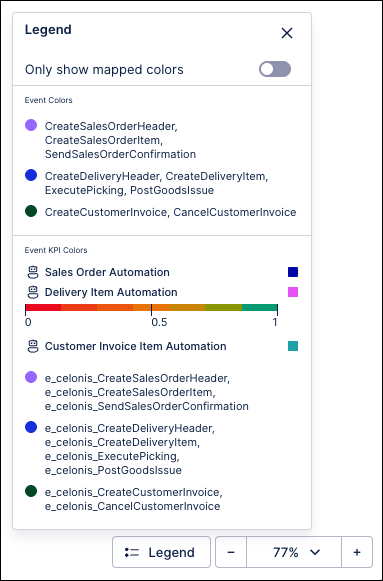 |
The Only show mapped colors toggle can be used to gray out the events using the default colors to make it easier to identify the mapped elements within the process graph. When this setting is enabled, only the events or activities that have colors assigned will be colored, while all elements of the process graph using default colors will be displayed in gray.
 |
For more information, see Color legend.
IMPROVED AUTOMATION Filters for Actions in Table components
Use new Action filters to define conditions for displaying Actions in your Table components. Using the PQL editor, you can specify table row values for which your actions will be enabled. You can select from already available Knowledge Model filters or create your own custom filter. For more information on how to add Actions to Tables, and how to use filters in them, see Actions.
NEW PROCESS ADHERENCE MANAGER Conditions added to Process Adherence Manager models
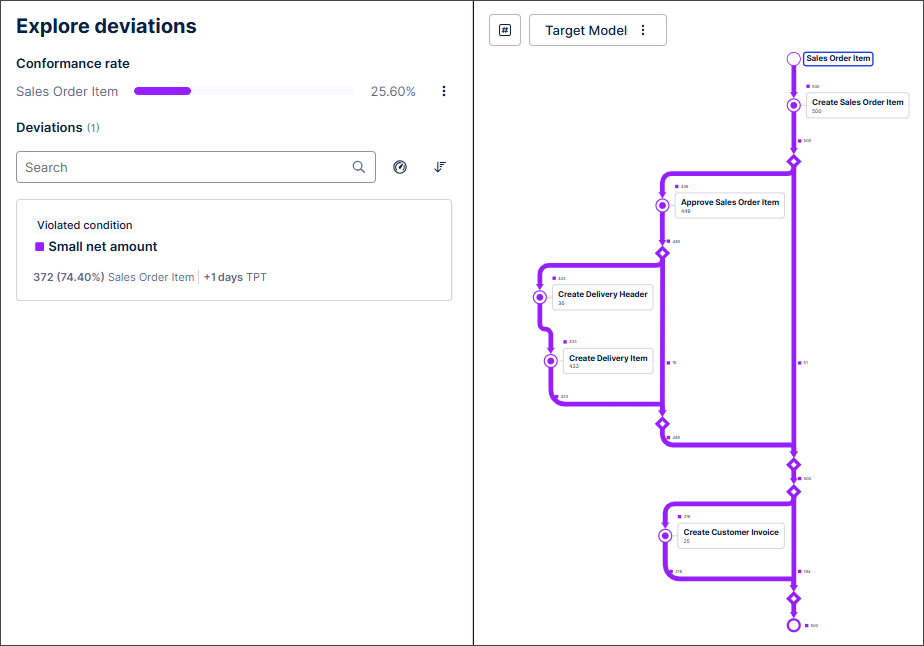
We've aligned Process Adherence Manager more fully with Studio by adding support for conditions. You can now select conditions saved in your Knowledge Model and view their effect on conformance rate, throughput time and other KPIs in Process Adherence Manager.
In this example, you can see the impact a violated condition has on the Sales Order Item event log, with 372 cases (74.40%) affected and one day added to throughput time.
 |
For more information, see Exploring deviations.
IMPROVED STUDIO Process Copilots now show the reasoning behind responses
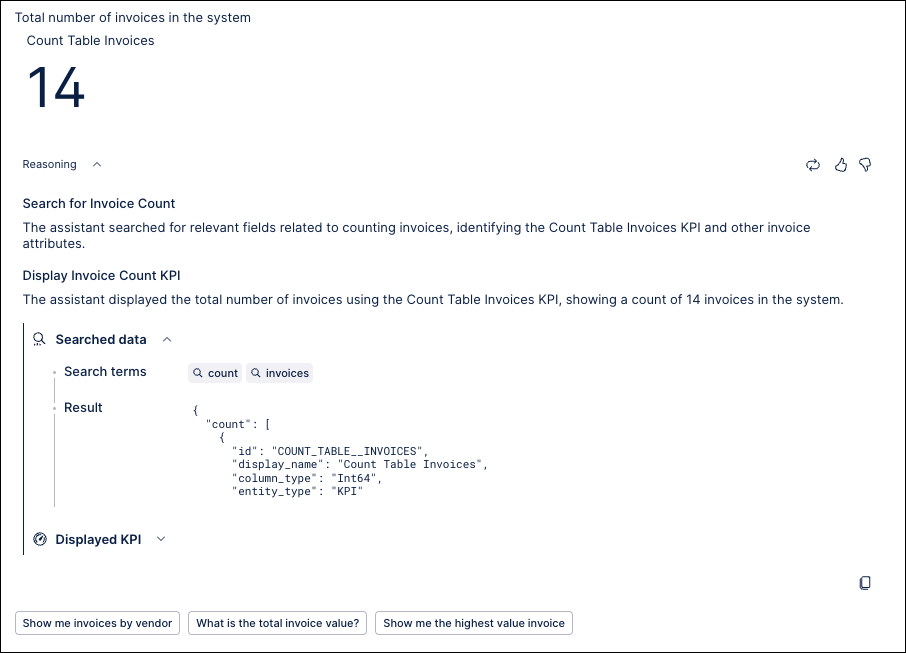
The Process Copilot interface has been updated to show the reasoning behind its decisions directly within its responses. This provides a transparent view of the logic used to generate responses, outline the specific tools applied, and the sequence in which they were used. The reasoning steps are integrated directly into the answer which resulted in the removal of the Inspect panel that previously displayed on the right and showed how the response was calculated.
By having access to the reasoning steps, you can understand the information provided in the responses and have more trust in the results. Expand the Reasoning field to see how the response was created, such as the data the agent searched, the tables being shown, or how the selected KPI were determined.
 |
For more information, see Process Copilot responses.
October 2, 2025
IMPROVED PROCESS NAVIGATOR Search updates
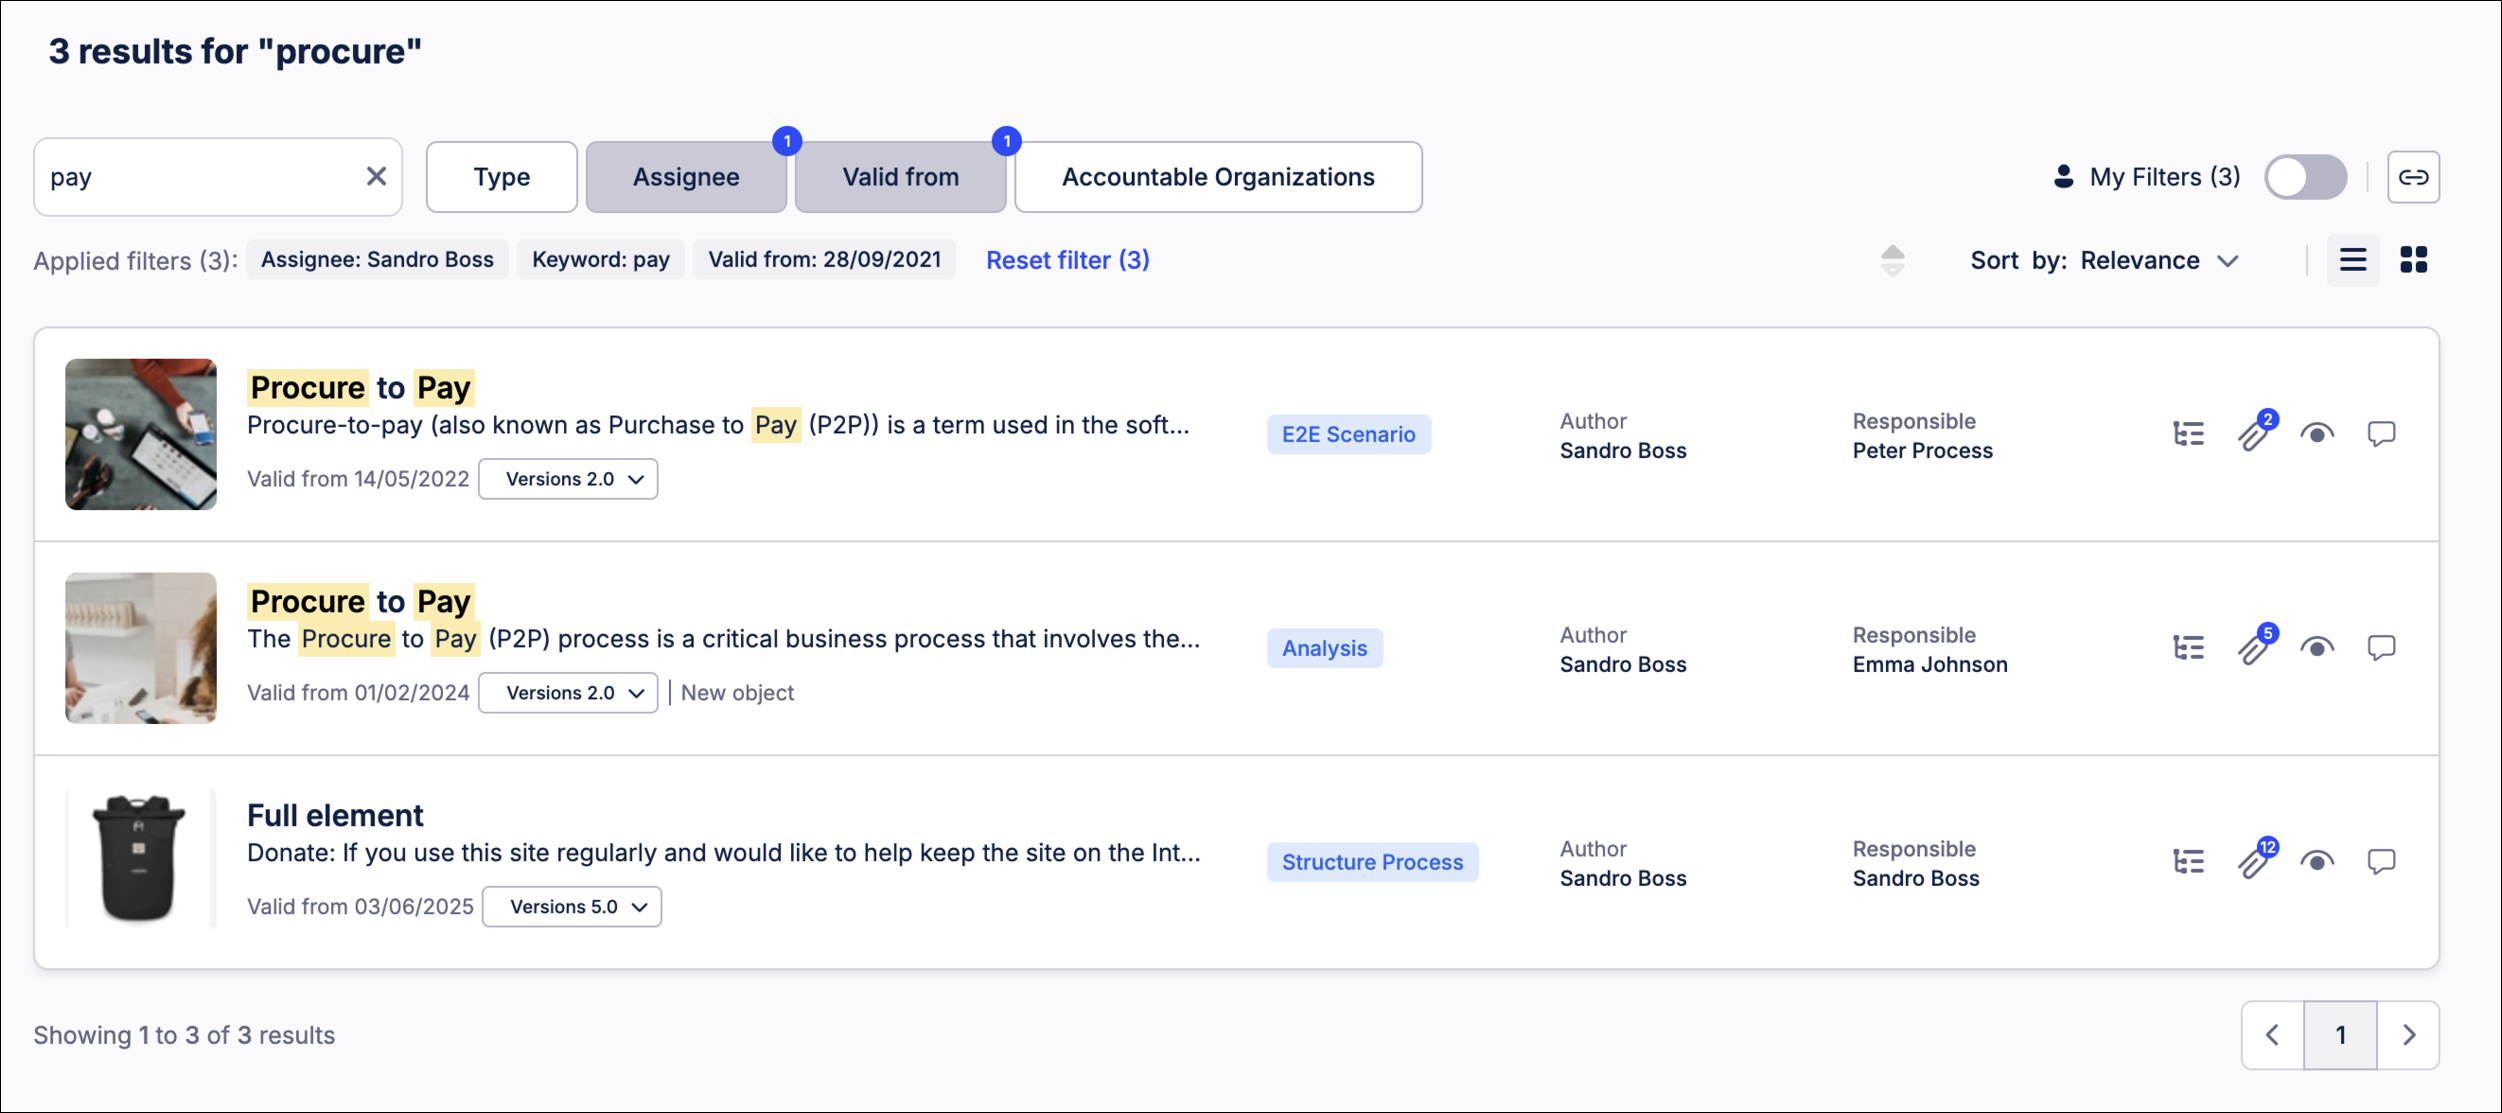
You can now search by keyword in Process Navigator. These keywords act as an additional filter to existing filter criteria in a search, and only filter within the current list of search results.
We've also added a small update to the Action Center. When adding a related object to a new action, there is now a link to where that content is found in Process Navigator.
 |
To learn more about how search works in Process Navigator, see Searching and filtering in Process Navigator.
FIXED DATA INTEGRATION Breaking change: Jira extractor update
Atlassian has deprecated the API endpoint previously used by the Celonis Jira Extractor to retrieve Issue data (/rest/api/2/search). See the official announcement.
To ensure continued functionality, the Issue table will be updated to use the new endpoint (/rest/api/3/search/jql).
If you're currently using the Jira extractor, this change will impact you in the following ways:
The Issue table’s column structure will be altered.
Following the update, delta loads may fail if the 'Include metadata changes' option is not enabled in the extraction settings.
To avoid issues, we recommend running a full extraction once the new version is available.
For more information about the Jira extractor, see: Jira Cloud.
October 1, 2025
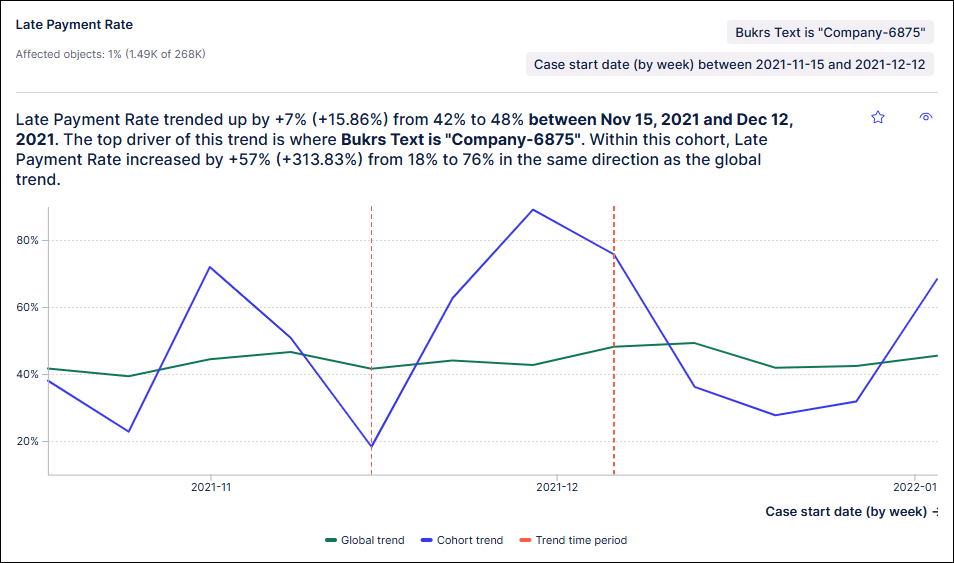
NEW STUDIO Cohort trend insights now available in Insight Explorer
Insight Explorer is expanding the types of information it provides with new cohort trend insights. Cohort trend insights reveal how your metrics change over time, as well as which individual cohorts drive (change in the same direction) or detract from (change in the opposite direction) those trends.
 |
There are several additional considerations for using a cohort trend analysis:
SUMandAVGaggregation types are supported.Numerical attributes are not supported.
For more information, see Types of insights.