Configuring the Instance Explorer component
Instance Explorer is a Studio view component for object-centric data models that lets you explore individual object instances—such as orders or invoices—and their associated events within the digital twin. It provides a visual, end-to-end view of each object’s life cycle and relationships, enabling you to trace issues, understand dependencies, and investigate root causes without creating custom queries or tables.
The Instance Explorer provides the following benefits when analyzing object-centric process data:
Inspect specific IDs: Inspect individual objects (e.g., Orders, Invoices, or Flights) by selecting their unique identifiers. The component displays the complete lifecycle and relationships for the selected instance.
Investigate case behavior: View object relationships and event sequences to understand why a specific case is in its current state. To be consistent with all other Studio components, the Instance Explorer in Views only shows object to object relationships and doesn't show event to object relationships.
Verify data representation: Confirm how source system data is represented in your digital twin and share this view with other stakeholders.
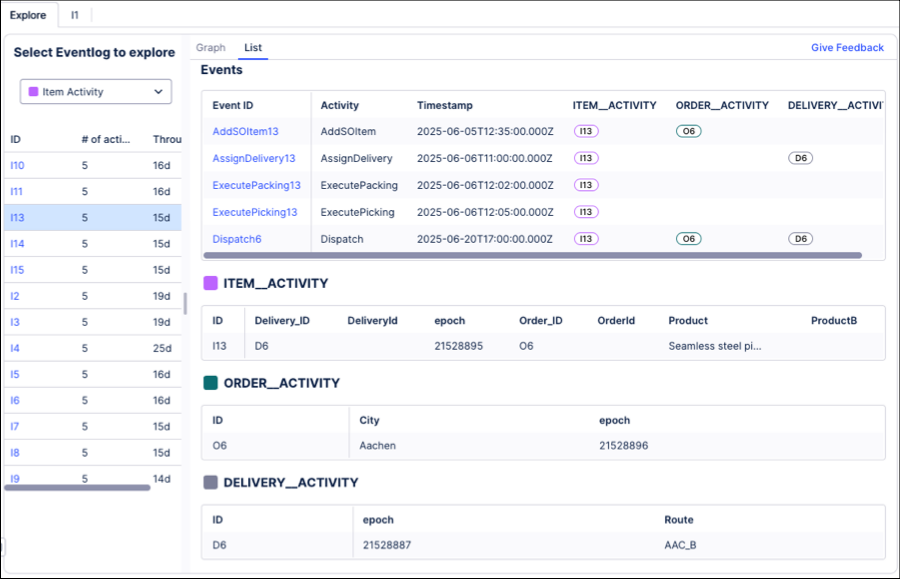
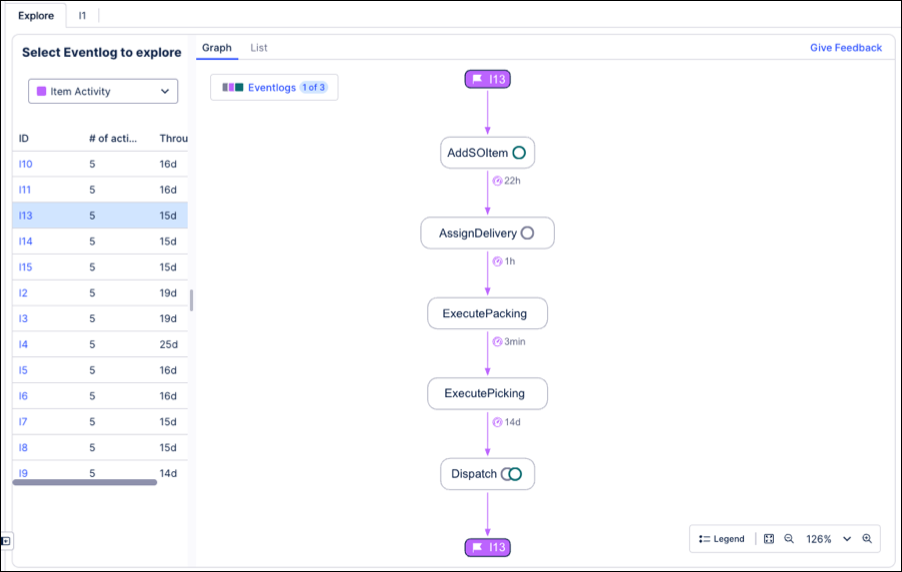
The Instance Explorer can be viewed in both list and graph view:
List view:
Graph view:
To configure the Instance Explorer component, you need the following:
Access to an object-centric data model in your Studio View. See: Object-centric data model (OCDM).
At least one event log to display in the component. See: Event logs (object-centric).
While a single log is the minimum requirement, the Instance Explorer shows its full potential when configured with multiple event logs; this allows you to see where the processes of individual objects interact with related objects from other event logs.
To configure an instance explorer for your Studio View:
In View Edit Mode, drag and drop the case explorer component into your View.
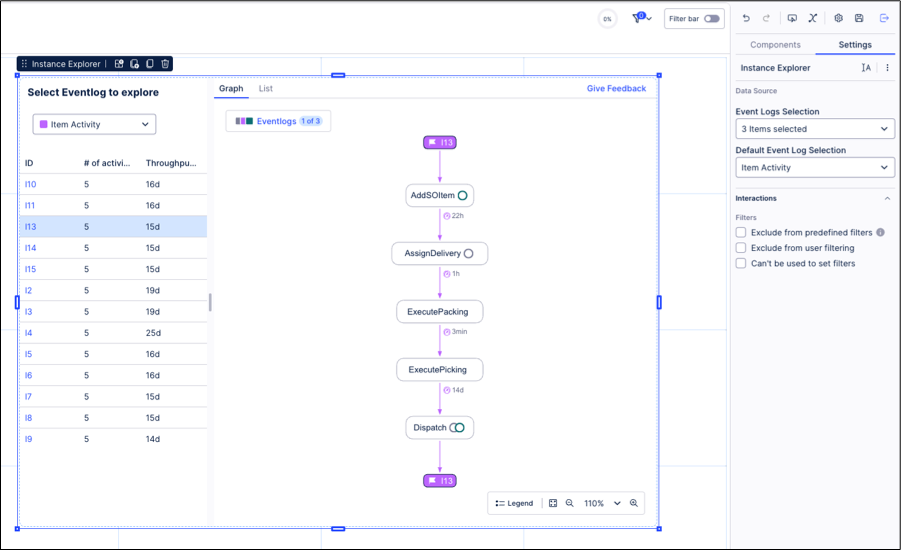
Open the component settings menu and customize your configuration using the following options:
Event log selection: Select the object-centric event log(s) to display in the component.
Default event log selection: Select the default event log to use in the component. The default event log defines the initially selected event log in the component.
Interactions: Enable and disable whether users can set temporary filters when interacting with that component. For more information, see: Temporary filters for Apps.
Exclude from user filtering: When enabled, this prevents the app user from apply a temporary filter to the data within the component.
Exclude from pre-defined filters: When enabled, this removes the component from any filters that are set on a View and tab level.
Can't be used to set filters: When enabled, this prevents the app user from using the component to set temporary filters for the whole View. Filters are only applied to the table showing instances and not for the graph when an individual instance is selected.
Click Interactive Mode and preview your configuration.
Optional: To see the latest version of your View, deploy the package
These examples illustrate how the Instance Explorer helps you analyze individual objects and their relationships to identify root causes, dependencies, and delays in complex processes.
Airline delays: Delayed flights often involve multiple interconnected objects, such as the flight itself, crew members, and scheduling events. Using the component, you can trace a delayed flight to related events—like a crew reassignment—and see how these interactions caused the delay. This demonstrates how Instance Explorer is useful for analyzing dependencies between objects and identifying the root cause of complex process issues.
Sales orders: A single order can pass through multiple stages, approvals, and cancellations over time. The component allows you to follow the full life cycle of a specific order, view all associated events, and identify points where delays or inactivity occurred. This makes it effective for tracking the progression of individual objects, understanding bottlenecks, and diagnosing operational issues.
Cyclic or multi-level circular relationships not supported
Instance Explorer currently does not support displaying "cyclic" or multi-level circular relationships.
For example: If Car A links to Production Batch B, and that batch links back to Cars C and D, Cars C and D will not be visible when you are exploring Car A.
If your use case relies on these types of circular links, please share your feedback to help us prioritize this update.