Performance Spectrum
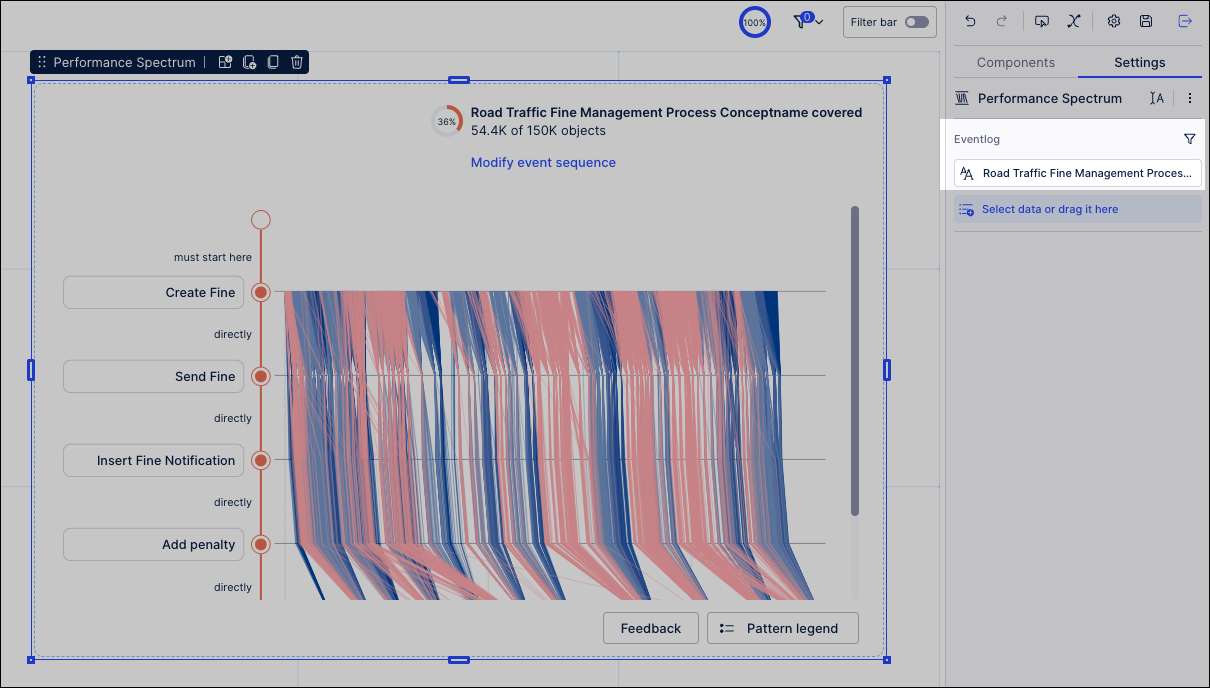
The Performance Spectrum component maps process steps along a visual timeline, displaying how individual cases travel over time. This visualization allows process analysts to identify operational bottlenecks, batching habits, and cycle-time variations within Studio Views.
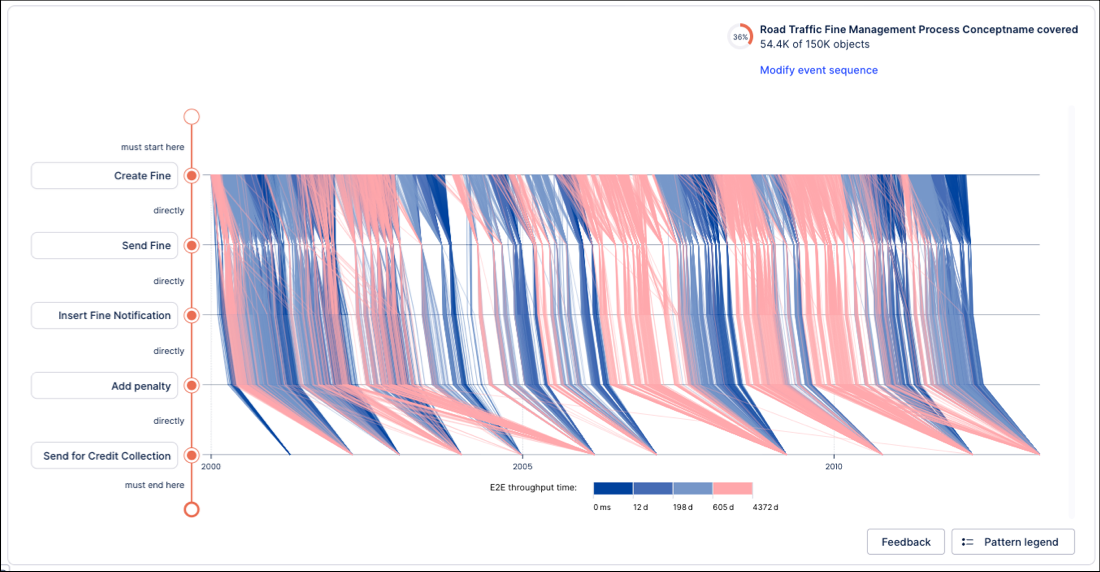
A local government agency uses the Performance Spectrum to audit their traffic fine workflow. While standard aggregated process graphs show a stable average cycle time of 30 days from creation to payment, they mask critical process dynamics.
By defining a specific sequence of steps—from fine creation to credit collection—and visualizing individual case journeys, the agency identifies specific operational anomalies:
Batching behavior: Staff groups and processes fine notifications in irregular intervals rather than continuously.
Process drift: Fine notifications display wide timing variations, exposing a subset of cases that stall significantly longer than the baseline.
Automation patterns: Penalty events occur rigidly 60 days after notification, confirming systemic scheduling adherence.
Because the Performance Spectrum visualizes individual case journeys, plotting an unfiltered dataset can cause visual clutter. Narrow your analytical focus before configuring the component:
Isolating low-performing cases: Apply a filter component or KPI block to isolate cases that exceed target throughput times or violate service-level agreements (SLAs).
Targeting a specific object instance: Filter by a unique identifier (such as an Order ID or Invoice Number) to audit an escalated case history line-by-line.
To add and configure the Performance Spectrum component in a Studio View:
In View Edit mode, drag and drop the Performance Spectrum component onto your canvas.
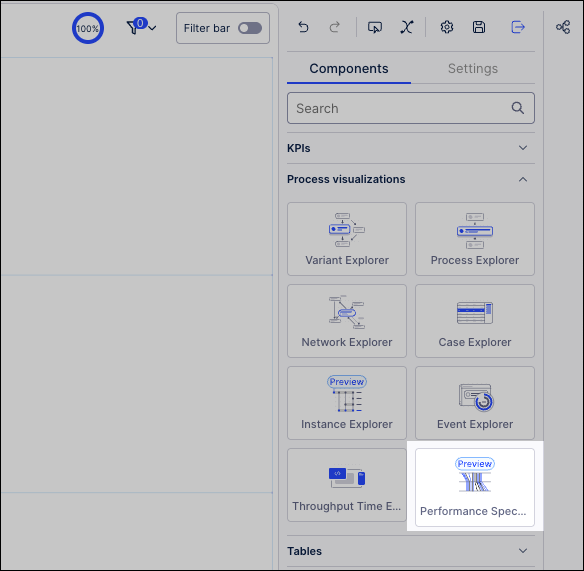
In the Settings panel, select your target Event Log from the dropdown menu.
Switch to Interactive Mode and select a base variant to establish your initial sequence.
Optional: Customize the process sequence to match your analysis goals:
Add or remove events: To add or remove sequence steps, click the Add Event or Remove Event controls in the timeline configuration.
Definine connection types between events: Configure your start and end events to be either strict (must start or end the sequence) or flexible (other events can happen before or after).
Followed anytime: The subsequent event can occur at any point after the preceding event, allowing other intermediate steps to take place in between.
Directly followed: Events must occur back-to-back, with no other events in between.
Deploy your application, making it available in the Apps area.
To learn more about creating versions and deploying your apps, see: Versioning and deploying packages.
Use the published Performance Spectrum to analyze your data.
Sequence matching semantics
The Performance Spectrum component uses the earliest valid occurrence for repeated/overlapping matches.
Example: for sequence A → B in an object with events A, A, B, B, the component matches the first A and first valid B after it, not a later A/B pair.
Here are some commonly seen patterns when using the Performance Spectrum:
Pattern | Visual | Explanation | |
|---|---|---|---|
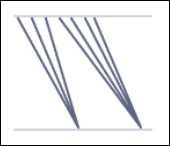
Batching |
| Multiple object instances are grouped and processed together. | |
Constant speed |
| Object instances progress at a consistent rate over time. | |
Drift |
| The rate at which object instances progress changes gradually. | |
First in first out (FIFO) |
| Object instances are completed in the order they begin. | |
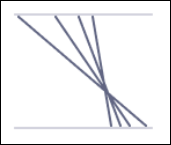
Last in first out (LIFO) |
| The most recent object instances are completed first. | |
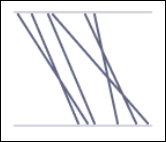
Unordered |
| Object instances are completed in a seemingly random order. |