Process Intelligence Graph
The Process Intelligence Graph (PI Graph) is the foundational semantic layer of the Celonis Platform. It establishes a system-agnostic, object-centric digital twin of enterprise operations by unifying multi-system data, operational context, and process knowledge into a centralized model.
The Process Intelligence Graph surfaces cross-system execution gaps that traditional, single-case process mining misses. For example, in an Order-to-Cash process spanning Salesforce CRM, SAP ECC, and Oracle ERP, the graph links credit blocks, delivery modifications, and invoice entries to isolate how upstream system hand-offs cause late customer payments.
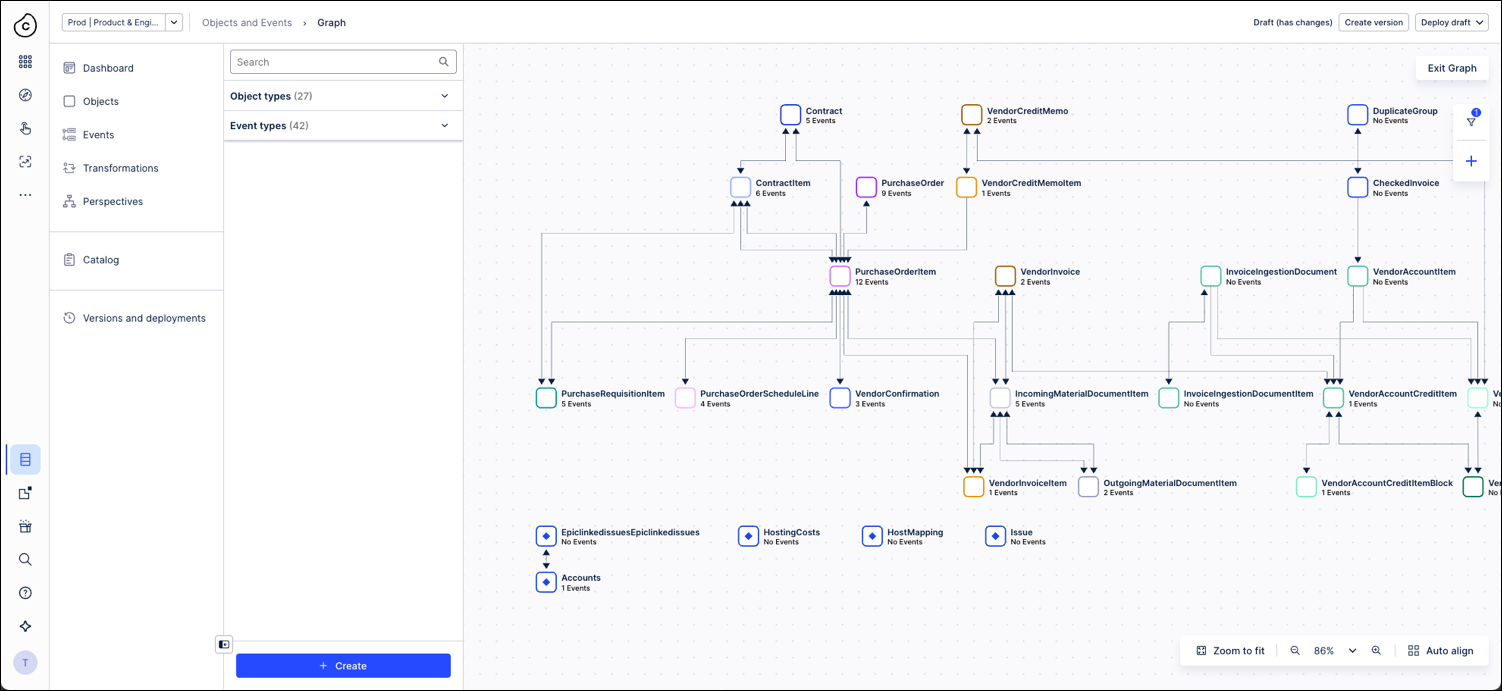
The following diagram illustrates an object-centric process model generated within Objects & Events:
Here are the main building blocks of the PI Graph architecture, along with how they interact:
PI Graph component | Description | Function |
|---|---|---|
Object-Centric Data Model (OCDM) | The foundational data structure of the PI Graph. It represents real-world business objects (like Purchase Orders, Invoices, Deliveries, Customers) and events (like Create PO, Approve Invoice, Ship Goods) and their explicit interdependencies. This model provides a multi-object, cross-process view of operations that extends beyond traditional single-case process mining. | Provides a multi-object, cross-process view of operations, beyond traditional single “case-based” process mining. |
Event data layer | Stores and connects all events (activities, status changes, transactions) from all systems. | Maintains the historical transaction event logs that form the structural backbone of the process graph. |
Object relationships layer | Defines and maintains relationships between business objects (e.g., a Purchase Order → multiple Goods Receipts → one Invoice). | Enables end-to-end process visibility and relationship tracing across systems. |
Business context / semantic layer | Adds metadata: definitions of KPIs, business rules, roles, responsibilities, and operational logic. | Acts as a “common business language” connecting IT data to business terms and goals. |
Data integration layer | Connectors for ERP, CRM, SCM, HR, legacy systems, APIs, and streaming sources. | Feeds real-time or batch data into the PI Graph securely and consistently. |
Analytics and intelligence layer | Powers insights through process analytics, variant exploration, root-cause analysis, machine learning, and generative AI. | Enables diagnostic and predictive insights on top of the unified graph. |
Action and orchestration layer | Connects insights to action: triggering automations, alerts, or workflows directly from the PI Graph. | Turns insights into measurable operational improvements (“process optimization loop”). |
Reusability and governance framework | Includes shared definitions, templates, and governance structures for KPIs, objects, and models. | Ensures consistency, scalability, and reuse across processes and departments. |
Understanding how the key components work together
As a high-level summary, the key components in the Process Intelligence Graph work together in the following way:
Data ingestion: Extract transactional data from distributed enterprise sources (including ERPs, CRMs, and databases) using the secure on-premise client model to bypass firewall port modifications.
Modeling / transformation: Map the ingested raw data directly into the system-agnostic, object-centric framework to establish clear object-to-event relationships.
Graph construction: Construct the unified process view to trace end-to-end value chains and monitor how discrete entities interact across separate system ecosystems.
Enrichment with context/knowledge: Layer business rules, custom KPIs, and organizational roles over the graph to transform raw process variants into actionable intelligence.
Improved insight and actionability: Execute advanced process analytics, apply machine learning models, isolate operational bottlenecks, and trigger automated Celonis Action Flows to resolve process deviations in real time.
Reusable and scalable: The object-centric model ensures that once objects and events are configured for a given process, they are immediately available to reuse, extend, and scale across alternative processes without duplicating baseline engineering effort.
Using the PI Graph provides the following key benefits:
End-to-end visibility across systems: As the PI Graph is system-agnostic, map processes that span multiple tools, systems, and departments (e.g., Order-to-Cash, Procure-to-Pay) in one unified view.
Reusable and scalable: The object-centric model ensures that once objects and events are configured for a given process, they are immediately available to reuse, extend, and scale across alternative processes without duplicating baseline engineering effort.
Common language for the business: By providing a unified semantic layer (objects, events, rules, KPIs) it helps business and IT align on how processes run and where value opportunities lie.
Improved insight and actionability: Because the PI Graph is enriched with process knowledge, AI, and machine learning, identify where things are going wrong (bottlenecks, deviations) and what to do about them.
Foundation for automation and AI: The PI Graph serves as the data and context layer that enables automation, generative AI, and process orchestration by exposing “how your business flows” in structure.
The following use case illustrates how a global organization deploys the PI Graph to resolve multi-system execution gaps:
The challenge
A global manufacturing company runs its O2C process across multiple ERP systems (e.g., SAP ECC in Europe, Oracle in the U.S., and Salesforce for CRM).
They want to:
Identify bottlenecks and automation opportunities across the entire process.
Understand how customer order changes, delivery delays, and credit blocks interact to cause late payments.
Gain a unified view of the process, even though the data is fragmented across systems.
Standard process mining would require creating separate event logs for each system and process, and then manually stitching together insights. This makes it difficult to understand cross-system dependencies, like how a credit block in SAP affects invoice timing in Oracle.
The solution
The PI Graph acts as a semantic, interconnected data model, a “digital twin” of the business processes used by the global manufacturing company. It allows them to:
Connect multiple data sources dynamically (ERPs, CRMs, supply chain) into one coherent process view.
Model relationships between entities like orders, deliveries, invoices, customers, and payments.
Automatically detect cause-and-effect relationships — e.g., how often delivery delays cause overdue invoices.
Enable real-time analysis across systems without manually rebuilding event logs.
With the PI Graph, the global manufacturing company discovers:
High percentage of late payments are linked to delivery delays caused by incomplete material availability.
Orders from a specific region have higher delay rates because credit blocks in SAP are not cleared promptly after a Salesforce order modification.
Automatically recommends automation (via Celonis Action Flows) to notify credit controllers when a credit block causes invoice delay.