Treemap component
A treemap component is a type of data visualization that displays hierarchical (tree-structured) data as a set of nested rectangles. Each branch of the hierarchy is represented by a rectangle, which is subdivided into smaller rectangles representing sub-branches or leaves.
You should use a treemap in your Studio Views when you're looking for:
A quick, high-level overview of how values are distributed.
To compare multiple categories in a space-efficient way.
Interactive filtering for deeper process exploration.
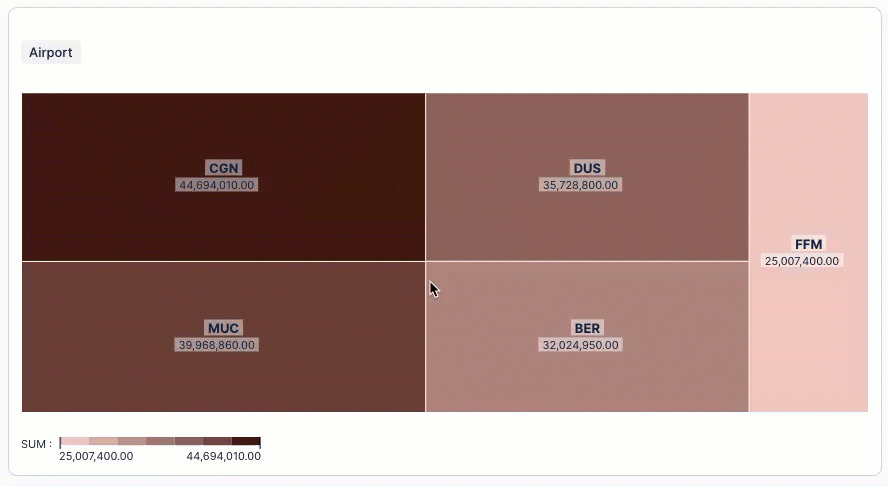
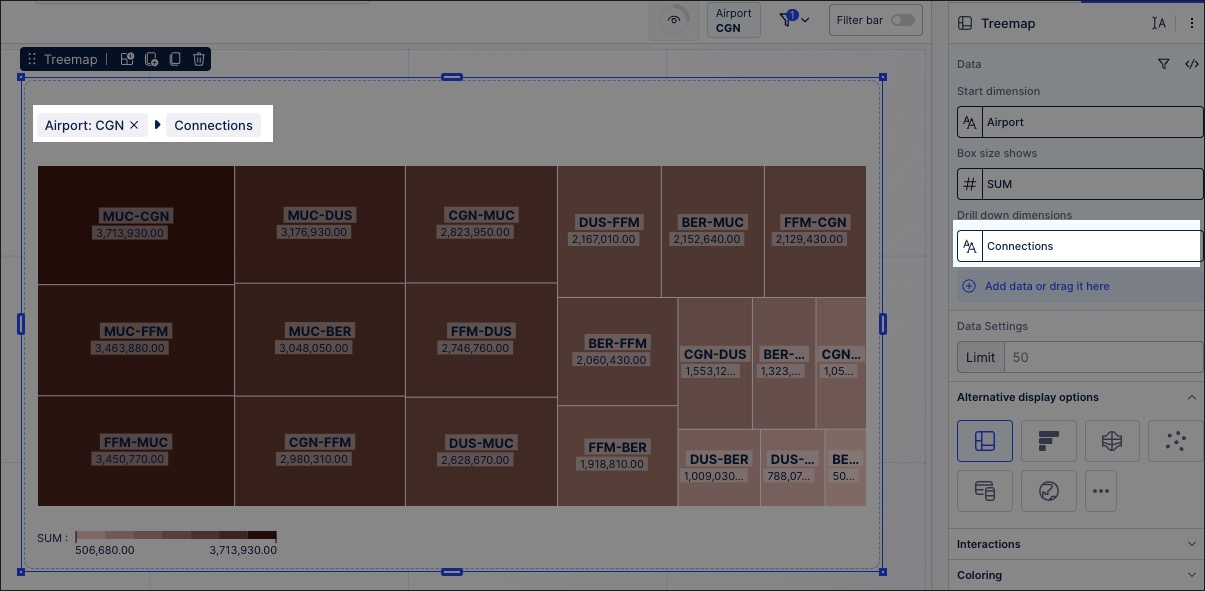
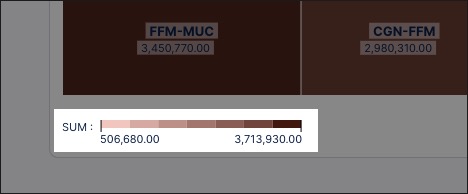
In this example, a treemap is used to display the most frequent flight connections between German airports. The darker the color, the higher the number of connections, with MUC to CGN being the most frequently flown during the time period.
In Studio, you can configure a treemap component using at least one dimension and one metric, with additional dimensions added when you want users to see further details.
To configure a treemap component for your Studio View:
In View Edit Mode, drag and drop the treemap component into your View.
Open the component settings menu and customize your configuration using the following options:
Start dimension: Choose the dimension that you want to display in the treemap.
For example, the main airports in Germany.
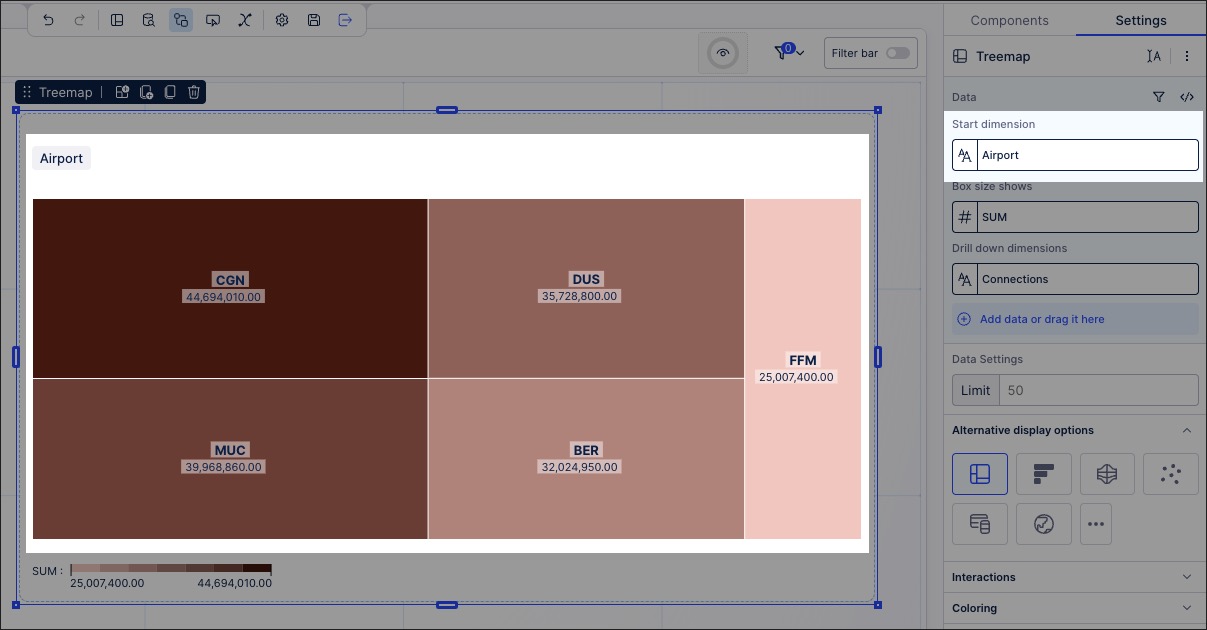
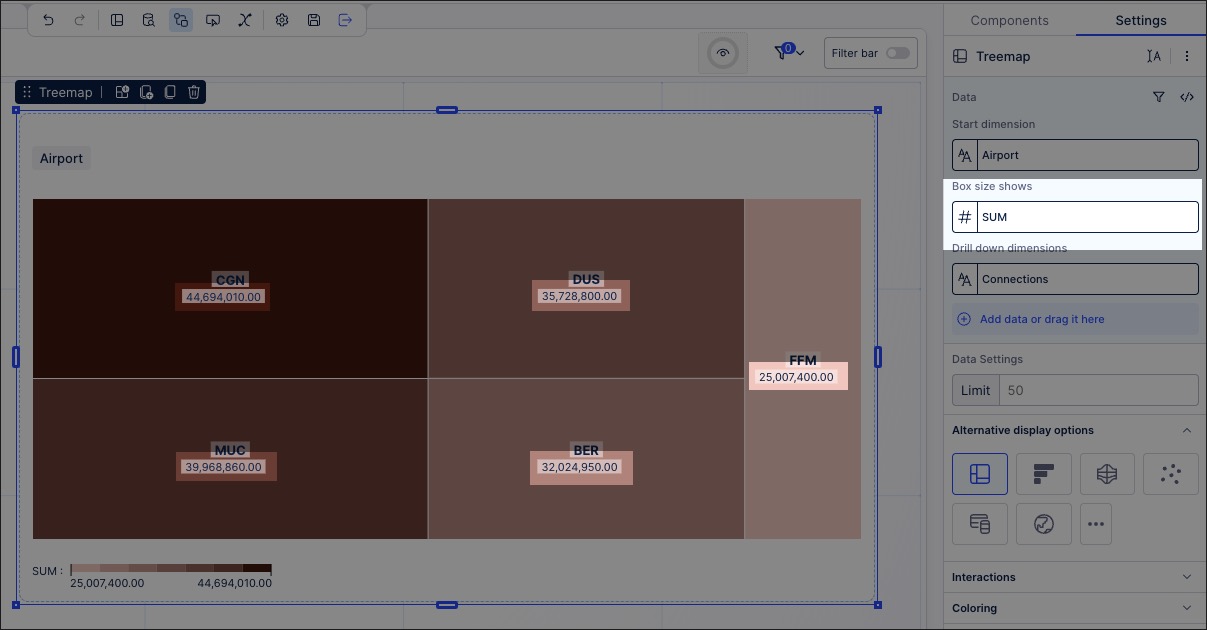
Box size shows: Choose the metric that your dimensions should be displayed in.
For example, the total number of passengers in a year.
Drill down dimension: Choose an additional dimension that your users can see when they click into the starting dimension on the treemap.
For example, the number of connections made between airports.
Data settings: Choose the maximum number of data points to display in the treemap.
Alternative display options: Based on the data you've selected, you may be prompted here to try visualizing this data using an alternative component.
Interactions: These settings allow you to configure what type of interactions a user can have with your treemap.
Exclude from user filtering: When enabled, this prevents the app user from filtering the data within the treemap.
Can't be used to set filters: When enabled, this prevents the app user from using the treemap to set filters for the whole View.
Coloring: Choose whether to color your boxes by gradient or threshold.
Style: Choose whether to show or hide the legend on your treemap.
Click Interactive Mode and preview your chart configuration.
Optional: To see the latest version of your View, deploy the package.