Process Explorer
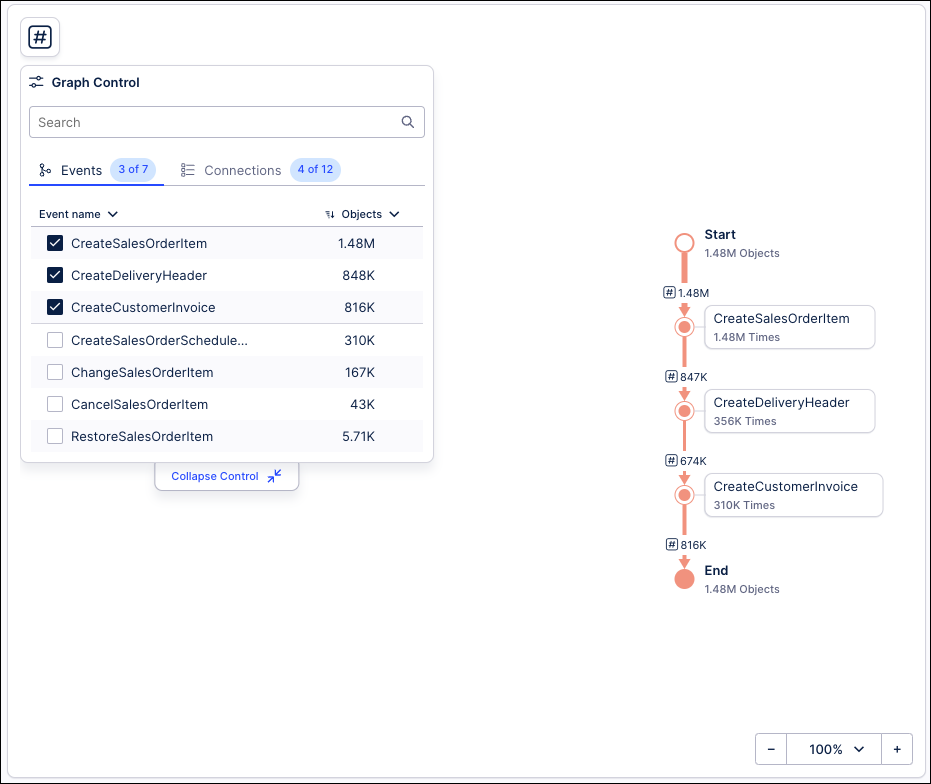
The Process Explorer component allows you to add a visual overview of a selected business process to your Studio view, with the most frequent process activities and connections highlighted. This component uses event logs from your Knowledge Model, allowing the activity table (and related data) from your data to be displayed. You can add further additional activities to the graph and analyze their impact on the process, with no limit on the number of process activities that can be included in the diagram.
You can configure the Process Explorer in two ways:
In legacy views using YAML:
 |
To configure a Process Explorer in your View:
In View Edit Mode, drag and drop the Process Explorer component into your View.
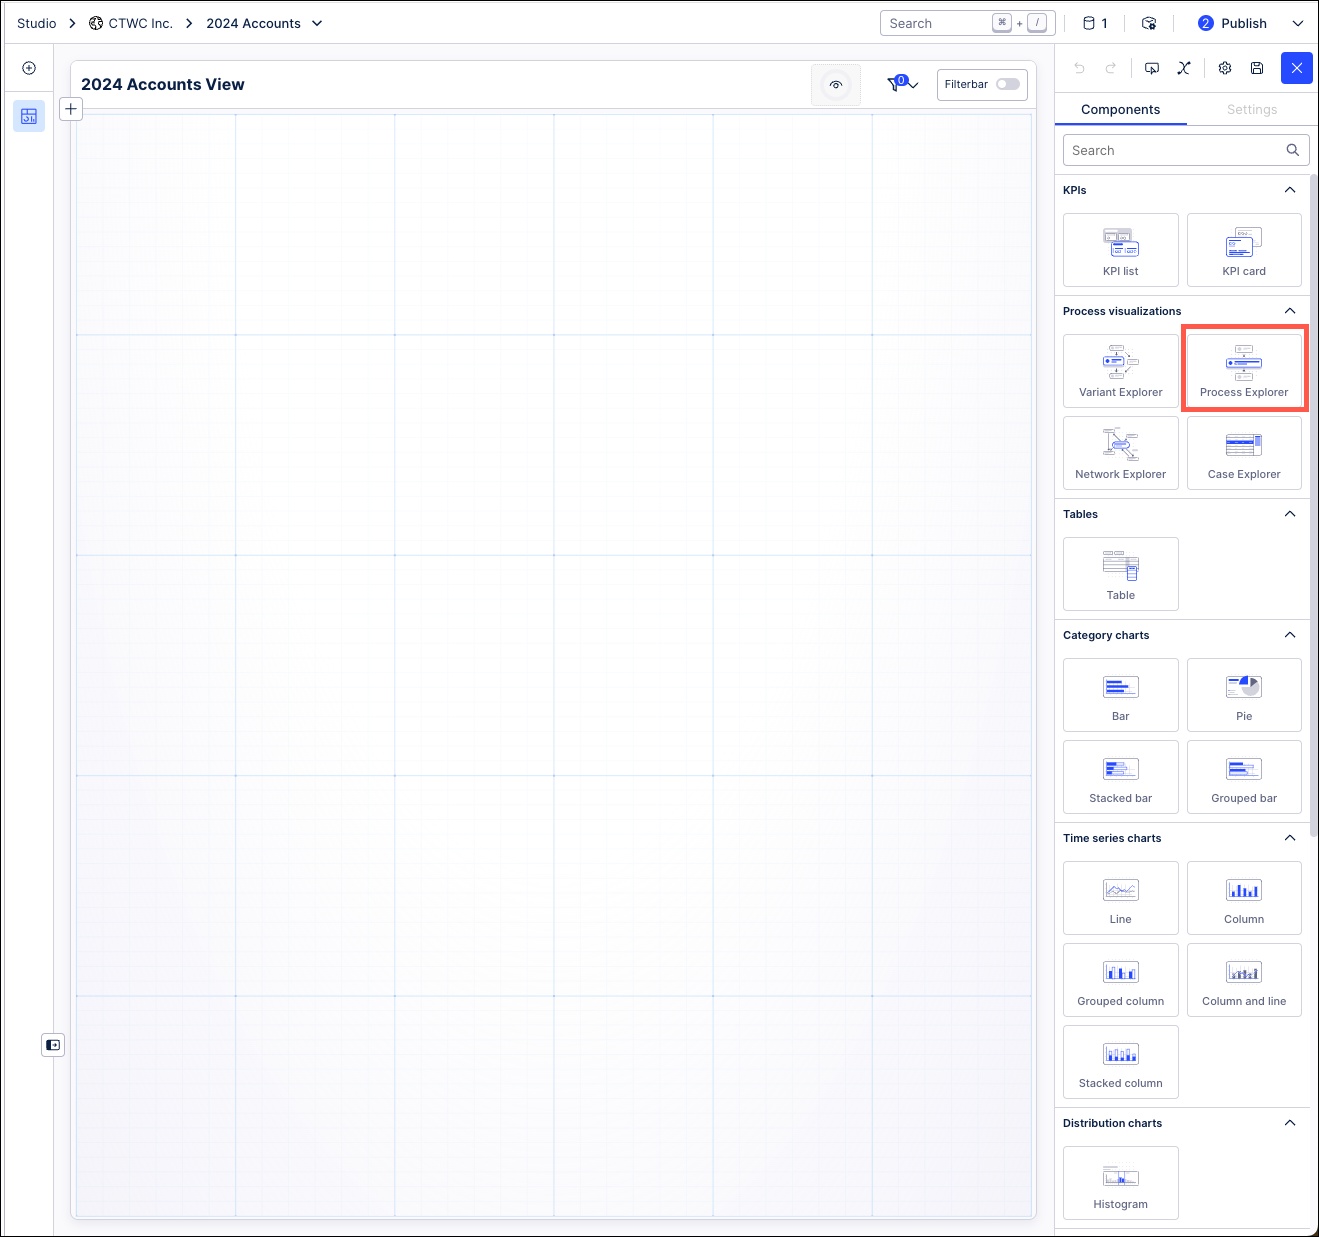
Open the component settings menu and customize your configuration using the following options:
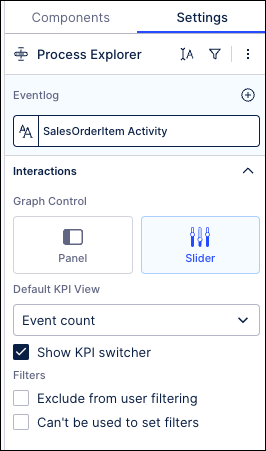
Eventlog: Select the event log from your Knowledge Model that you want the graph to be based on.
Graph Control : Choose between controlling your Process Explorer graph with a control panel or with sliders.
Default KPI View: Select the default KPI you want your Process Explorer to display.
Show KPI switcher: Select to show the KPI switcher that allows you to switch between KPIs, changing the KPI displayed in the Process Explorer.
Exclude from user filtering: When filtering the whole view, this component will remain unfiltered.
Can't be used to set filters: While a user can interact with this component, their selections can't then be used to filter the whole view.
Click Interactive Mode and preview your button configuration.
Optional: To see the latest version of your View, deploy the package.