KPI driver analysis
Business Miner service is being deprecated from February 6, 2026
Our Business Miner service is being deprecated and has already been replaced by our AI-driven Insight Explorer and Studio features.
To learn more about this deprecation, see: REMOVED BUSINESS MINER Deprecating Business Miner service.
And to get started with Insight Explorer, see: Insight Explorer
Explaining KPI driver analyses
Note
The KPI driver analysis is typically the final question you see when you drill down into a standard Exploration.
A KPI driver analysis:
is an automated way of finding the drivers of poor performance in your process.
helps you focus on where you can make the greatest improvements by ranking these drivers based on the impact of fixing them (their actionability).
For example, a KPI driver analysis might flag that many invoices for a specific vendor are linked to poor performance. Digging into the invoice data and processes for that vendor and fixing any issues would improve your process. How much your process would improve depends on the actionability ranking of the driver. The higher the actionability ranking, the greater the overall process improvement.
Explaining actionability
Celonis uses a statistical algorithm that looks at the impact of an attribute with a specific value and the difference in the distribution if the case meets (or doesn't meet) a specific KPI target.
An actionable driver:
will have a significant impact on your process if addressed.
is possible to fix.
For example, if a specific attribute value accounts for issues in 80% of cases, it has a high improvement potential. However, if 90% of these cases are on track to meet a KPI target, the algorithm will give the driver a lower actionability ranking. This is because fixing the remaining cases is likely to be difficult.
Performing a KPI driver analysis
Select any attributes you think might be driving low performance.
Tip
If you're not sure, click Select all to include all attributes.
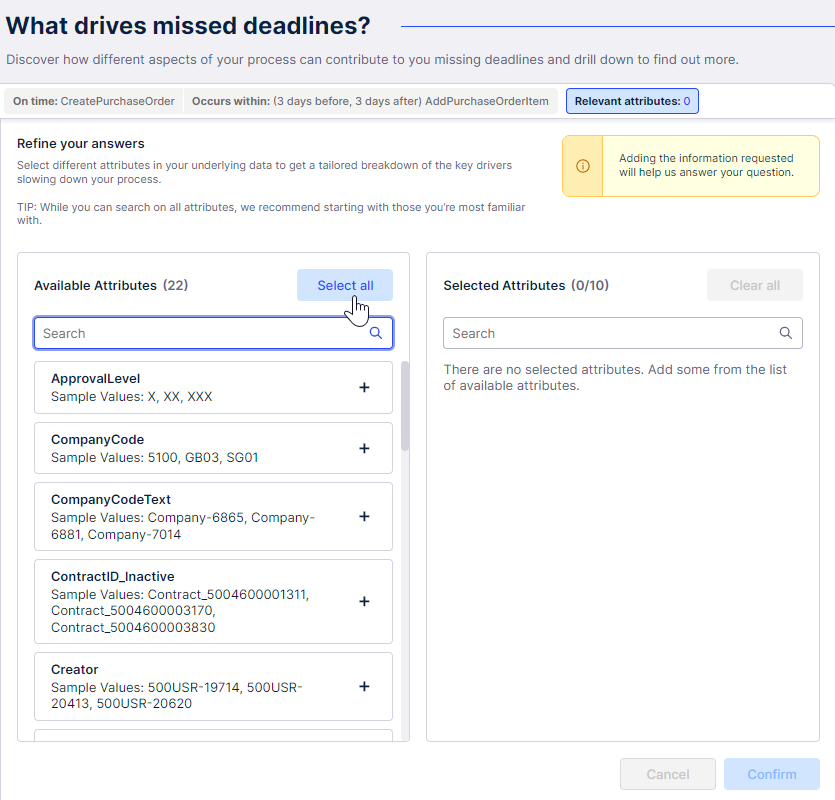
Click Confirm.
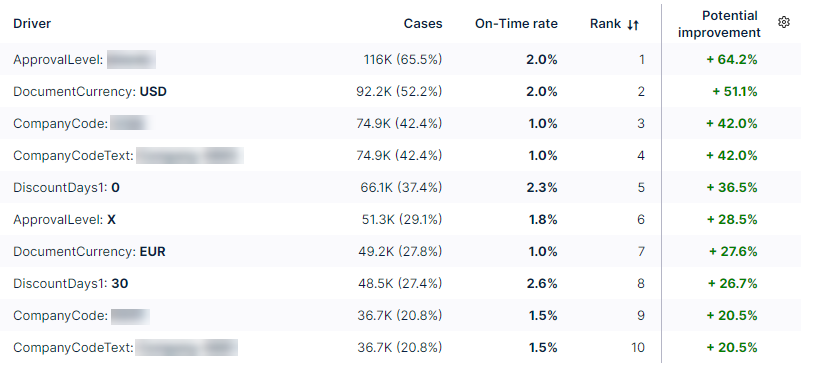
The analysis outputs the KPI drivers ranked by actionability. You can also see the potential improvement if all cases met the target.
In this example, the potential improvement is to the On-Time rate if all cases meet the deadline, including the grace period.