Creating process graphics
Process graphics are a visual representation of a process, showing the sequence of steps, activities, and decisions involved in achieving a specific goal or objective. Process graphics are useful for understanding how a process flows, identifying potential bottlenecks, and improving overall efficiency.
You can create process graphics for both main and sub processes in Process Designer using the process canvas. This interactive canvas enables you to choose your diagram modes and then add and configure process events, such as Start and End, and objects, such as tasks or interfaces.
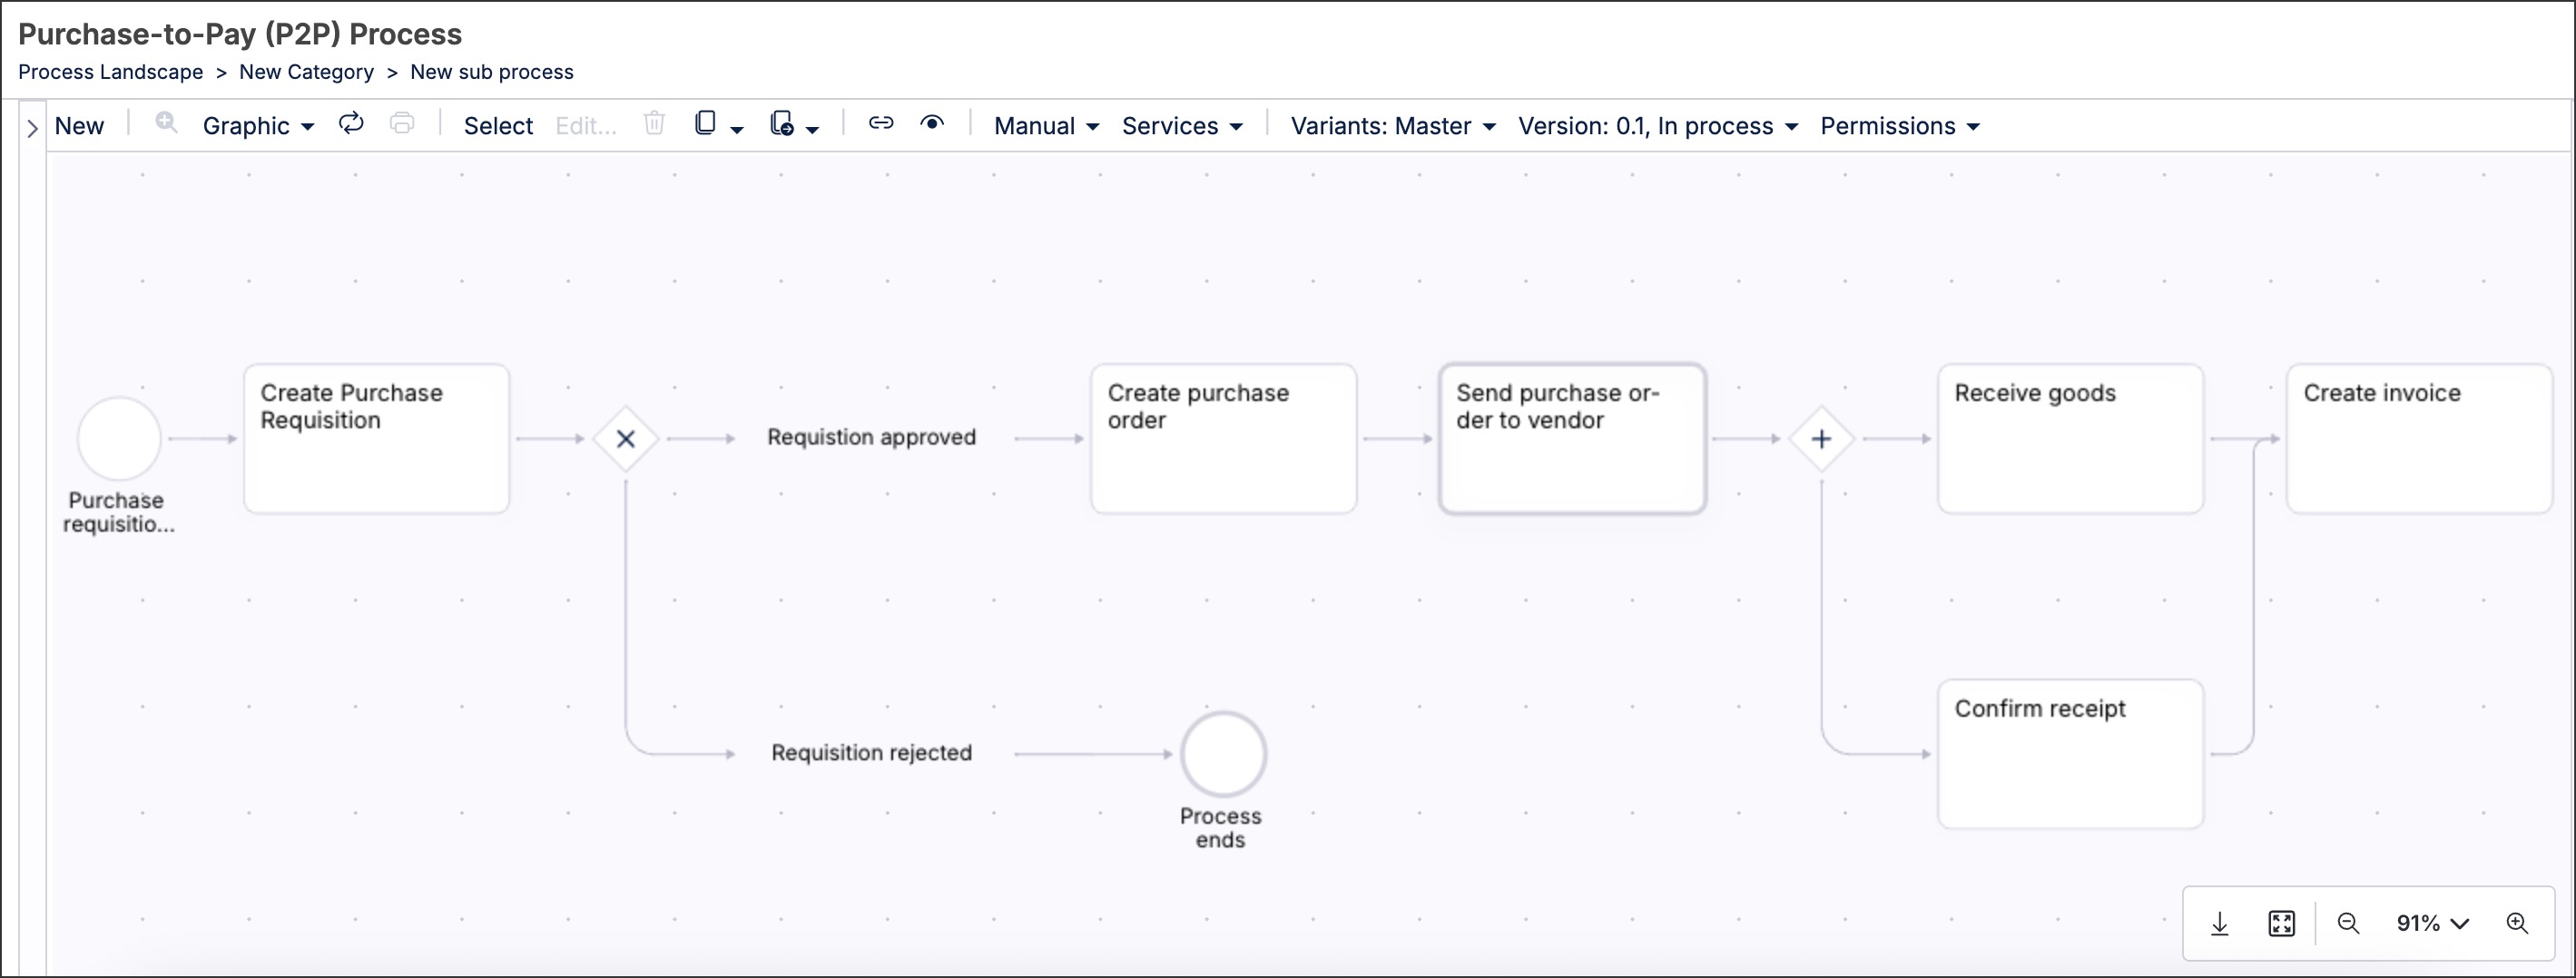
For example, the process canvas has been used to create a purchase-to-pay process graphic:
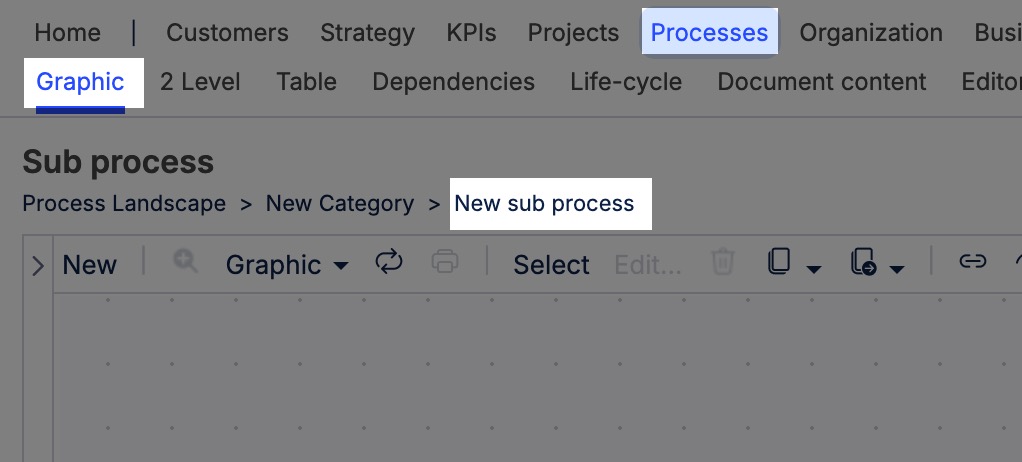
To access the process canvas, click Processes - Graphic and then select the main or sub process you want to create the graphic for:
 |
You then have the following options:
When using the process canvas, you have the following features:
Interactive canvas: You can navigate the canvas by zooming in and out, scrolling, and clicking and dragging the cursor.
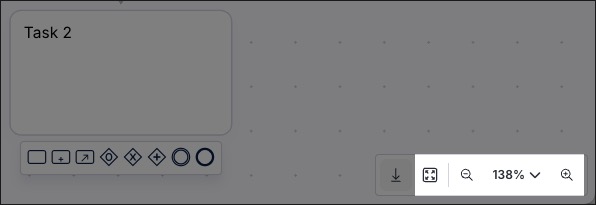
Canvas controls: In addition to using the interactive canvas, you can also use the full screen button and zoom in and out features.
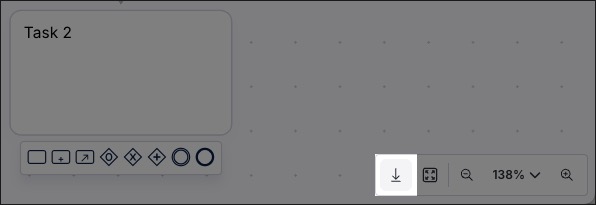
Export SVG file: You can export a SVG file of your process, giving you offline access to a vector image of your diagram. This is a 2D image, meaning that only the process diagram itself is displayed. You can't click into each object or event to see further information.
Switch diagram mode: See Diagram modes / layouts.
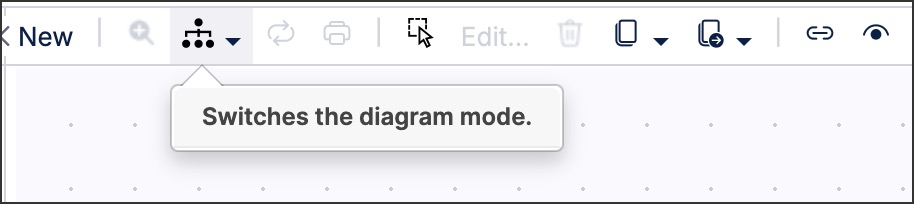
When creating and editing process graphics, you can click the Diagram mode icon and choose from a number of diagram modes / layouts:
|
Included in the available diagram modes / layouts are:
Org / role swimlane - vertical and horizontal: Create a diagram using process pools and swimlanes, allowing you to visualize who or what is responsible for each step in the process. This diagram mode divides the graphic into vertical or horizontal "lanes," with each lane representing a specific participant, department, or system.
When using this diagram mode, the starting graphic looks like this:
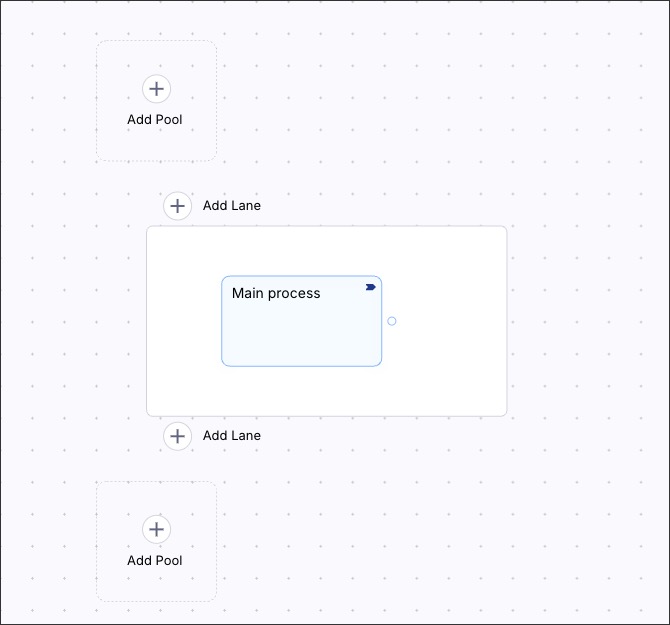
You can then add and delete lanes, pools, process objects, and events as required.
Vertical and horizontal: Choose whether to create a vertical (top to bottom) or horizontal (left to right) process diagram. After the first object or event has been added, your process diagram will be automatically converted into the new diagram mode selected.
In this example, a horizontal diagram has been created:
After choosing your layout, you can then design the process by adding and configuring process events, objects, and gateways.
Depending on whether you're creating a main or a sub process, you have the following available:
Process events - Start, Intermediate, and End
A process event is a key element that triggers, interrupts, or ends a process or sub process. It represents something that happens, either internally or externally, that affects the flow of the process.
You can add start, intermediate, and end process events to your process graphic:
Start: Marks the beginning of a process, for example a customer placing an order.
Intermediate: Occurs during the process and may affect the flow, for example waiting for a supplier confirmation or an email response.
End: Marks the completion of a process or subprocess, for example the invoice has been paid.
Start events
A Start event signifies the beginning of a process and all sub process graphics must include Start events.
You can add a Start event to your process by clicking New - Start:
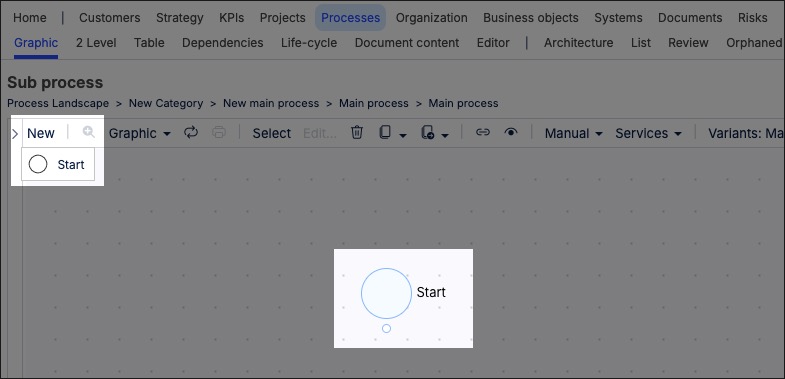 |
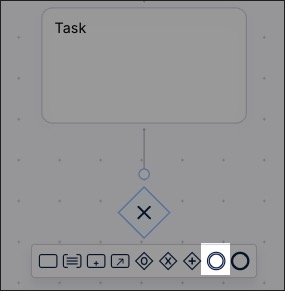
Once the Start event has been added to the process canvas, you can then click the + icon to add further events or objects:
 |
Intermediate events
An intermediate event is a point within a process where something happens that either: Waits for, Receives, Sends, or Interrupts the process before it continues. It does not start or end the process, but it alters the flow while it's running.
Examples of intermediate events include:
Timer event: Waits for a specific time or duration, such as waiting five days for customer payment.
Message event: Receives or sends a message, such as receiving an email confirmation from a supplier.
Error event: Triggers when something goes wrong, such as a payment fails.
Conditional event: Waits until a condition becomes true, such as stock level updated.
Link event: Used to connect different parts of a complex process diagram.
 |
End events
While not mandatory, the last event in process graphics can be the End event. This signifies that the process is complete and there are no more tasks or events expected.
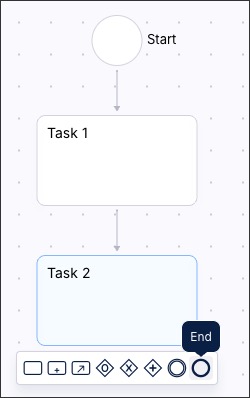 |
Process connectors
You can add and edit connections between process events, objects, and gateways by clicking and dragging the process connector from one element to another:
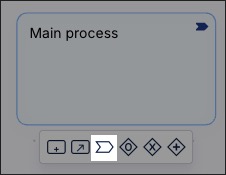
Add main process
Main processes describe the 'what' is being done, as such they document a high level process or the headline for a set of tasks. An example of a main process is 'Order-to-Cash'. This is an end-to-end business process that starts with a customer order and ends with payment collection. It is considered a main process because it: Supports a core business function (sales/revenue generation), spans across multiple departments (sales, finance, logistics, etc.), may include sub processes and interfaces.
Adding a main process to your process graphic creates an additional main process within your category, allowing you to manage that process (including creating a process diagram for it).
For more information about managing main processes, see: Main and sub processes.
 |
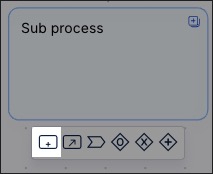
Add sub process
A sub process describes a self-contained process that is at a deeper level than the main process or - in other words - on the execution level and describes the actual activities or "tasks" that are being performed. A sub process can also contain references to other sub processes. Examples of sub processes include 'Manage purchase order' (as part of the Procurement main process).
Adding a sub process to your process graphic creates an additional sub process within your category, allowing you to manage that process (including creating a process diagram for it).
For more information about managing sub processes, see: Main and sub processes.
 |
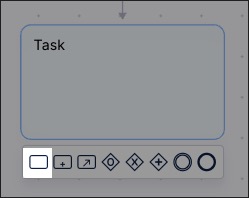
Task
A task is a specific activity or step within a main or sub process — it represents work done by a person, system, or role. Tasks are the lowest-level actions that make up a process flow.
Examples of tasks (in the context of a process) include:
Order-to-Cash (process) - Validate customer order (task)
Product development - Approve product specification
Incident management - Log an IT support ticket
 |
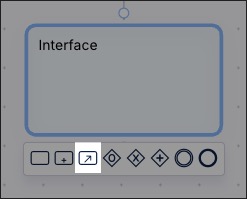
Interface
An interface refers to a defined point of interaction or communication between different processes, systems, or organizations. They help model how information, materials, or responsibilities are exchanged between distinct parts of a business process architecture.
For example - HR runs a process to onboard a new employee. This process involves IT creating system access for the employee. This requires the following example interface in the process:
Name: IT Account Creation Request.
From: HR Onboarding Process
To: IT Access Management Process.
Medium: Internal ticketing system.
Data passed during interface: Employee ID, department, required systems.
 |
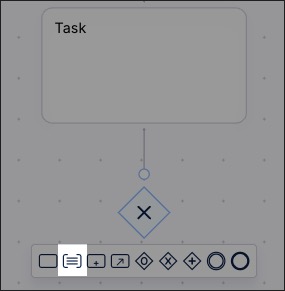
Condition
A condition represents a decision point in a process — a place where the workflow branches based on specific criteria or outcomes. Conditions are critical in making processes dynamic, rule-based, and reflective of real-world decision logic.
For example - in an Order-to-Cash process, you might add a condition after the "Check Customer Credit" step:
If customer credit is approved: Proceed to “Release Order”
If customer credit is denied: Route to “Hold Order and Notify Sales”
Conditions can only be added to a process graphic after a process gateway, such as AND / OR.
 |
Process gateways
Process gateways are used to control the flow of a process — they determine how the path of execution branches, merges, or loops based on certain conditions or events.
You can add and configure three process gateways:
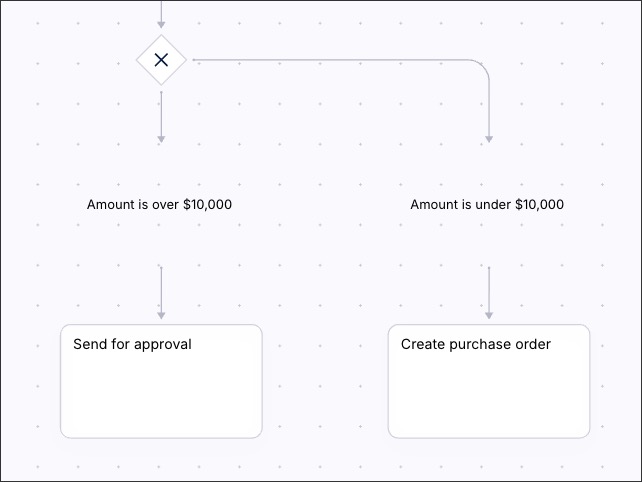
Exclusive gateway (EITHER / OR): The process chooses one path based on a condition. For example, "Is amount > $10,000?". If 'Yes' then an approval is needed, if 'No' then create a process order.
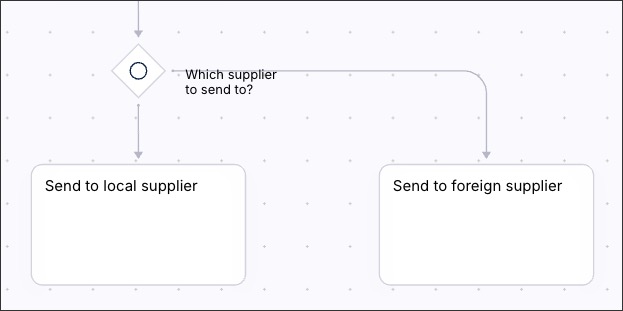
Inclusive gateway (OR): The process can follow one or more paths based on conditions. For example, send to local supplier, foreign supplier, or both.
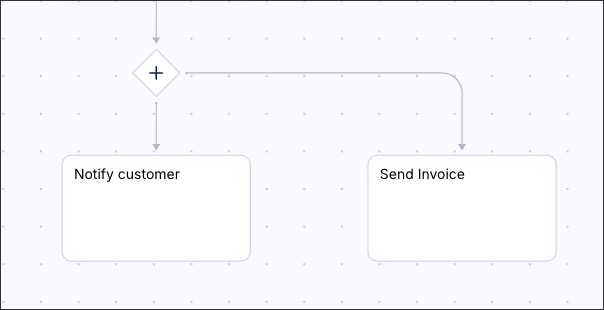
Parallel gateway (AND): The process starts or waits for multiple paths in parallel. For example, send invoice and notify customer simultaneously.