Updating the business logic
The business logic is packaged into formulae (KM KPIs) to reuse in the different parts of the app or inside of other KPIs/formulae to make the setup more concise.
These PQL-statements define the calculations of KPIs, filter statements on your data, and inefficiencies. Hence they are one of the most important parts of the app.
To give you an example, the formula STOCK_HISTORY"."InventoryCurrencyConversion is used both for computing the current Inventory on Hand Value as well as for evaluating Excess Stock Inefficiencies or Turnover Rate. So by adjusting the underlying business logic in that one place, you adjust the business logic for all KPIs and related definitions at once.
This list is not exhaustive and should be checked inside of the Knowledge Model. Make sure to also check nested formulas that might be used within the listed KPIs below. You can identify by the prefix whether it’s defined as KPI or formula.
KPI ID | Formula description |
|---|---|
MARC"."IsStockout | Identifies a Stockout if Inventory on Hand and Consignment Stock are zero while Safety Stock is greater than zero. |
MARC"."IsUnderStock | Identifies Under Stock if Inventory on Hand is between zero and Safety Stock of if Inventory on Hand is zero while there is still Consignment Stock available. |
MARC"."IsExcessStock | Identifies Excess Stock if Excess Inventory Rate is greater than zero but smaller than 100%. |
MARC"."IsObsoleteStock | Identifies Obsolete Stock if Excess Inventory Rate equals 100% and there is no future demand. |
MARC"."IsUntouchedStock | Identifies Untouched Stock as minimum unsold stock level if said minimum is greater than Safety Stock. |
MARC"."InventoryClassification | Computes overall Inventory Classification. |
PLAF"."IsOpen | Identifies open Planned Orders |
EBAN"."IsOpen | Identifies open Purchase Requisitions |
EKPO"."IsOpen | Identifies open Purchase Orders |
AFPO"."IsOpen | Identifies open Production Orders |
VBAP"."IsOpen | Identifies open Sales Orders |
EKPO"."ReceivedOutcomes | Indicates if a Purchase Order was received early, on time, or late. Used to compute Supplier Reliability KPIs. |
AFPO"."ReceivedOutcomes | Indicates if a Production Order was completed early, on time, or late. Used to compute Production Adherence KPIs. |
VBAP"."IssuedOutcomes | Indicates if a Sales Order was shipped early, on time, or late. Used to compute Service Level KPIs. This logic is identical to the “On Time Deliveries” found in our Order Mgmt. apps. |
While Stockout and Under Stock scenarios rely on “hard values” like no inventory or a certain Safety Stock, the threshold for Excess or Obsolete Stock is determined dynamically based on actual replenishment lead times and consumption. This threshold is referred to as “Target Stock”.
KPI ID | Formula description |
|---|---|
MARC"."ExcessInventoryRate | Share of Excess in a material’s inventory. |
MARC"."TargetStockLevel | Threshold to Excess Stock. Computed by adding current Safety Stock to Initial Stock (sometimes also referred to as Cycle Stock). |
MARC"."SumConsumptionQuantity | Total of consumed quantity for a material in a given time period. |
EKPO"."ActualPurchaseLeadTime | Lead time of an individual Purchase Order. |
AFPO"."ProductionLeadTime | Lead time of an individual Production Order. |
In case you update the underlying business logic or used variables, please make sure to also update the documentation for the business users in the Documentation folder.
Adjusting the Knowledge Model in General
In the Knowledge Model, we use variables and formulas to provide better maintainability as well as permit the bulk change of values. During the first setup of the app, you need to check both the variables and formulas. You should start by validating and adjusting the variables and then validating and adjusting the formulas.
To perform the validation, align with your customer’s SAP IT Business Partner and Process Owner. They have knowledge about the data structure and are aware of customizations that might need to be included.
To validate the PQL statements of the variable/ formula, use analysis in the same Data Model, copy and paste the PQL statements into it and validate the results with your SAP IT Business Partner.
If required, adjust the variable/formula in the Knowledge Model by:
Copying relevant code in View mode.
Entering Edit mode and pasting your selection.
Adjusting the formula/KPI according to your preferences/needs.
Notice
Links to the formula /KPI from dependent areas, such as filters for tasks and views, flags for inefficiencies, or KPI definitions, are automatically updated. This does not hold for changes made in the dependent Knowledge Model. If a customization is also to be used in other Inventory Management apps, the change must be transitioned to the Master Knowledge Model in the IM Starter Kit.
Although it uses many new studio components, all calculations (such as Filters, KPIs, Variables, Charts, and Tables) are still based on PQL within the Knowledge Model. If you get any error messages, you can narrow them down to the respective PQL-statement and test your code in an analysis or view to check if you have any syntax errors.
Inventory Projection - Approach using UNION_ALL()
The IM Control Center enables you to not just explore how your inventory has developed in the past, but it also gives you a glimpse of how said inventory will develop in the future based on current orders.
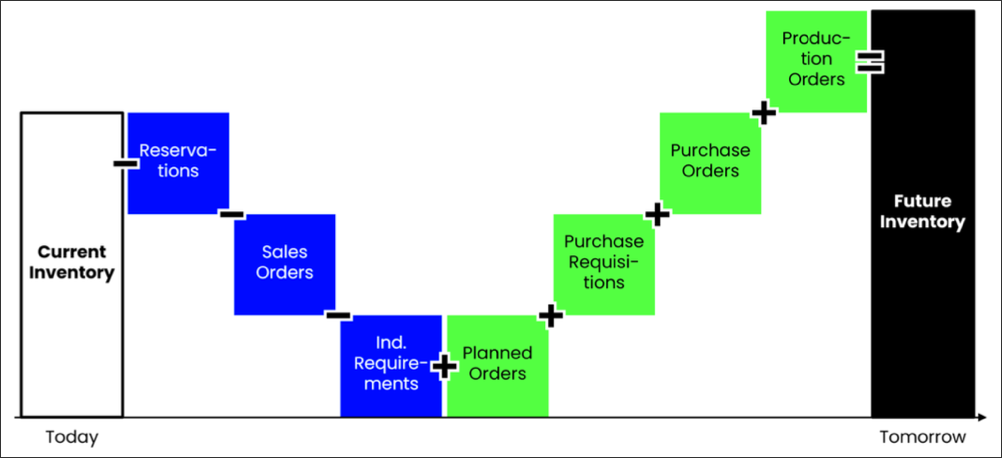
To achieve this, the following (order) objects are considered:
Current inventory on hand
Planned Orders
Purchase Requisitions
Purchase Orders
Production Orders
Reservations (sometimes referred to as Dependent Requirements)
Sales Orders
Independent Requirements
Warning
This logic does not include Scheduling Agreements from both the Purchase to Pay and the Order to Cash by default.
Scheduling Agreements are currently not part of either connector and are thus not represented in the Inventory Management data model due to lack of the relevant tables. They can be added as a customization.
From a conceptual standpoint, the starting point is always today’s inventory. Any outgoing future orders will be subtracted while incoming orders will be added to compute a future inventory:
 |
The required tables are combined at runtime rather than in the data model. Instead, the PQL-operator UNION_ALL() is used to create a record combining all the required tables at runtime.
Ultimately, one UNION_ALL()-object (record attribute or KPI) is required for every relevant field. The “shared columns” used to identify a unique instance of this virtual record consist of the following fields:
System Client
Material Number
Plant
Order Number
Order Position
Order Type
Creating this set of columns requires a total of six separate UNION_ALL()-objects - one for each field.
Notice
Filters on e.g. a material used in the UNION_ALL()-object will propagate to all connected tables. I.e. out of all tables referenced by the UNION_ALL()-object, only those entries will be shown which reference the filtered material (or any other attribute used as a filter).
A limitation of the operator is that currently at most eight tables can be leveraged. Thus, if you plan to add additional order types during your implementation project, you may need to either drop existing order types from the logic or combine the tables for the new order types with those of existing orders (e.g. combining EKET and EKEH if you plan to integrate Purchase Scheduling Agreements).
UNION_ALL()-objects can contain either references to a specific table or other KPIs computed by Celonis using Pull Up Aggregation.
Conceptually, a single UNION_ALL()-object is created as shown below:
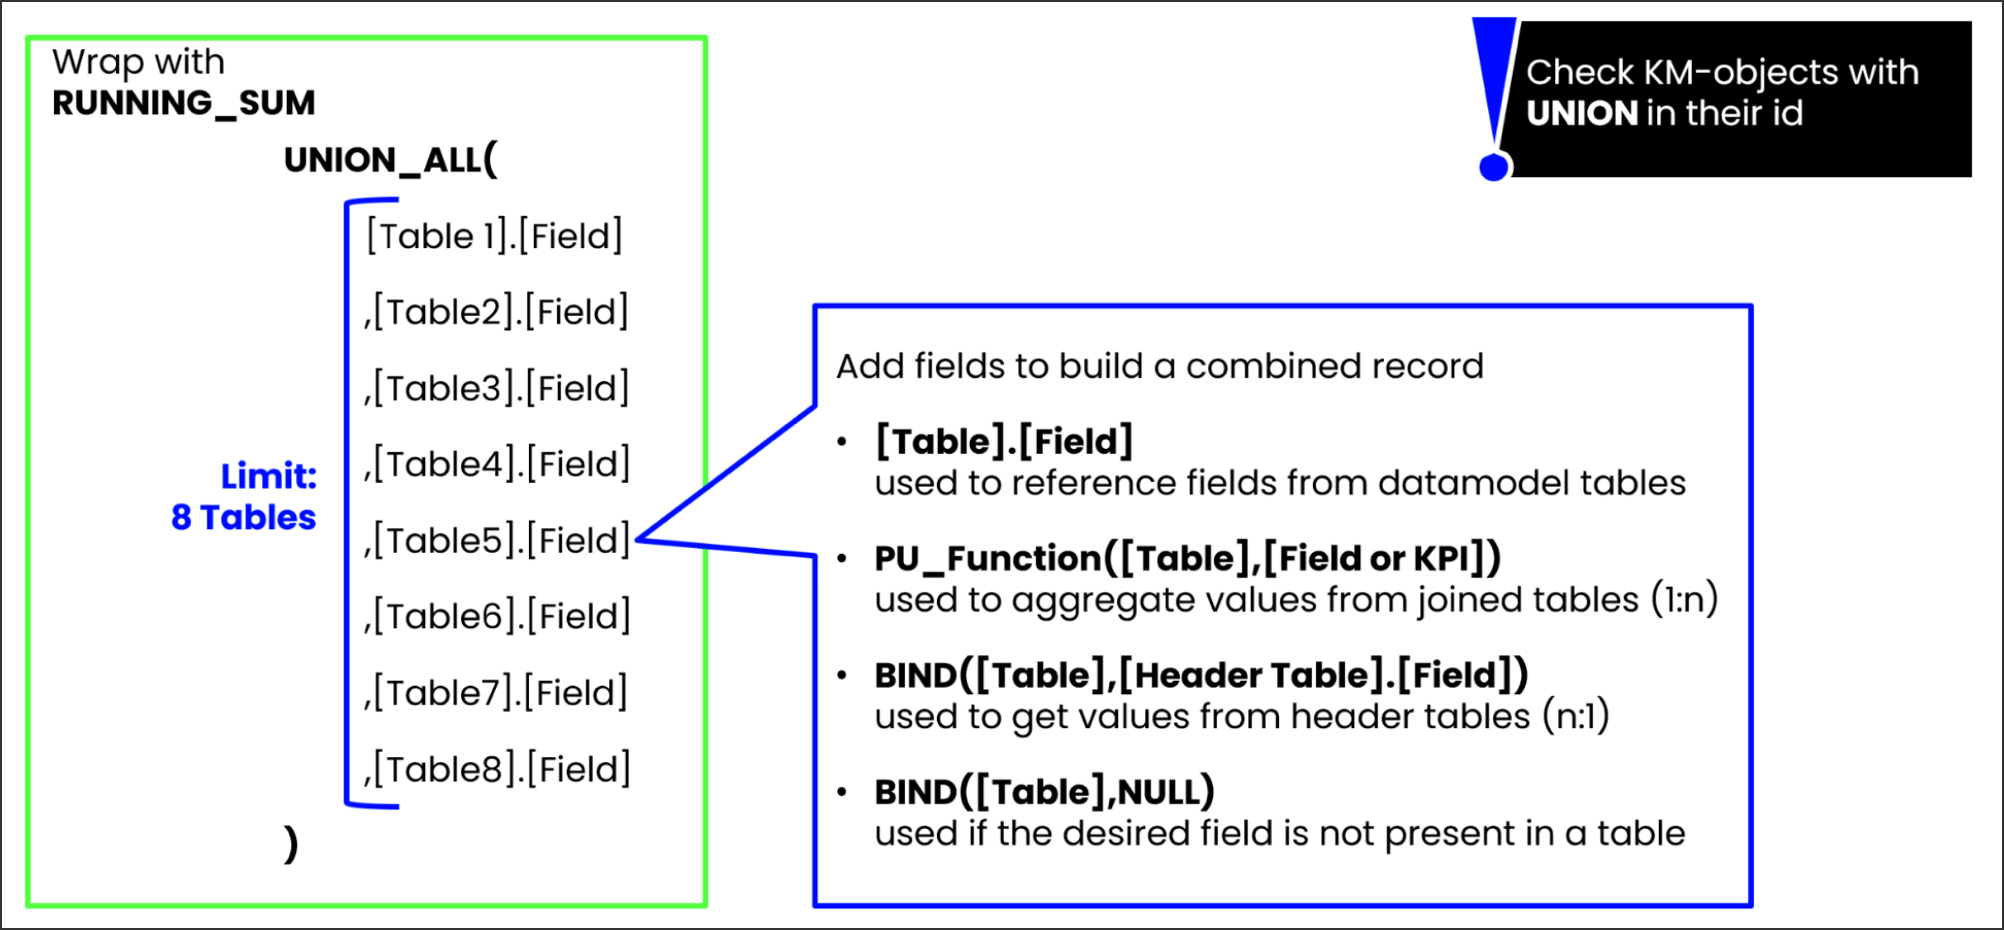 |
To obtain the Inventory Projection, the UNION_ALL()-object containing the relevant quantity fields is then wrapped by the RUNNING_SUM()-operator. This covers a single Material-Plant combination.
To compute an aggregated Inventory Projection -e.g. on the level of Material Group or Plant- the RUNNING_TOTAL()-operator is used instead.
The combined record created in this manner can be used to compute KPIs such as “Days until Stockout”.
The results provided by it are however quite expensive as far as computational performance is concerned. It is therefore recommended to use alternatives where possible.
Warning
The result of this calculation is typically similar to the output of your MRP run as e.g. displayed in SAP's MD04 transaction.
Due to recent manual changes by MRP-planners or the data load schedule in Celonis in general, minor deviations are to be expected. The goal is not to replicate MD04 1:1 at all times but to leverage inventory projections for aggregated analysis of future developments and prioritization of respective materials.
Inventory Projection - Visualization using TIMELINE_COLUMN() and TIMELINE_TABLE()
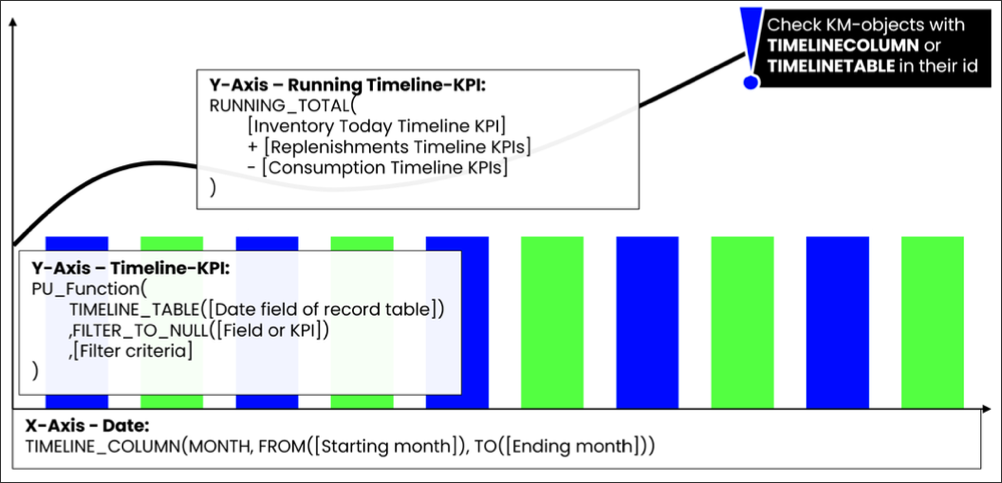
To address the aforementioned impact on computational performance, visualizations of the Inventory Projections should in most cases be handled using the TIMELINE_COLUMN() and TIMELINE_TABLE() operators instead.
Both operators are required to create a date field as well as actual KPIs. The assets required to populate a chart are introduced below:
 |
Notice
TIMELINE_COLUMN() and TIMELINE_TABLE() generate a virtual table at runtime which is used to populate e.g. chart components. This virtual table is not connected to any tables in your data model and can therefore not be used to compute additional KPIs.