Views customization
In the below section, we will have a look at the best practices on how to customize the application. Outside of the base and chart views, no view is fully self-contained.
If something should be updated throughout the whole application, one of the Base views is the place to start in most situations (= bulk update). If a specific view should be customized, the content view itself is the place to go (=individual update).
Base updates (bulk update)
As all components and layout in the Base View are inherited to the extending Views, all updates performed in the Base View are populated to the extending views. If the extending views have overwritten the configuration or the layout already, the update is ignored in the extending view. Hence updating the Base is a powerful way to change general patterns in the application.
So let’s have a look at a few examples:
Update layout
Let’s assume that the KPI List should be removed for all Inefficiency Views.
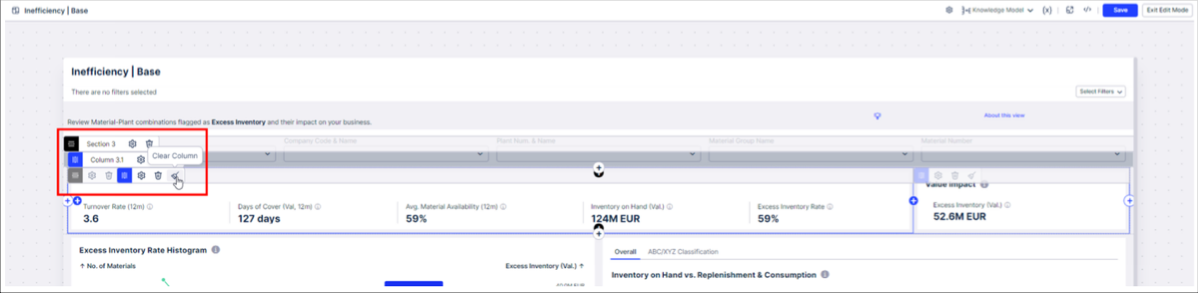 |
To do this, navigate to the Base View “Inefficiency | Base” and click on “Edit Mode”
Navigate to the KPI list and click on the “broom” saying “Clear Column”. Click on save and leave the edit mode.
If you navigate to the extending views (e.g. “Inefficiency | Excess Stock”), you will see that the KPI list is gone.
Update components
The update of components works very similarly. So let’s assume you want to adjust the KPI list not to show some KPIs.
 |
To do this, navigate to the Base View “Widget | Base” and click on “Edit Mode”.
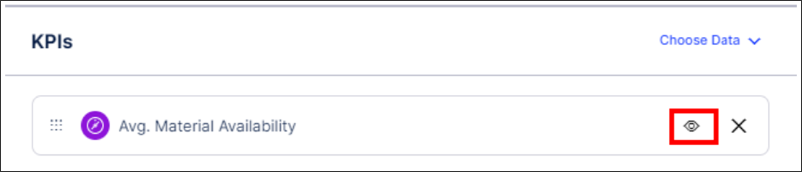
Navigate to the KPI list and click on “Edit Component”.
Click on “Hide” for the items you want to hide.
Click on save and leave the edit mode. If you navigate to extending views, you will see that all extending views show only the KPIs defined in the base view.
Extension updates (content view)
While the updates in the Base views provide potent updates to the general structure, it is still essential to customize the individual view to show the most relevant information. While the App does not do this out of the box, it is entirely possible to have different layouts across tabs.
In case specific views should be updated individually, you should navigate to the Tabs folder and look for the respective view.
Creating a new Extension View from a Base
To better understand the advantages of the Base/ Extension concept, the following section explains how to create an entirely new view focusing on a specific set of KPIs as defined in the Knowledge Model.
Therefore, the already mentioned methods around Base/Extension Views are used to build a new basic view.
To simplify the process, the following example will use some existing KPIs coming from the Knowledge Model that will result in a view allowing the business user to analyze the development of the “Supplier Reliability” as well as the “Amount affected Purchase Orders”. This will also work with any other KPI created in the Knowledge Model.
To do this, first of all, create a new view in the same package where we store the other views of the CC App called “Supplier Reliability” (as an example) by clicking on the “+” icon in the “Widgets” folder.
Select the Knowledge Model from the Dropdown and select the View “Widget | Base” as the Base View for the new Extension View. Once the Base for the “Supplier Reliability” view is selected, clicking the create button shows an exact copy of the base view in the Edit Mode.
Switching to the YAML editor by clicking on the “< >;” button in the top right corner results in basically an empty view without any Layout or Component definitions. All components you see in the View are inherited from the Base View. So far, nothing was overwritten by the Extension.
To adapt the content to show the mentioned KPIs, all we need to do is change/ add a few KPIs in the components.
These would be:
KPI list
Trend chart
Treemap chart
Once made the changes to the Base View, you can add new tables, charts depending on what you want to show for the Supplier Reliability View.