Analysis - Process Explorer (Full Screen)
Analysis - Maintenance only
Effective August 1st 2025, Analysis features can no longer be purchased as part of a Celonis Platform license. Celonis continues to maintain Analysis (by fixing bugs and ensuring that performance remains strong) but no further feature development will take place.
You can migrate your existing Analysis assets to our enhanced Studio Views, giving you access to our intuitive View creation capabilities. To learn how to migrate your existing Analysis to Studio Views, head to: Migrating Analysis to Views.
And for an overview of our enhanced Studio features, see: Studio feature availability matrix.
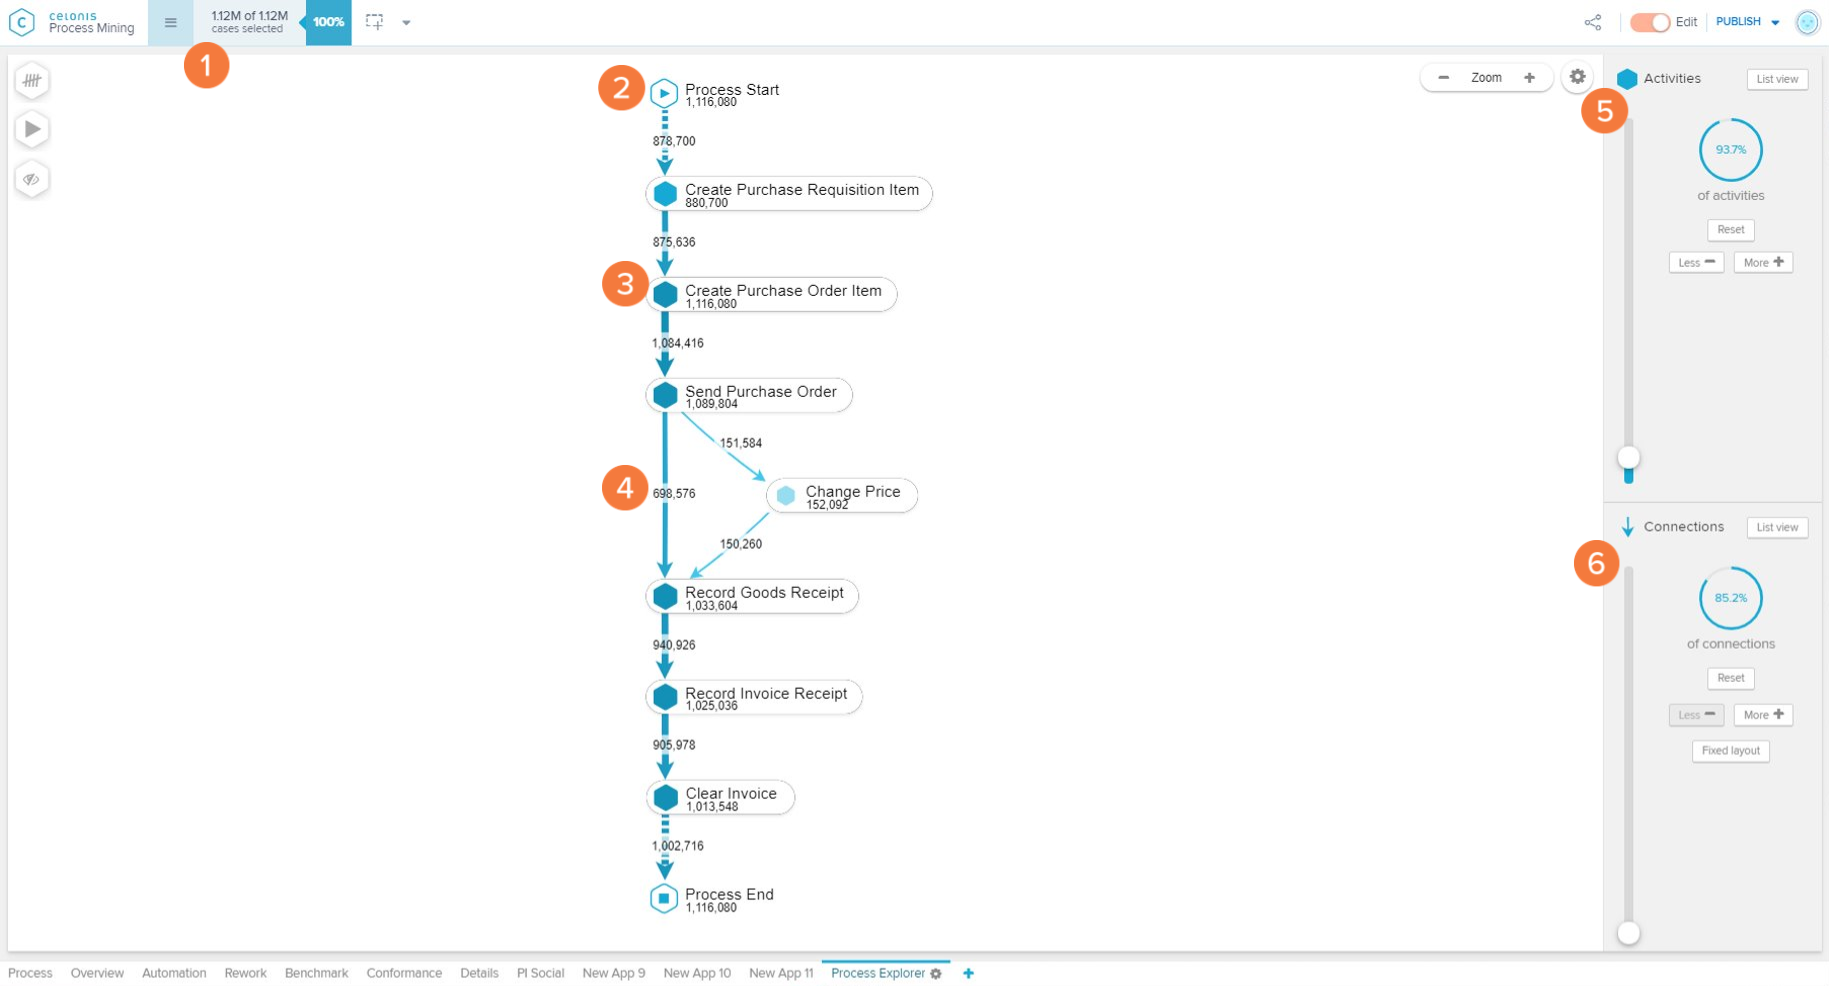
The Process Explorer is the core element of Celonis 4, a powerful instrument that enables the visualization and analysis of processes.
Structure and navigation
 |
 |
Frequency Icon
The options contained in the Frequency icon
Case Frequency: number of unique case keys associated with an activity or connection.
Activity Frequency: number of events associated with an activity or connection.
Throughput Time (Median): value separating the distribution of throughput times associated with a connection in two equal halves.
Throughput Time (AVG): average value of throughput times associated with a connection.
Throughput Time (Trimmed mean): calculation of the mean without taking into account the highest and lowest sets of values.
The Process Explorer was designed to show processes in the most intuitive and flexible manner: as a process model.
Process map: the process map is the main component of the process explorer. It contains a graphical interface that displays the activities, their transitions, and metrics.
Baseline graph: the baseline graph is mainline that connects the Process Start to the Process End. It represents the most frequent end-to-end variant of the process.
Variant: a variant is a sequence of activities from process start to process end.
Sub variant: a sub-variant is a sequence of 4 activities that occur in the process.
Node: each activity in the process is displayed as a node. Every node will show the total number of cases passing through it.
Edge: each transition (connection) between activities is displayed as an edge. Every edge also shows the total number of cases passing through it. Edges can also be configured to adapt their thickness according to that number (highly frequented edges will be thicker than less frequented ones).
Activities: the Activities panel controls the coverage of activities displayed in the Process Map. By increasing the number of activities, new nodes and their corresponding edges are displayed in the Process Map.
Sliders and Buttons: The covered data can be adjusted with the slider and buttons on the right ('Less', 'More', and 'Reset').
List view: The list view buttons display the activities as a list and allow the selection of activities you wish to visualize.
Connections: the Connection panel controls the coverage of transitions displayed in the Process Map. By increasing the number of connections, new edges between the existing activities are displayed in the Process Map (no new activity is added, however).
Sliders and Buttons: The covered data can be adjusted with the slider and buttons on the right ('Less', 'More', and 'Reset').
List view: The list view button displays the connections between the displayed activities as a list and allows the selection of connections you wish to visualize.
Fixed Layout: activating this button will prevent the layout of the Process Map to change when new connections are added or removed
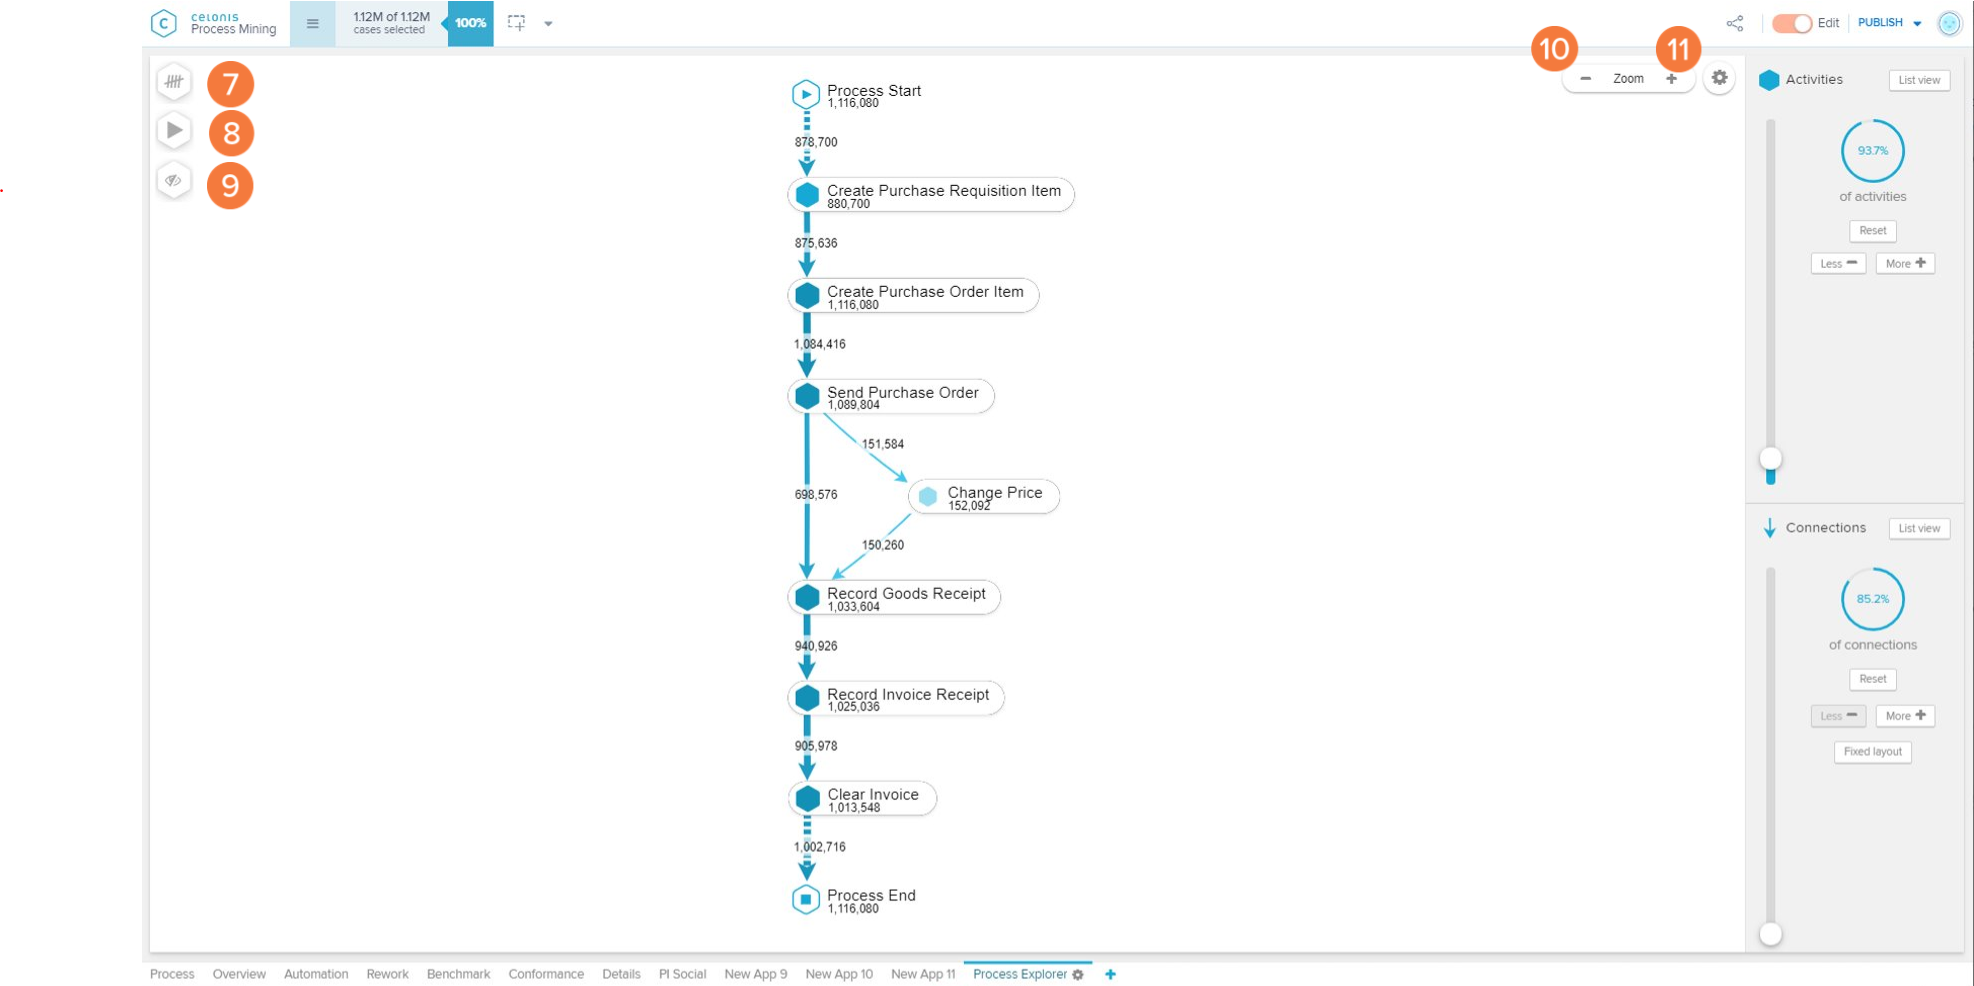
Process Explorer KPI icon: allows the user to select the KPI displayed in the Process Map between 'Case Frequency', 'Activity Frequency', 'Throughput Time (Median)', 'Throughput Time (AVG)', and 'Throughput Time (Trimmed mean)'. The user may also add custom Process Explorer KPIs.
Play icon: starts the process animation (see section 'Process Animation').
Display/Hide icon: allows the user to hide or display the activities currently available in the Process Map. Only the selected activities will be shown in the entire analysis
Zoom: allows the user to zoom out (' - '), zoom in (' + '), or reset the zoom (hover the mouse over the 'Zoom' keyword to visualize the 'Reset' button) of the Process Map.
Settings: allows the user to group activities together and to color activities and activity groups for better process visualization.
Activity Details
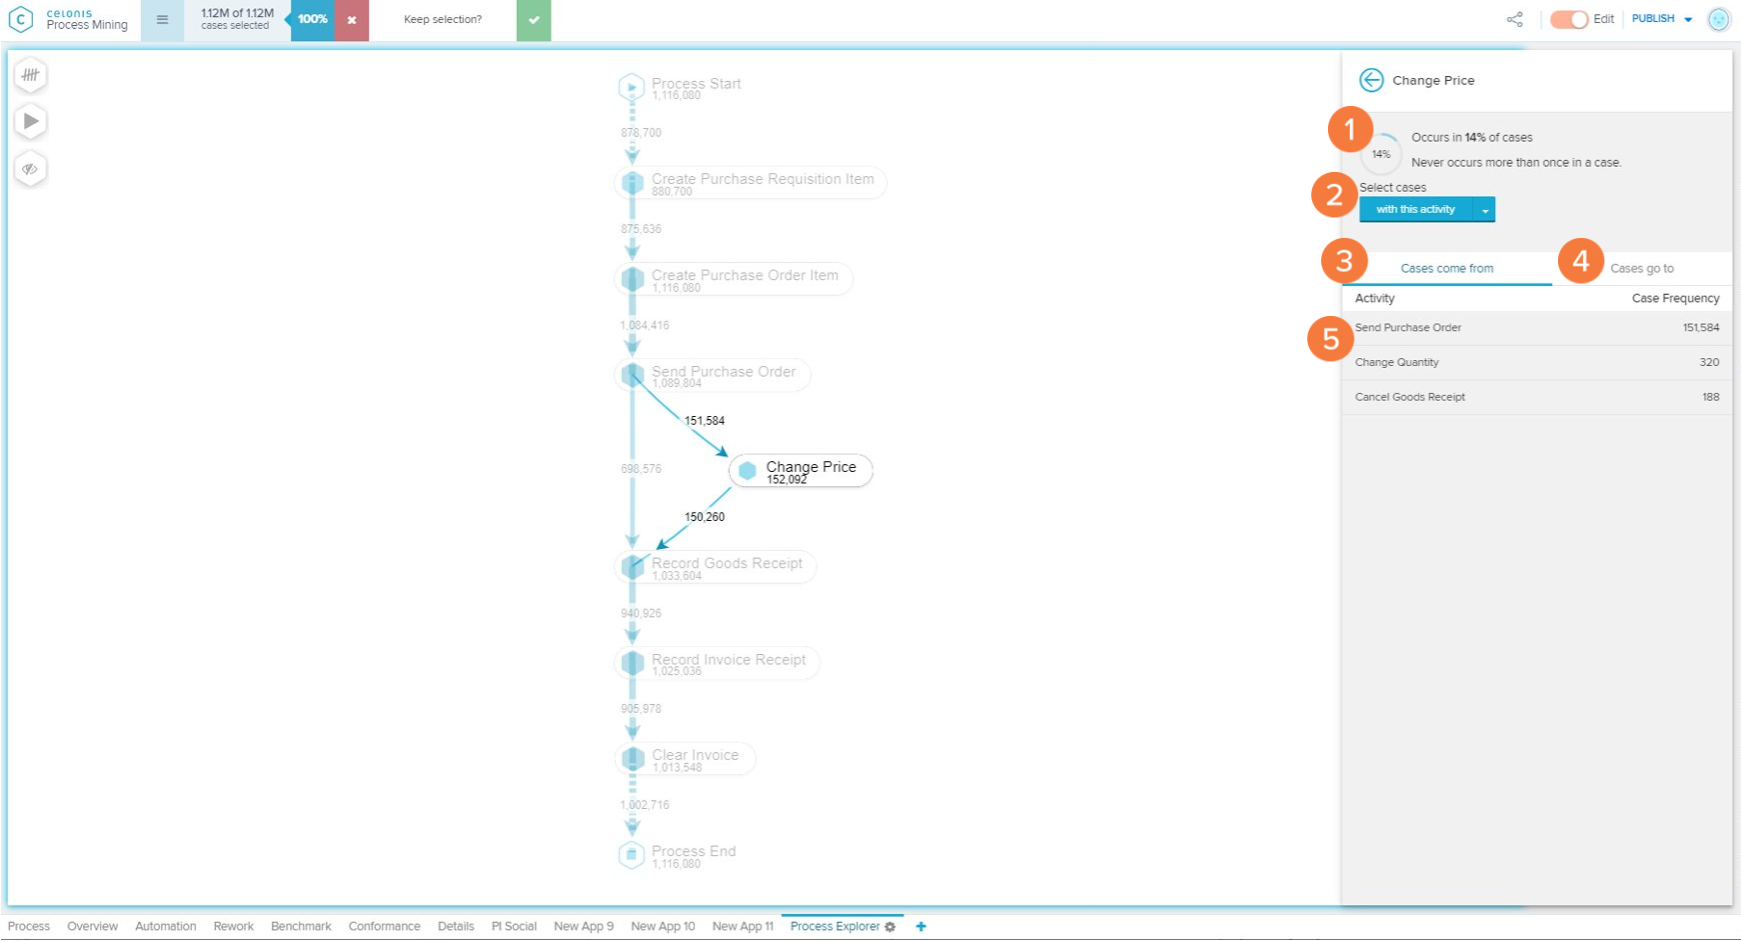 |
The Activity Details screen is displayed when you click on a Node in the Process Map or on an activity in the 'List View' or 'Connection Details' panels.
Occurrence statistics: information about which proportion (in %) of the total cases contain this activity, and how often (in average) does a case that contains this activity passes through it again.
Select cases: filters the analysis according to the activity and the chosen filtering option.
'With this activity: only shows variants that contain the selected activity.
'Without this activity: only shows variants that do not contain the selected activity.
'Starting with this activity: only shows variants that begin with the selected activity.
'Ending with this activity: only shows variants that finish on the selected activity.
Cases come from: this tab contains a list of activities that most commonly precede the selected activity.
Cases that go to this tab contain a list of activities that most commonly proceed with the selected activity.
Activity List: A list of activities that are connected to the currently selected activity. Contains both the name of the activity and the frequency of cases that flow through that connection. Displayed according to the 'Cases come from' or 'Cases go to' tab selection. When an activity is clicked, the user is routed to the Connection Details view.
Connection Details
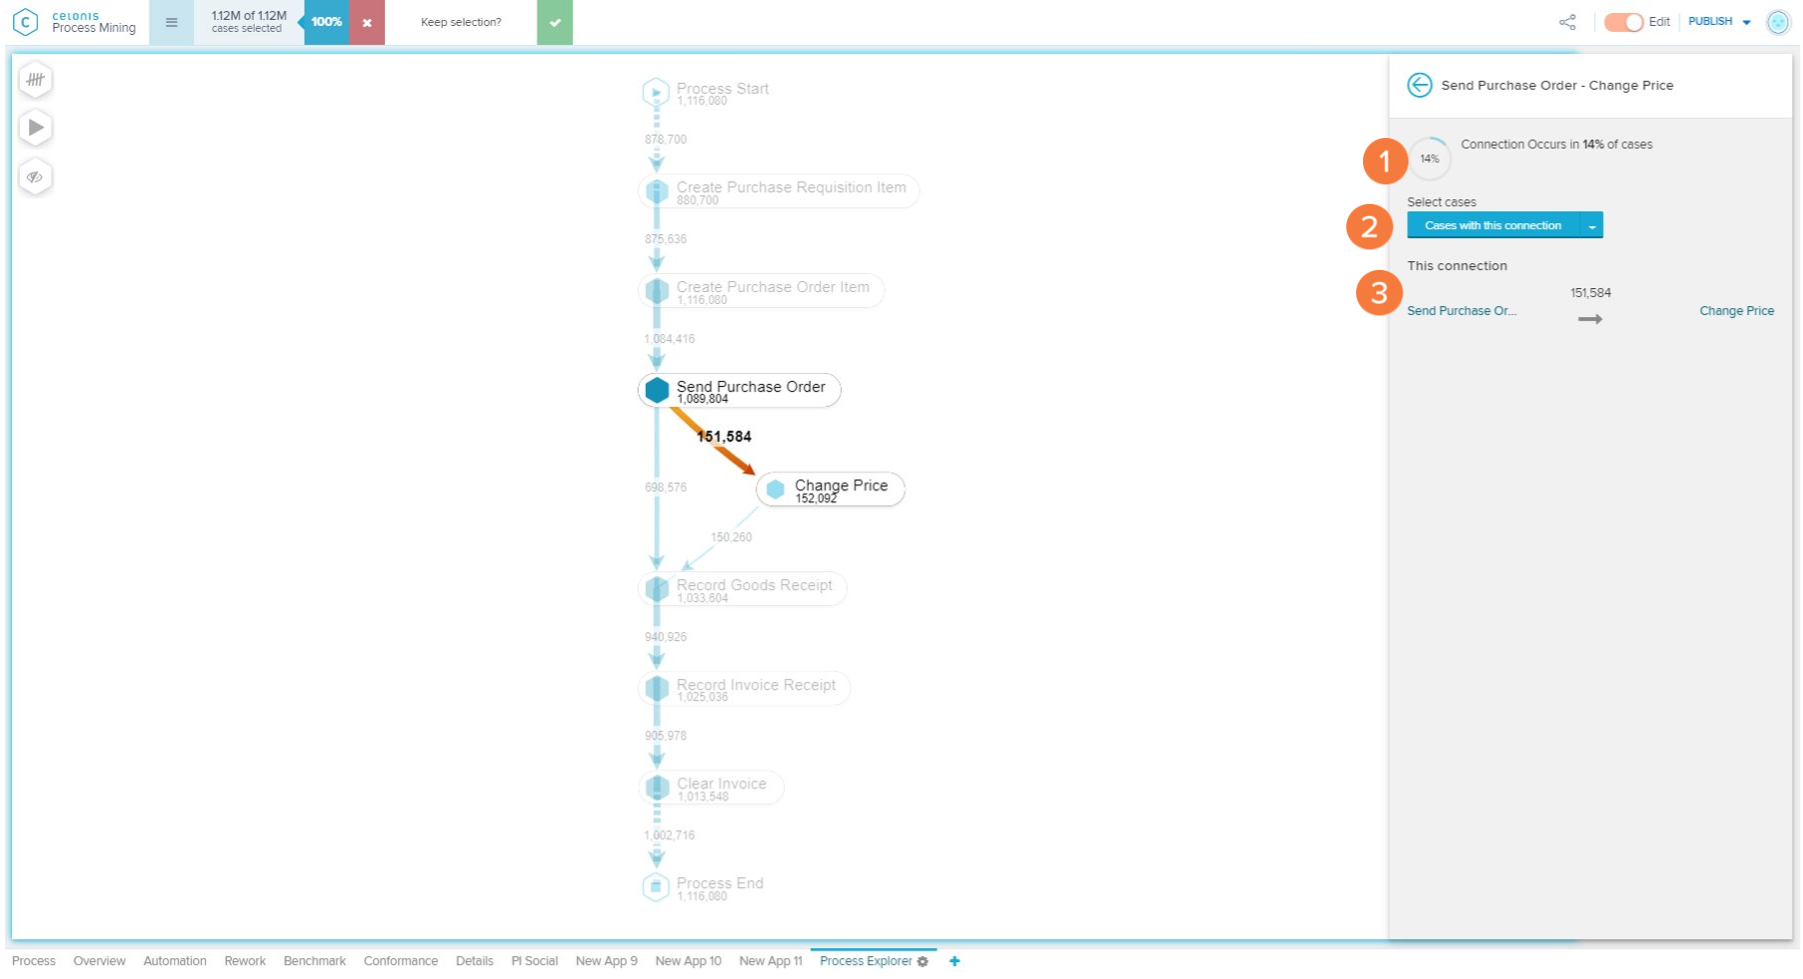 |
The Connection Details screen is displayed when you click on an Edge in the Process Map or on a connection in the 'List View' or 'Activity Details' panels.
Occurrence statistics: information about which proportion (in %) of the total cases contain this connection.
Select cases: filters the analysis according to the connection and the chosen filtering option:
'With this connection': Only shows variants that contain the selected connection.
'Without this connection': Only shows variants that do not contain the selected connection.
This connection: Displays the two activities that compose this connection and the frequency of cases that flow through it. When an activity is clicked, the user is routed to its Activity Details view (see 'Activity Details' section).
Process Animation
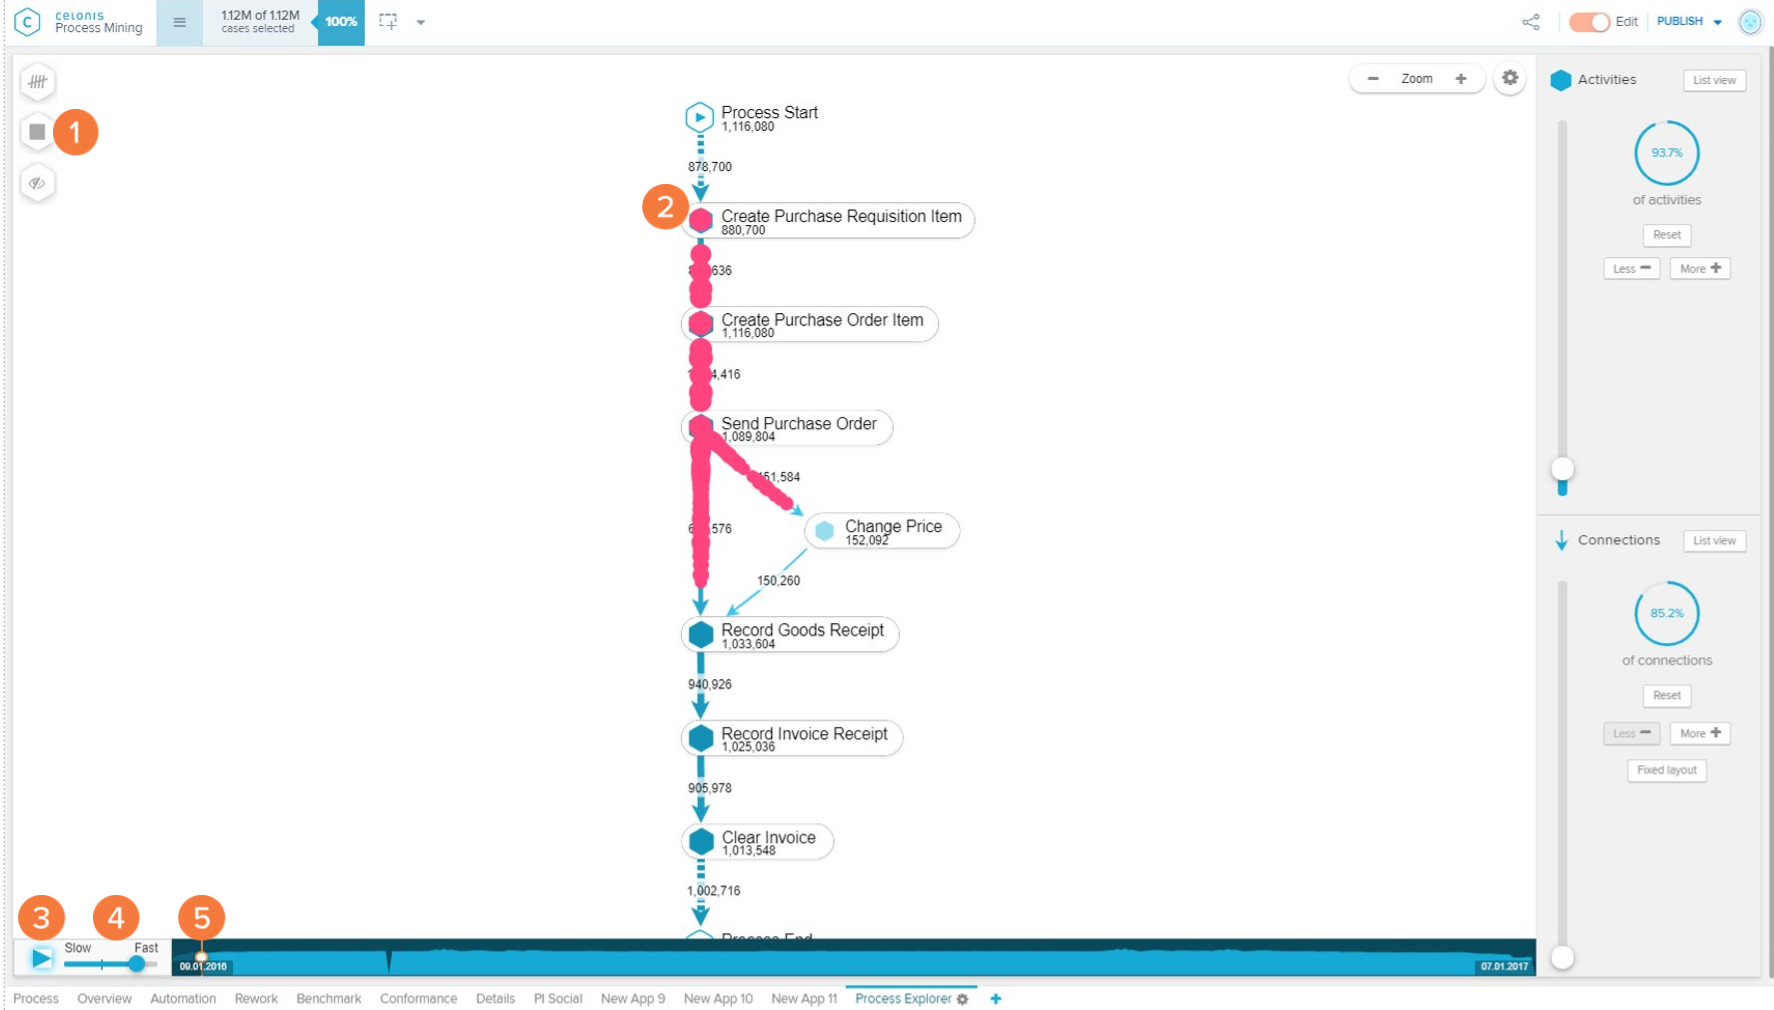 |
The Process Animation displays an animation of how your cases flow through the different activities and connections.
Play icon: Starts or stops the Process Animation. The user can select how the cases will be grouped for animation between 'Group by day', 'Group by hour', and 'No grouping'.
Animation bubble: The cases are represented by animation bubbles (
 ) of different sizes. The size of the bubbles displays the number of aggregated cases. Their speed varies according to their throughput time.
Play/Pause: Plays or pauses the animation.
Speed slider: Varies the speed at which the animation is played.
Animation seeker: Allows the user to seek to a certain point in the animation.