Validating data with Data Explorer
Caution
Data Explorer is in maintenance mode. Only critical issues that significantly impact the functionality will be addressed.
If you previously used Data Explorer, we recommend the enhanced features offered by the following products:
Insight Explorer: Insight Explorer is an AI-powered Studio asset designed specifically to uncover observations from your Knowledge Model. See: Insight Explorer.
Studio Views: Instead of a temporary exploration, you can build a Studio View to act as a permanent data validation dashboard. See: Views.
Knowledge Model (KM) and PQL editor: Since Data Explorer relies on Knowledge Models, you can perform much of the same work directly within the Knowledge Model itself. See: Knowledge Models.
Data validation is an essential part of every Celonis project to secure data quality before handing it over to Data Analysts. After data extractions, transformations, and the creation of a Data Model, Data Engineers can use the Data Explorer to run an effective data validation within a single dashboard.
If you used the Data Explorer for all these validations, you can also directly share the Explorer with the Analyst for them to get familiar with your data model.
Data validation is an essential part of every Celonis project to secure data quality before handing it over to Data Analysts. Here are some ideas on how you can use Data Explorer to make sure that your data is reliable.
The main things that you can check are:
if the data types of the columns are configured correctly,
if the ranges of numbers and dates make sense,
if and where Null values occur, and whether uniqueness is met where needed,
and where outliers occur.
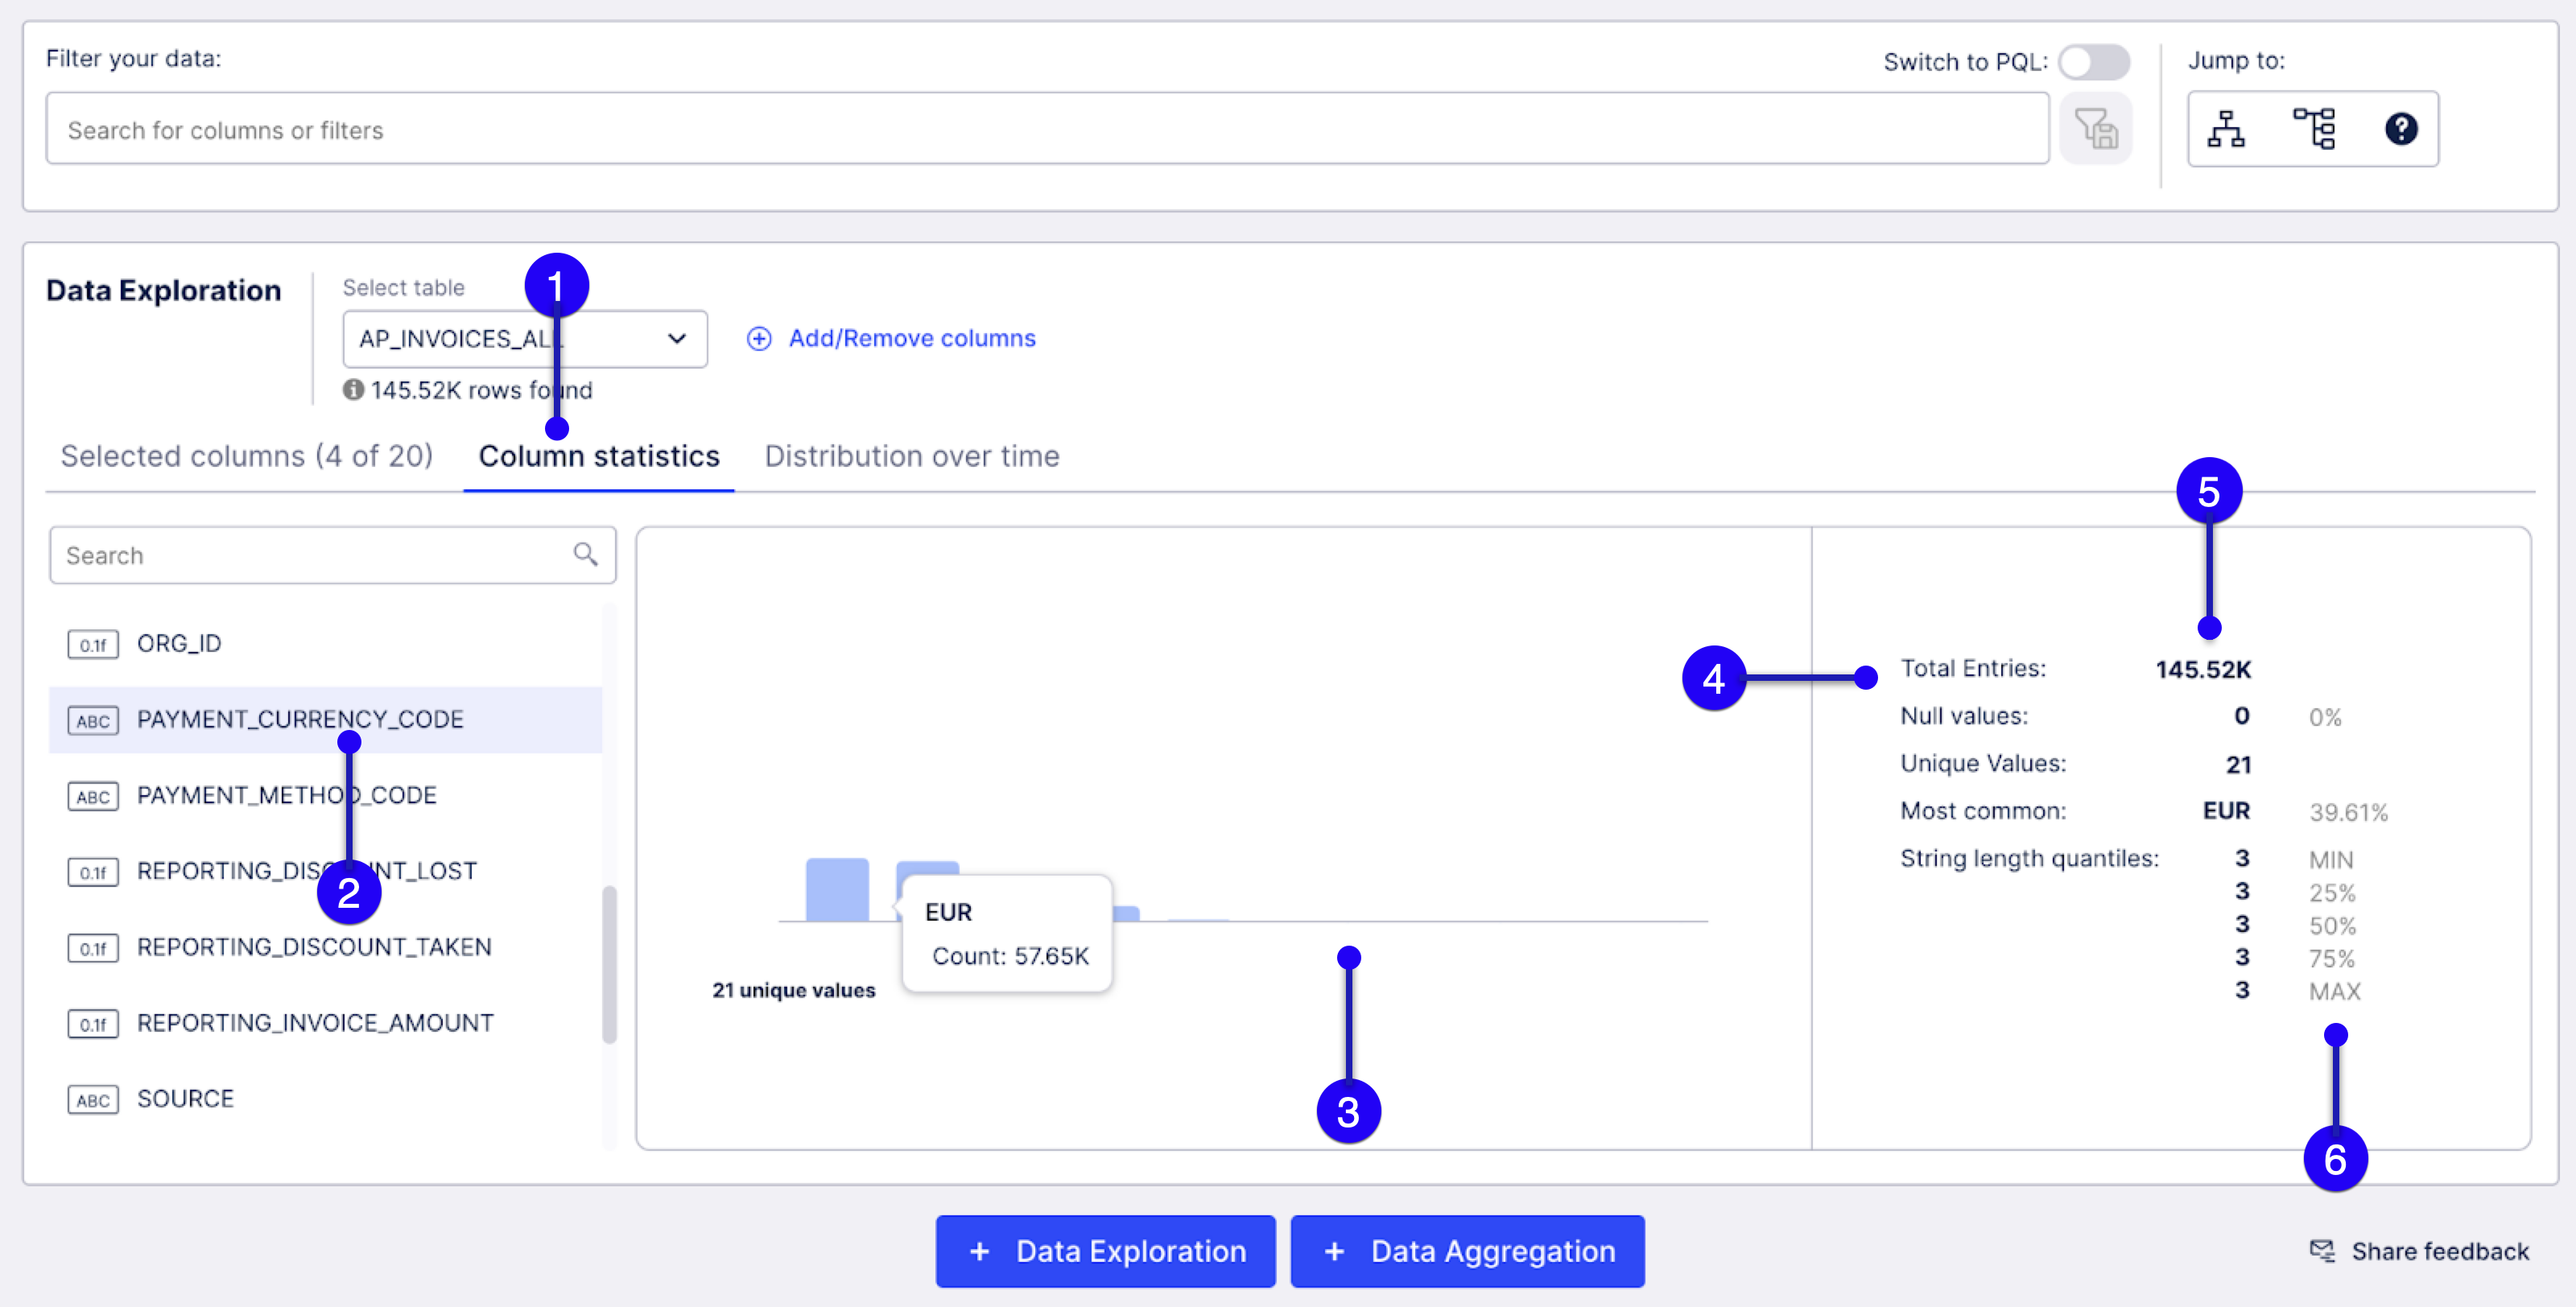 |
Select column statistics.
Select a column.
View the distribution of the top ten values.
Check for null values.
Compare total entries against unique entries.
Validate formatting of your values.
Alternatively, you can validate date columns with the distribution over time tab as it is shown below:
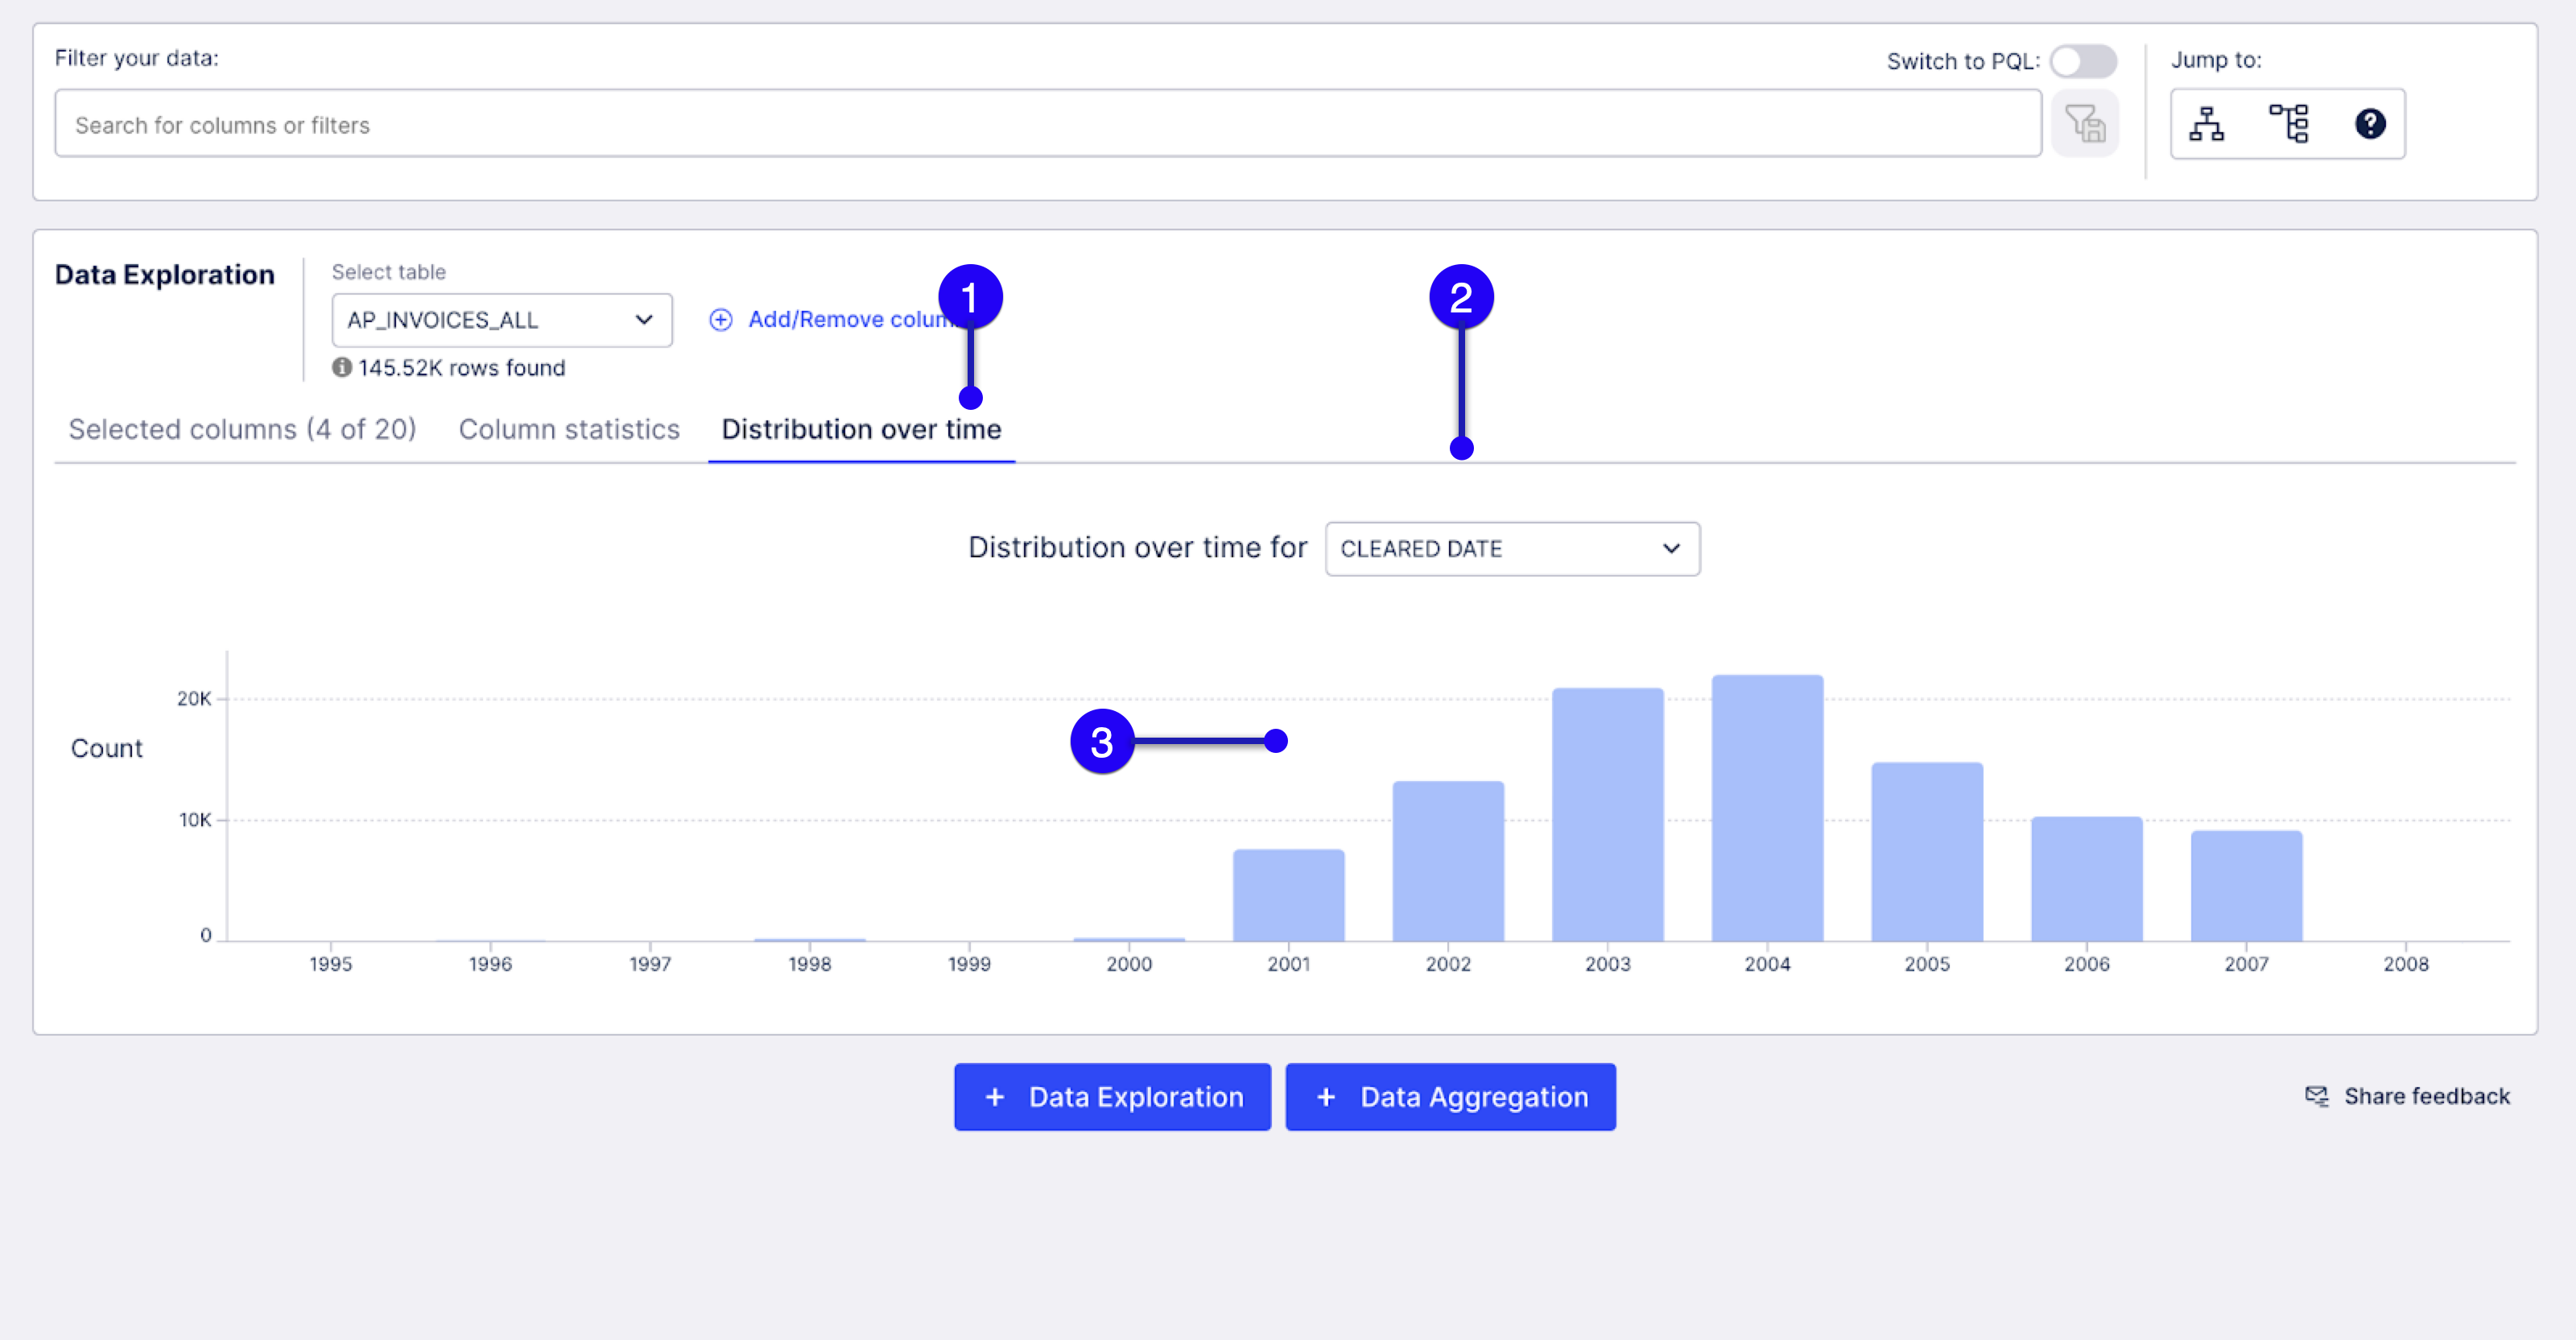 |
Select the distribution over time tab.
Choose the date column in which you are interested.
See the distribution over time for this date column.
After you validate your data, the next step of your journey with Celonis is to create your own PQL queries. The Data Aggregation tile is the right tool for you to start building your queries. The Data Aggregation feature helps you assemble your own PQL queries to add to your Knowledge Model. The visual interface lets you access your tables and data to build aggregations, and you can add custom PQL too. You can save the aggregations in the Knowledge Model as a KPI or attribute, with or without a filter. Below an example of what’s possible within Data Explorer.
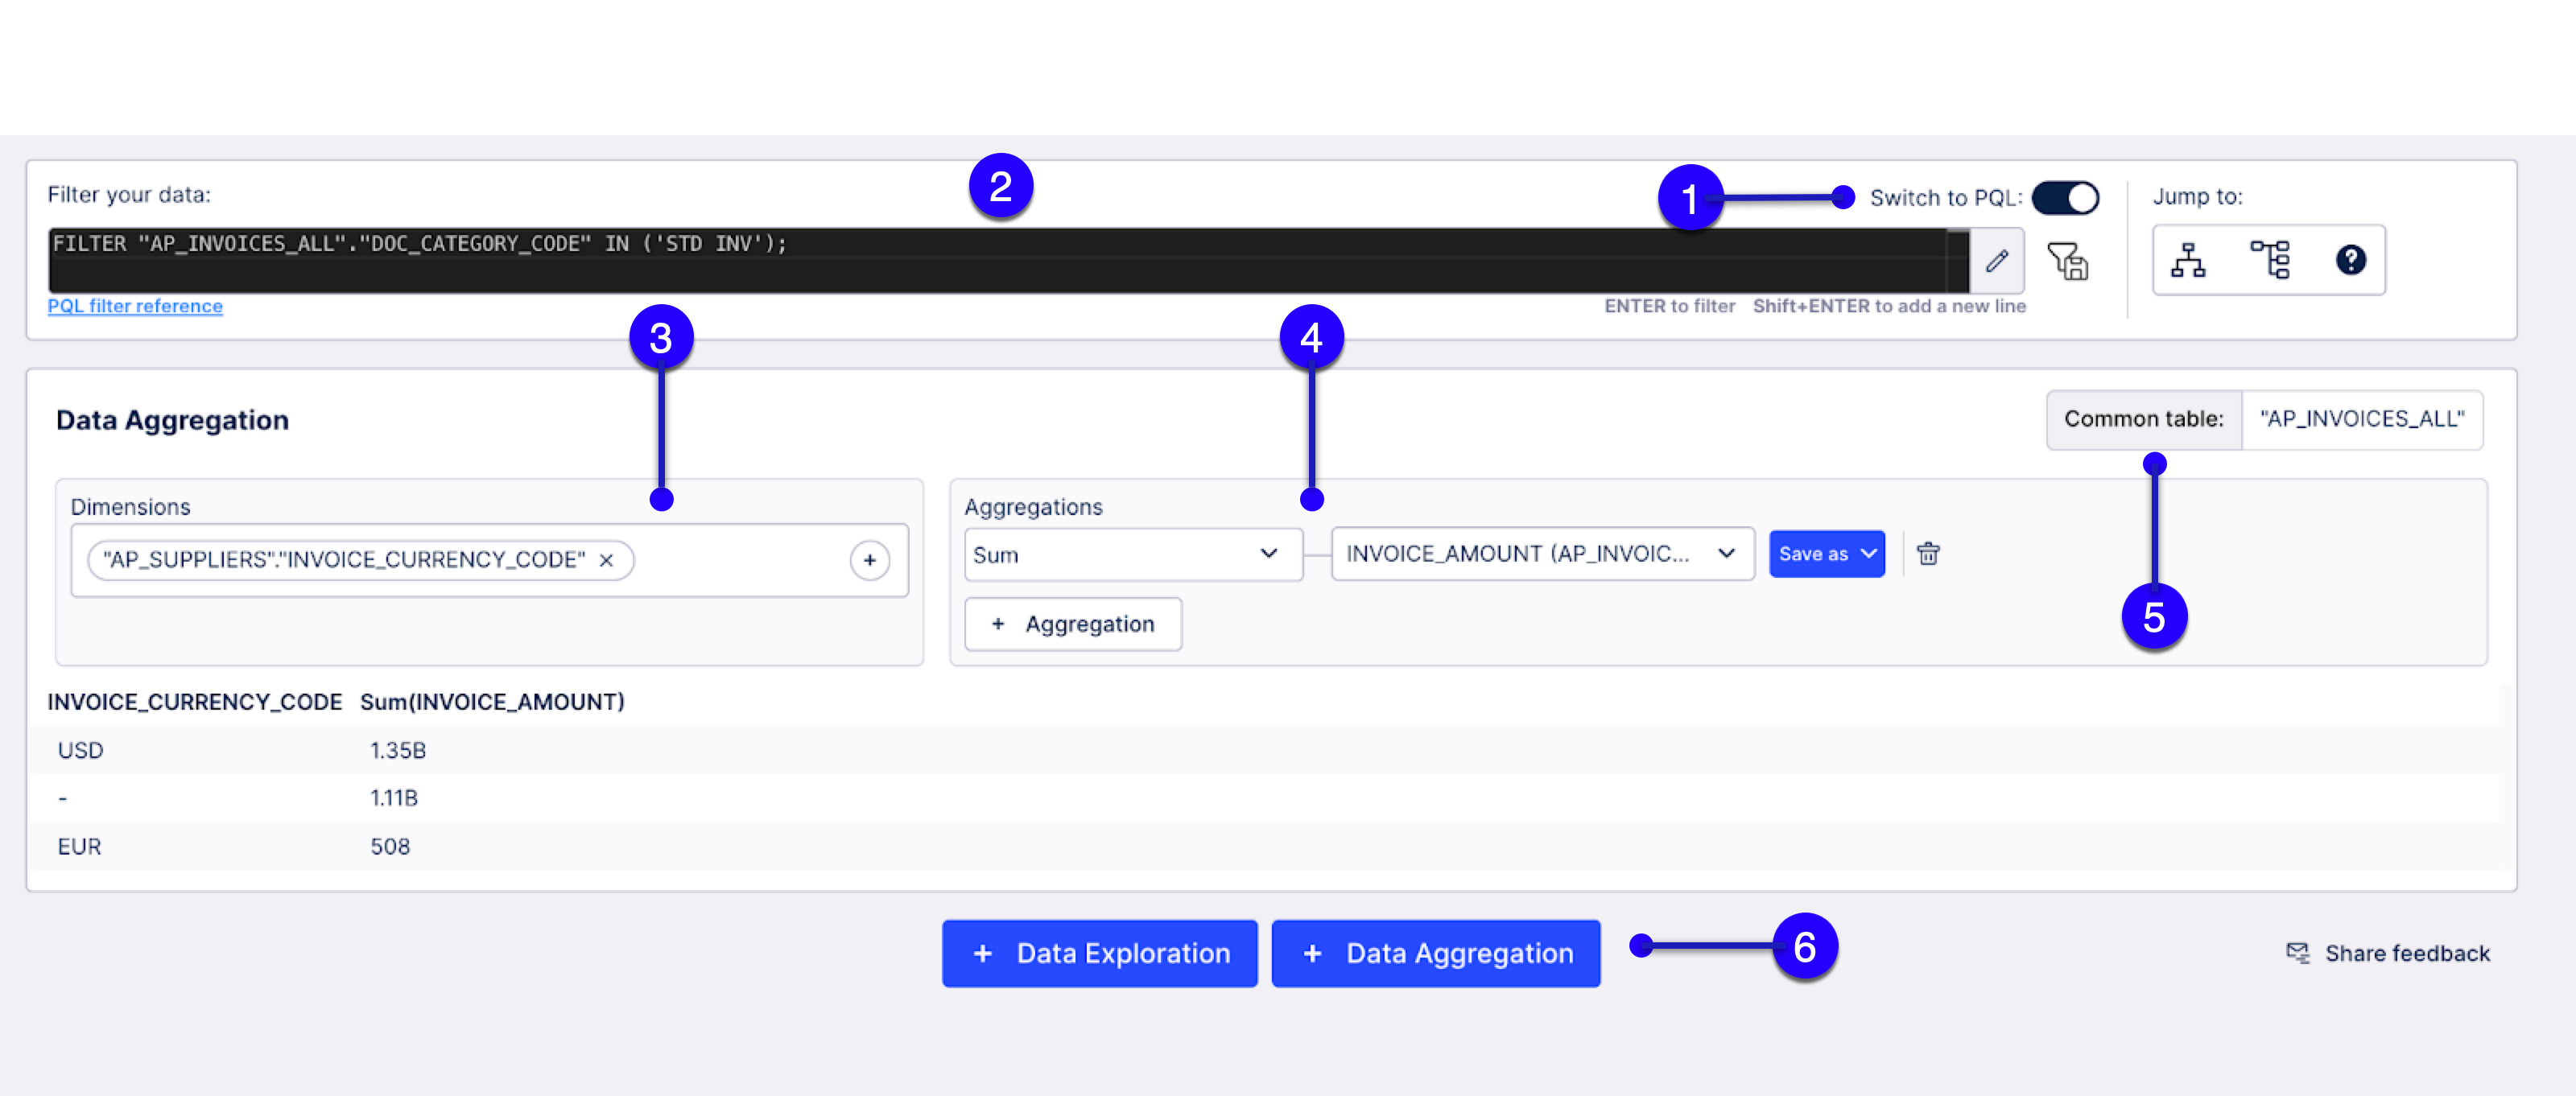 |
Switch to PQL
Use PQL when filtering your data
Select dimensions or create your own custom dimensions using the PQL editor.
Add your aggregations.
Check your common table.
Add more aggregations.