Using the End-To-End Lead Times app
The End-To-End Lead Times app provides you with insights into your whole supply chain and lets you explore specific materials in depth.
A material is a raw material, a semi-finished good, or a finished good. The app uses the combination of the material number and the plant number (the material’s current physical location), to identify and track each stock-keeping unit (SKU) that is in stock or has been sold in the past 12 months.
With the views in the app, you can:
Visualize the entire supply chain and rank materials by factors of interest.
Drill down to understand the end-to-end lead time for different materials and the contributing supply streams.
Analyze a single supply stream and identify inefficiencies and performance issues.
End-To-End Insights
The End-To-End Insights view shows a complete list of the sold goods in your supply chain. The table calculates results against key performance indicators (KPIs) for each material and plant number combination. You can see the end-to-end lead times both with and without days in inventory.
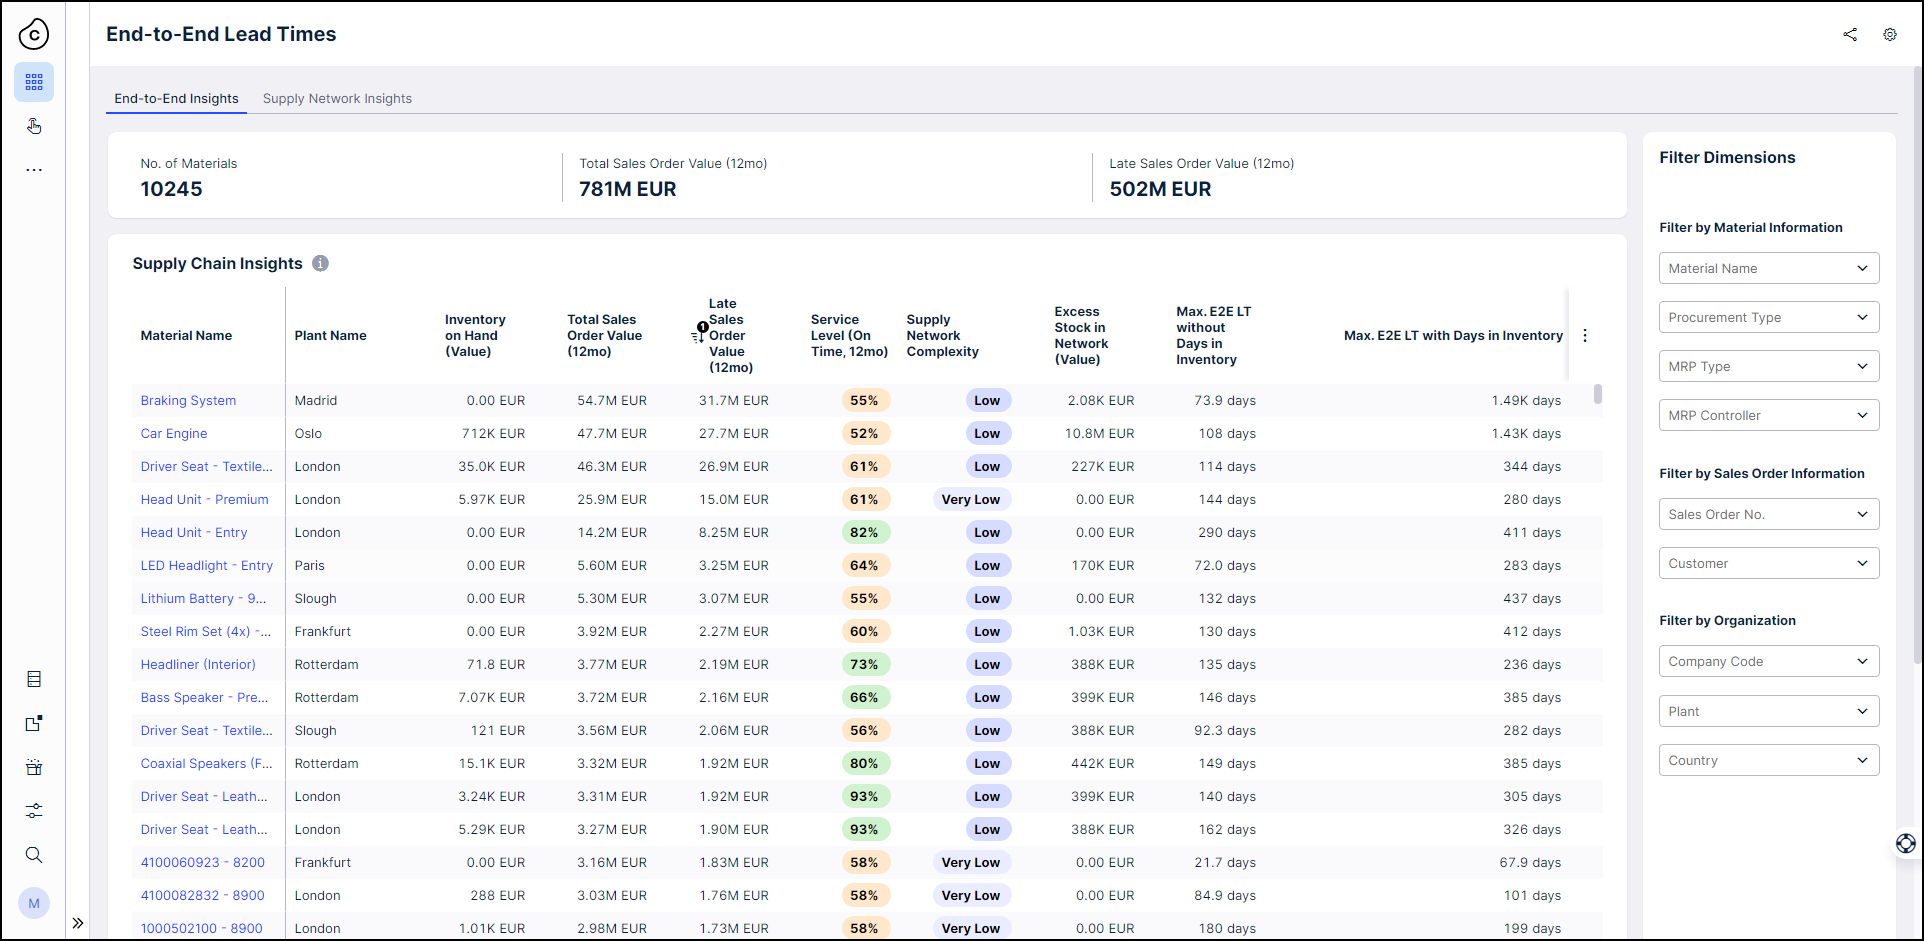 |
Hover over any column heading in the Supply Chain Insights table to see an explanation of the KPI or information shown.
To narrow down your focus, use the filter dimension drop-downs to filter the list by material type, customer or sales order, or organizational area. You can search or browse the available filters.
Select any column heading to rank the materials by that performance factor.
Click by the heading for the material and plant number column to search for a specific number code and display the results for it.
Click on the material number and plant number for any material, in the full table or the search results, to see the Supply Network view for that specific material.
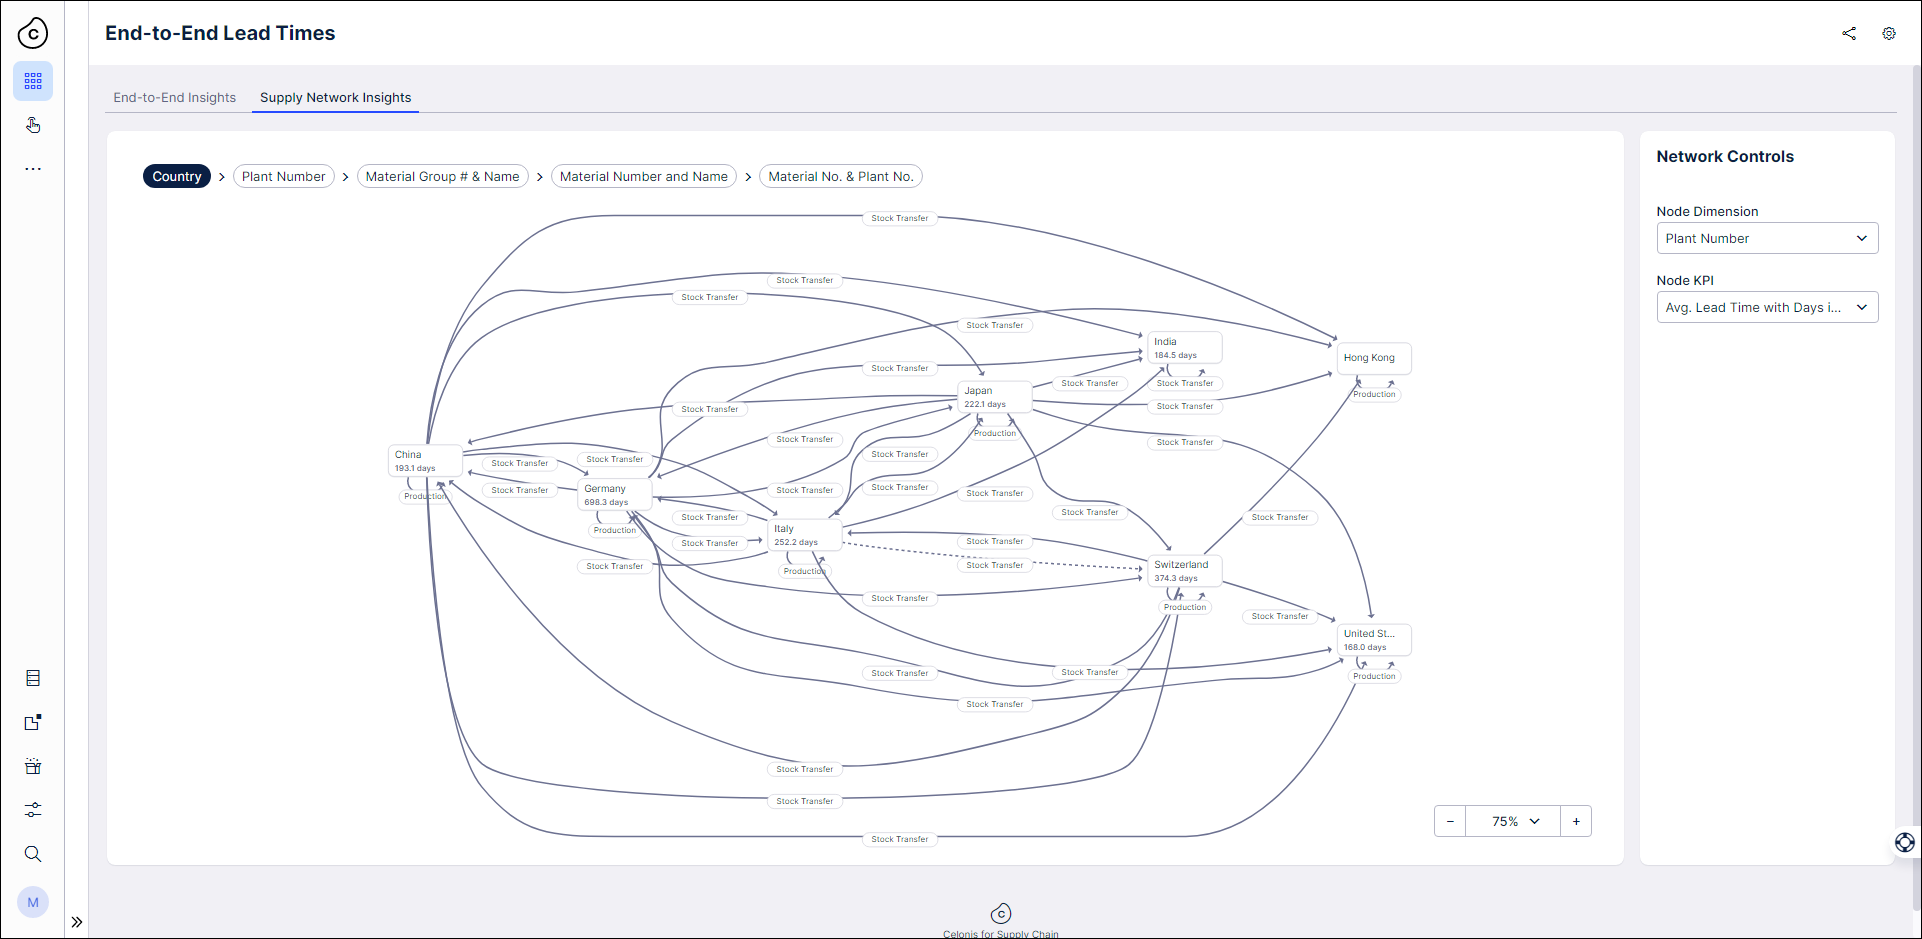
The Supply Network Insights view visualizes your supply chain using the filters, dimensions and KPIs you select. Use the Node KPI selector to pick what key performance indicator you want to see displayed on the nodes.
 |
Supply Network
The Supply Network view for a specific material shows each material and upstream process that goes into creating the target material.
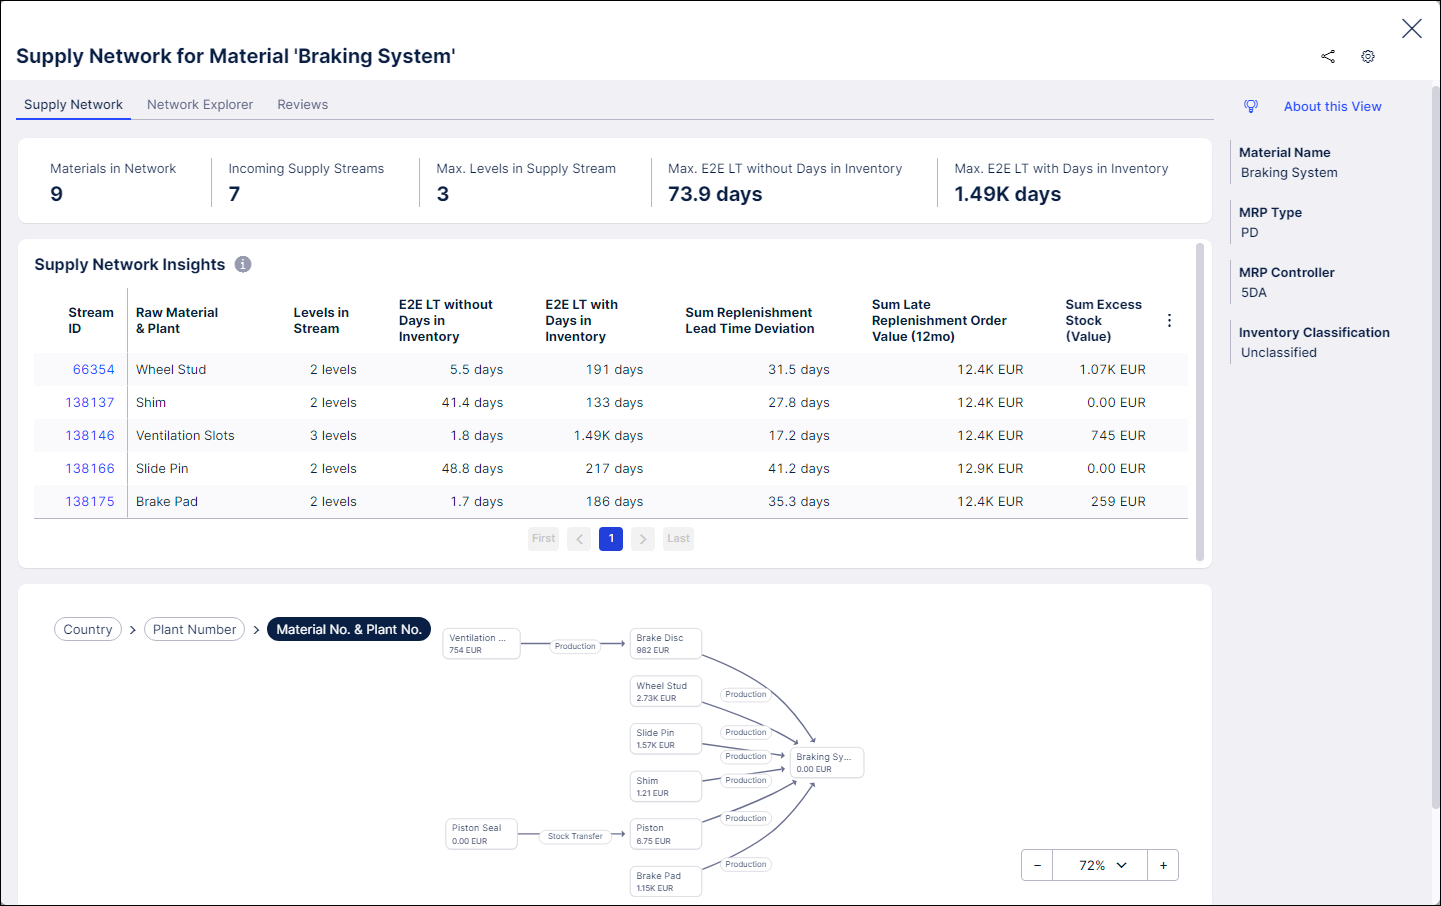 |
As with the view of the whole supply chain, you can rank the materials in the table by selecting the column heading for the KPI of interest. To drill down into an individual supply stream, click the stream ID in the first column of the table to see the Supply Stream view.
You can change the Node Dimension and KPI selectors to show different information in the supply network diagram. The default node dimension is the material number and plant number, and the default KPI is the value of inventory on hand for the material. The Network Explorer tab shows just the supply network diagram if you need more space to explore.
Check the Reviews tab for tasks associated with the material. There’s tasks that Celonis Platform suggests for you using our platform intelligence, and tasks that have been created manually and assigned for stakeholders.
Supply Stream
The Supply Stream view for a selected stream isolates a single process in the supply chain for in-depth analysis.
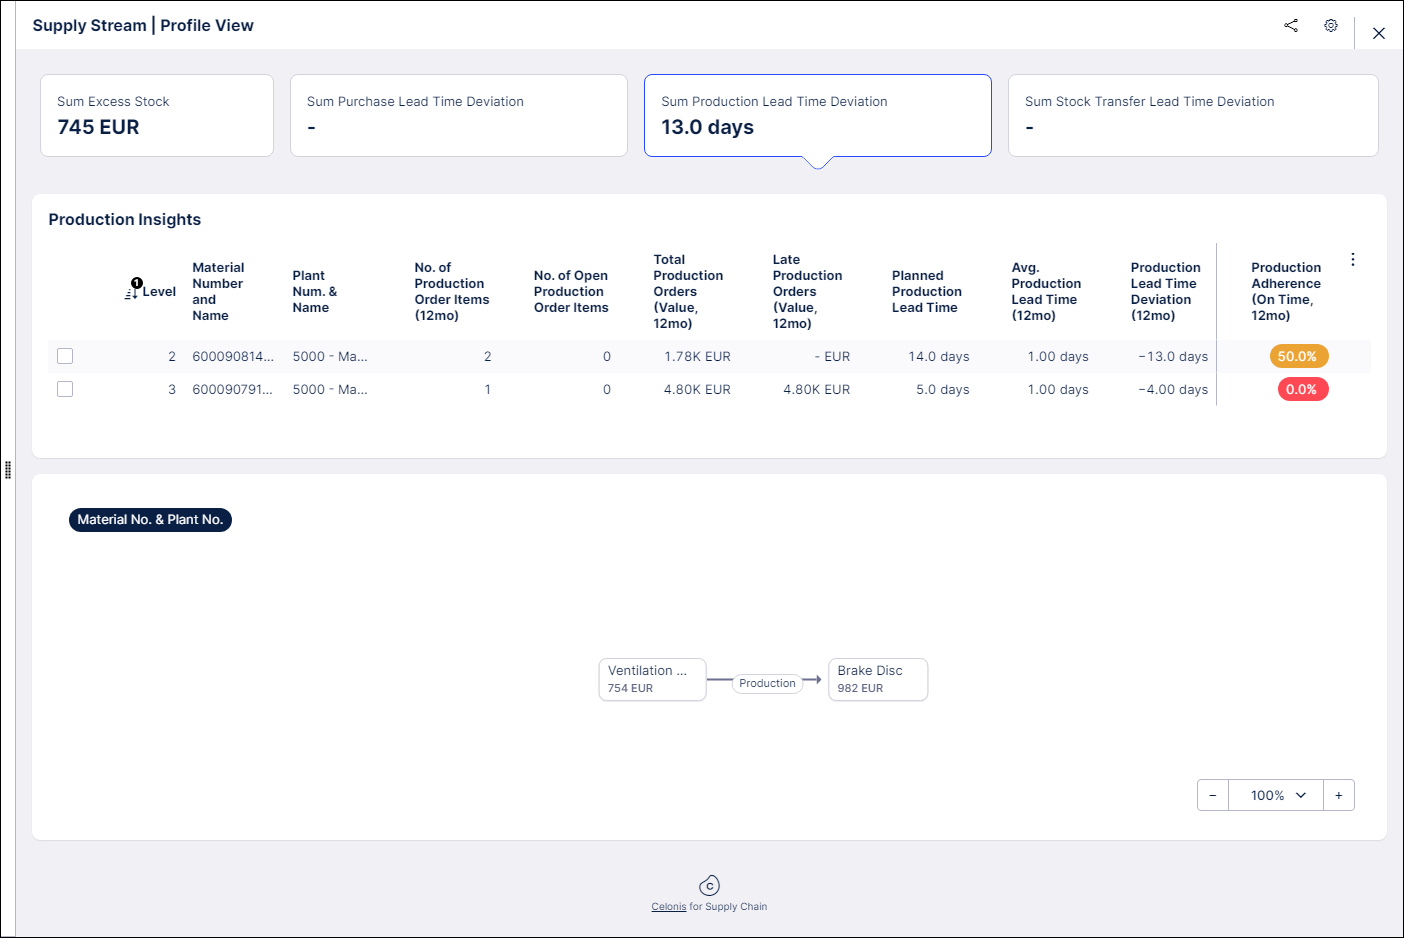 |
Select any of the KPI boxes at the top of the view to assess inefficiencies in the supply stream. In these tables you can check the box at the start of any material’s row to create tasks relating to it.
Excess Stock
Select this box to see the Inventory Insights table, which shows inventory on hand and days in inventory, and highlights where a material in the supply stream has excess stock. Here you can create tasks to evaluate lead time, safety stock levels, and open procurement transactions, to address excess inventory.
Purchasing Lead Time Deviation
Select this box to see the Procurement Insights table, which shows purchase order information, purchase lead time, deviation between actual and planned lead times, and supplier reliability. In this view, you can create tasks to evaluate and correct the master data for purchasing lead times.
Production Lead Time Deviation
Select this box to see the Production Insights table, which shows production order information, production lead time, deviation between actual and planned production lead time, and on-time production assessment. In this view, you can create tasks to evaluate and correct the master data for production lead times.
Stock Transfer Lead Time Deviation
Select this box to see the Stock Transfer Insights table, which shows stock transfer order information and stock transfer lead time, and stock transfer reliability.