Object popups
Object popups provide information about object relationships.
Click on an object in the process model graph. The graph displays all information related to the selected object and grays out all other information.
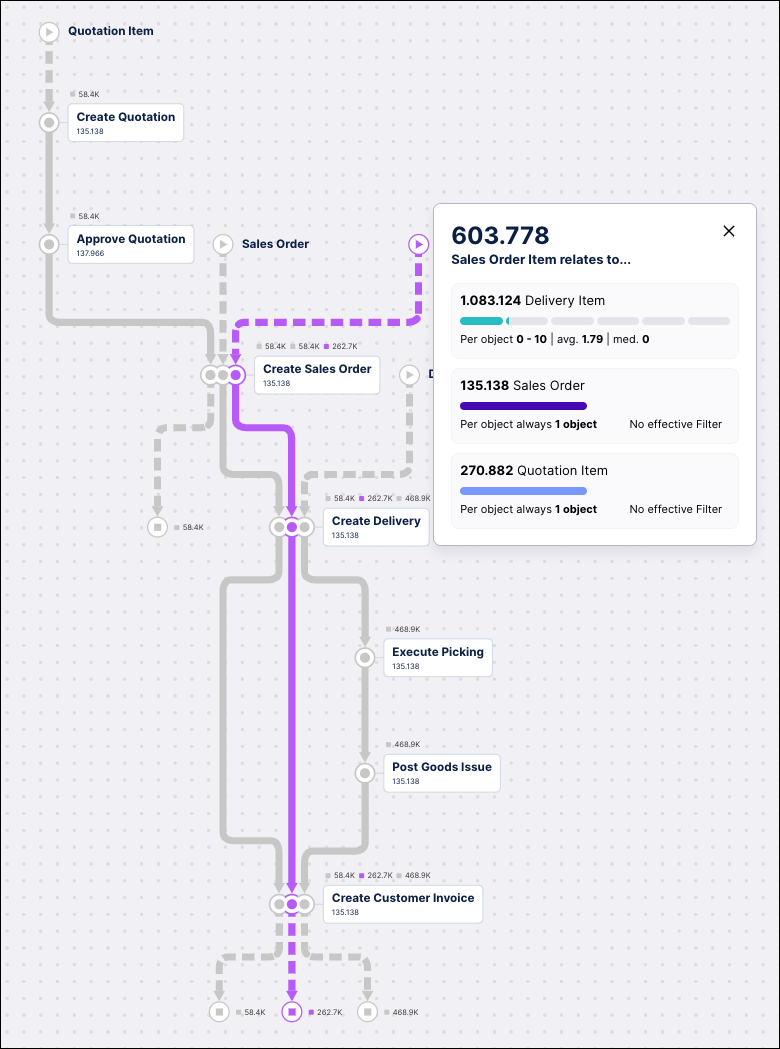
The object popup window shows the total number of objects of the selected type in the header.
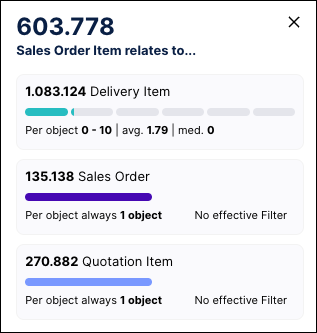
Each object type in the popup displays additional information such as:
How many objects of a type are related
The average number of related objects of this type
Median number of related objects of the type
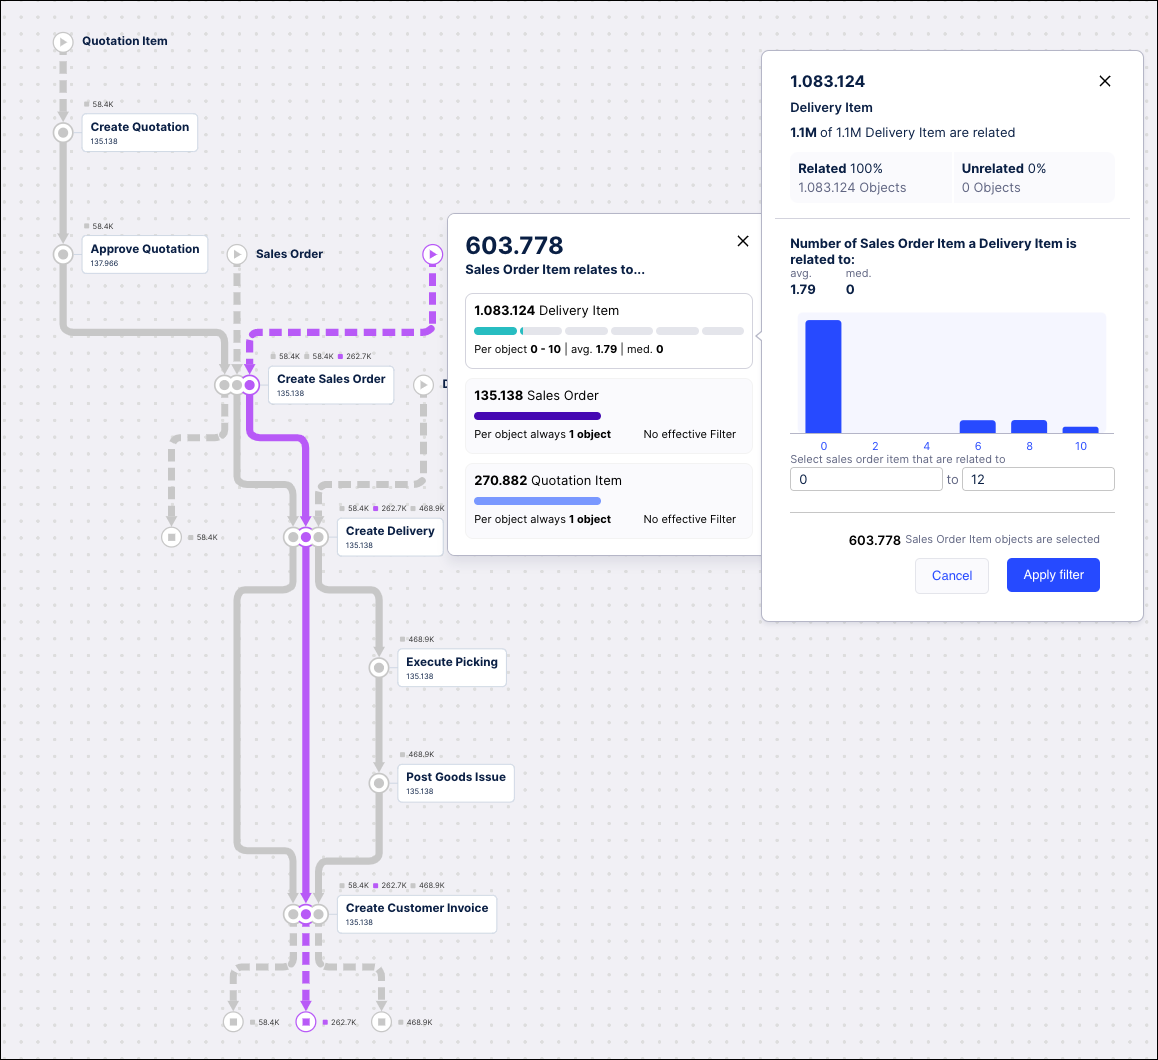
Click on any related object type to view further information:
Percentage and total number of the objects that are related to the selected object type
Percentage and number of the objects that are not related to the selected object type
Distribution of the number of related objects visualized as a histogram. The X-axis is the number of related objects and the Y-axis is the number of selected objects.
Click outside the popup to close it.