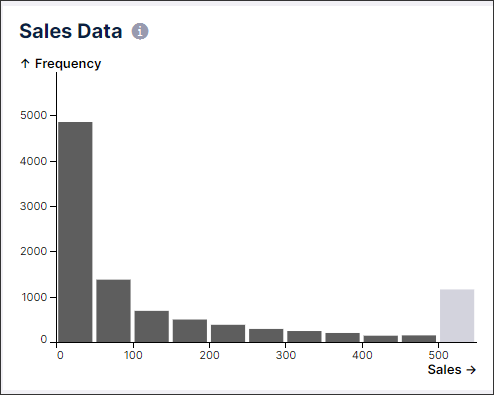
Histogram
View your data as a histogram, showing the frequency distribution of continuous variables. To show this distribution, your data is divided into groups (known as buckets') on the x-axis, while the y-axis shows the frequency (count) based on the data that falls in each bucket.
Basic histogram configuration
To configure a basic histogram, the following attributes are available:
Attribute | Required | Type | Description |
|---|---|---|---|
attribute | Yes | References attributes defined in the Knowledge Model. This is the data table column that will be used to create the buckets distribution. NoteOnly attributes with numerical (integer and float) data types are supported. | |
name | Yes | String | Defines the histogram name that will be displayed on the top left corner of the component. |
And the YAML example for a basic histogram configuration:
id: histogram-59edfcdb-f90c-4e9e-a954-2ba2cba246c5

type: histogram

settings:
     attribute: INVOICE.DEVIATION_FROM_DUE_DATE
     name: Distribution of how early or late invoices are paid
Advanced histogram configuration
To configure an advanced histogram, the following attributes are available:
Attribute | Required | Type | Possible values | Description | ||||||||||||
|---|---|---|---|---|---|---|---|---|---|---|---|---|---|---|---|---|
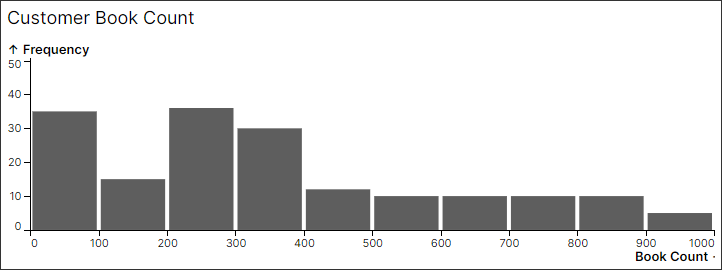
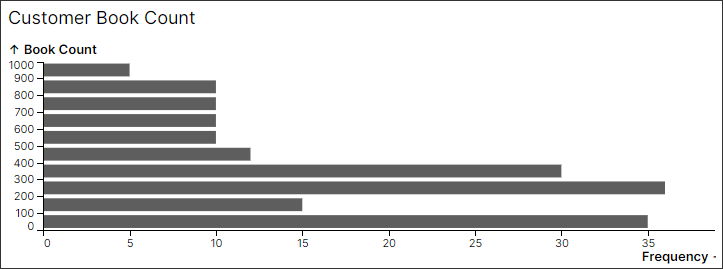
orientation | No | String | vertical horizontal | Defines if the bars in the histogram should be drawn on the horizontal or vertical axis. Vertical
Horizontal
| ||||||||||||
distributionAxis | No | - | - | Defines display settings for the main distribution axis. | ||||||||||||
format | No | Format type | Defines the format display for the indicated attribute on the distribution axis. | |||||||||||||
title | No | String | Defines the title displayed for the indicated attribute on the distribution axis. | |||||||||||||
occurrenceAxis | No | - | - | Defines display settings for the histogram’s occurrence axis. This axis shows the frequency count for each bucket on the distribution axis. | ||||||||||||
format | No | Format type | Defines the format display for the indicated attribute on the distribution axis. | |||||||||||||
title | No | String | - | Defines the title displayed for the indicated attribute on the distribution axis. | ||||||||||||
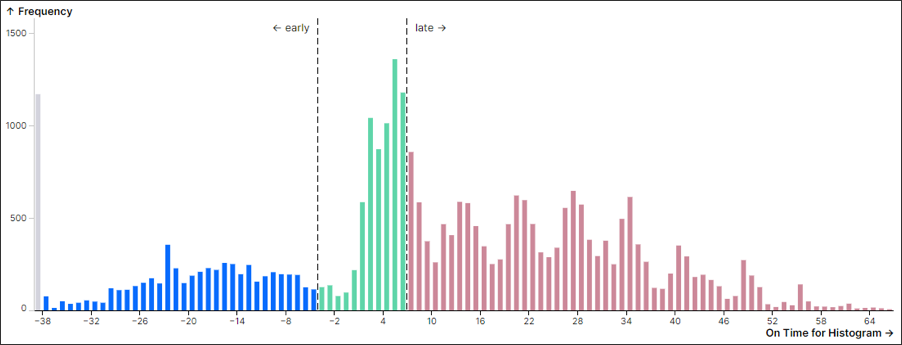
displayContentRule | No | - | Defines custom coloring rules that can be used to color specific bars in the histogram. NoteThe buckets displayed will be updated based on the “value” defined in the display rule.
Display content rule in Knowledge model: customObjects:
- id: COLOR_THRESHOLDS_RULE
displayName: Color thresholds rule
customAttributes:
- comparator:LESS_THAN
value: -4
style:
backgroundColor: blue
- comparator: BETWEEN
kpi:
- KPI_NEG_4
- KPI_7
style:
backgroundColor: "#5FD5A9"
- comparator: GREATER_THAN
value: KPI_7
style:
backgroundColor: "#CC8899" | |||||||||||||
suggestedBucketCount | No | Integer | - | Defines the number of buckets that will be displayed in the histogram. This count does not include outliers buckets. NoteAny value indicated here will be treated as a suggestion. The bucket calculation will always prioritize “nice” bucket sizes with integer bounds (i.e. avoiding decimal values). Also, including annotation lines or custom coloring groups will also impact these bucket calculations. The histogram calculation will always aim to keep the bucket count as close to the indicated values while keeping nice bucket sizes and taking into account position lines and coloring groups. | ||||||||||||
suggestedBucketWidth | No | Integer | - | Defines the width for each bucket that will be displayed in the histogram. NoteAny value indicated here will be treated as a suggestion. The bucket calculation will always prioritize “nice” bucket sizes with integer bounds (i.e. avoiding decimal values). Also, including annotation lines or custom coloring groups will also impact these bucket calculations. The histogram calculation will always aim to keep the bucket width as close to the indicated values while keeping nice bucket sizes and taking into account position lines and coloring groups. | ||||||||||||
additionalKPIs | No | - | Define additional KPIs to be displayed in the histogram tooltip. 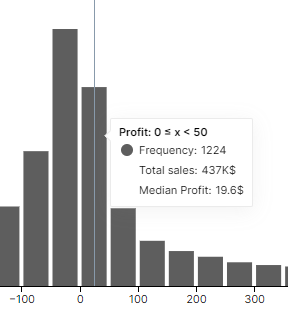 | |||||||||||||
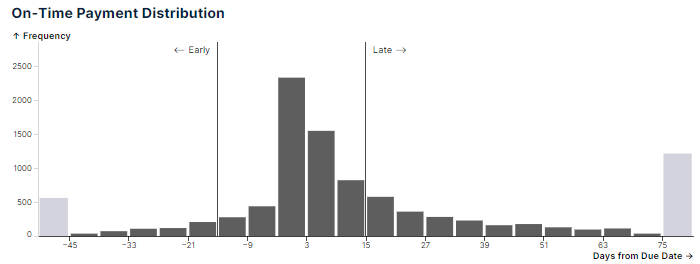
annotations: | No | - | Add custom annotation lines to the distribution axis.
| |||||||||||||
value | No | Integer View or runtime variable | Defines the value on the distribution axis that the annotation line should be placed on by either a hardcoded integer or variable value. NoteThe “value” and “kpi'' fields should not both be used. You should define the annotation line with either an integer value or a defined KPI. | |||||||||||||
kpi | No | Defines the value on the distribution axis that the annotation line should have with a defined KPI from the Knowledge Model. NoteThe “value” and “kpi'' fields should not both be used. You should define the annotation line with either an integer value or a defined KPI. | ||||||||||||||
line | No | boolean | solid (default) dashed none | Defines the type of annotation line displayed.
 Dashed 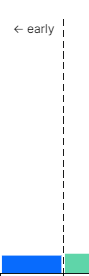 None  | ||||||||||||
label | No | string | - | Defines the label displayed for the annotation line. | ||||||||||||
labelalign | No | boolean | start middle end | Defines how the label is displayed with the position line. These will appear differently depending on the histogram’s orientation.
| ||||||||||||
color | No | boolean | BLUE, GREEN, RED, PURPLE, YELLOW, BLACK, CYAN, GRAY, PINK, PURPLE, ORANGE, TEAL, RED, WHITE | Defines the color of the annotation line. | ||||||||||||
forceBucketBoundary | No | boolean | true false | Defines if the bucket sizes should be calculated to ensure a bound falls along the position line. | ||||||||||||
interactions: filters: true | No | boolean | true false | Defines if the histogram bars can be selected to apply view filters. If set to false, these bars can not be selected. |


And the example YAML for an advanced histogram configuration:
id: histogram-59edfcdb-f90c-4e9e-a954-2ba2cba246c5

type: histogram

settings:

   attribute: INVOICE.DEVIATION_FROM_DUE_DATE

   name: Distribution of how early or late invoices are paid

   orientation: vertical

   distributionAxis:

     title: Time of payment (days)

     format: ",.2f"

   occurrenceAxis:

     title: Case Count

     format: ",.2f"

   annotations:

    - value: -4,

     label: ← early

     labelAlign: start

     color: GRAY

     line: solid

     forceBucketBoundary: true

    - kpi: ON_TIME_ZERO

     label: On Time

     labelAlign: middle

     color: BLACK

     line: none

     forceBucketBoundary: false

  additionalKpis:

   - kpi: SUM_TOTAL_INVOICE_VALUE

  suggestedBucketWidth: 1

   displayContentRule: COLOR_THRESHOLDS_RULE