KPIs and analytics
Overview of the KPIs & Analytics dashboard
The KPIs & Analytics dashboard gathers high-level business information using KPIs from Celonis and business outcomes from any digital processes that are running.
The data on the dashboard gives you insight into how a particular aspect of your business is performing. From this point, you can create new digital processes to address problems.
A good example would be an 'excess stock' digital process designed to maintain optimal stock levels. It would identify and prioritize products with a high stock level, ensuring their successful promotion and preventing any issues with overstock.
The dashboard is divided into two sections:
KPIs - data showing KPIs retrieved from Celonis
Process Effectiveness - graphs showing the business outcomes of your running digital processes

Prerequisite
To start configuring the KPIs and Analytics dashboard, configure your connection see the Integration with Celonis documentation.
Configuring the KPIs & Analytics dashboard
You can configure the KPIs & Analytics dashboard to display the data that is most important for you to monitor. To start the dashboard configuration, go to Orchestration Engine > Admin > KPIs & Analytics.
Business KPIs
To configure business KPIs:
In the Business KPIs section, you can configure up to four KPI tiles that display your selected data.

To set up a specific KPI, open its edit mode by choosing the edit (pen) icon.
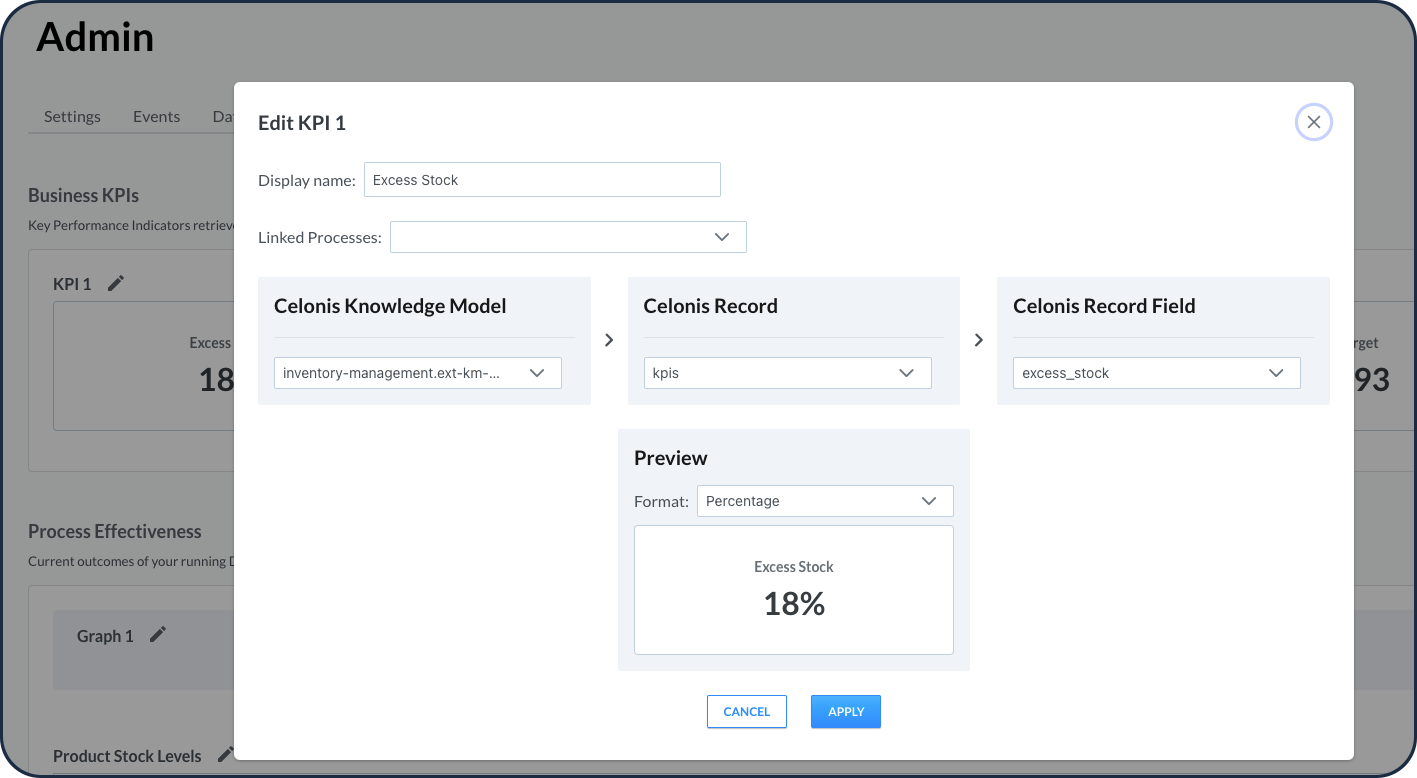
Enter the Display name for the data that should be displayed in the tile.
Link the digital process that is configured to work with the KPIs data.
Complete the following KPI data source configuration:
Celonis Knowledge Model
Celonis Record
Celonis Record Field
Preview Format
Choose Apply to save your configuration.
Process effectiveness
To configure the process effectiveness visualizations:
In the Process Effectiveness section, you can configure up to four graphs that can be used in the KPIs & Analytics dashboard to view the results of the running processes and their effect on business outcomes.
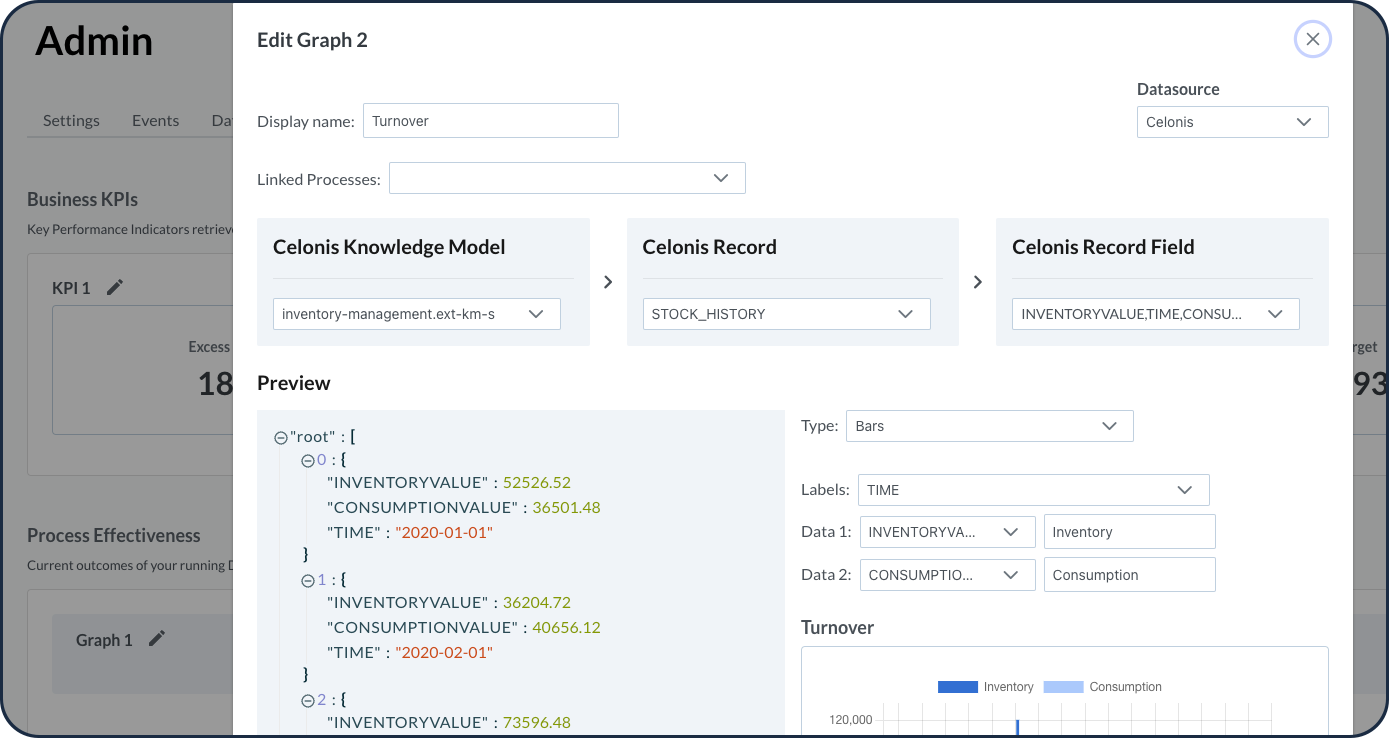
Enter the Display name for the data graph.
Choose the related digital process.
Complete the following KPI data source configuration:
Celonis Knowledge Model
Celonis Record
Celonis Record Field
Choose Apply to save your configuration.