Reading the process model graph
The subway map style of the process model graph allows you to follow the process and see the steps involved. Each subway line (object) is displayed in a different color to help differentiate, but multiple lines also may meet up at the same stop (event). However, there are also events that occur exclusively to a single object. The Process Adherence Manager graph has visual indicators to show when these types of events are occurring in your process model.
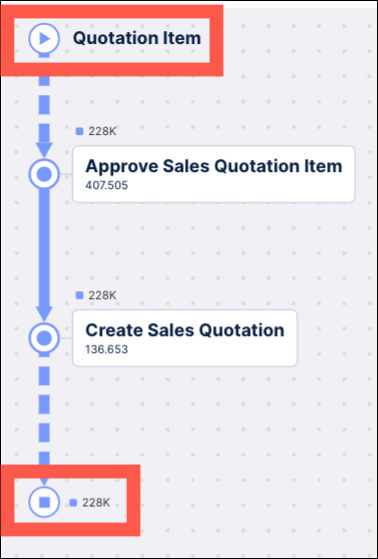
Object Start / Object End
The triangle icon indicates the first event in the object while the square icon is used to designate the last event.
 |
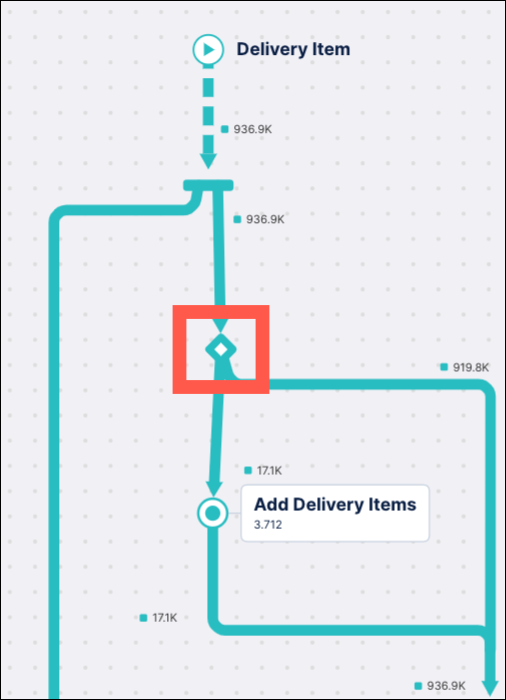
Exclusive Splits
The diamond indicates an exclusive split of the event flow. Exactly one of the outgoing paths is taken.
 |
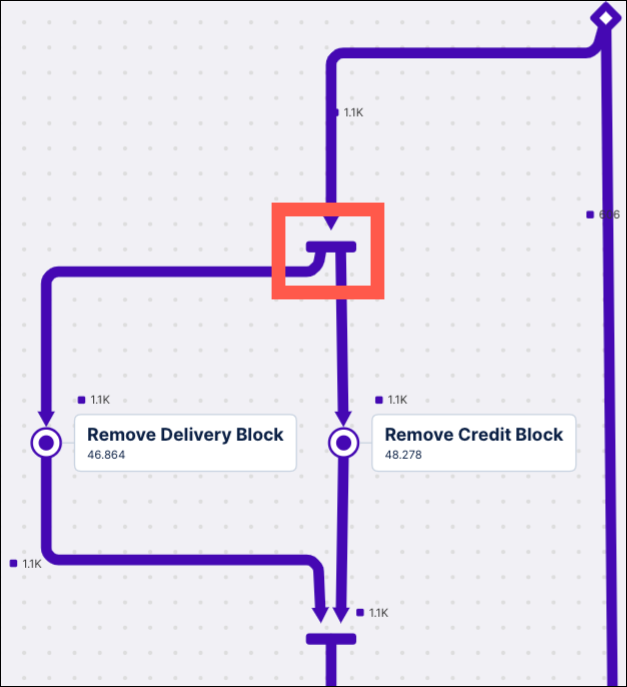
Parallel Gateways
A horizontal bar (parallel gateway) indicates parallel behavior. All of the ongoing paths are taken, however, their order can differ. Correspondingly, all incoming paths join at the gateway before the next events occur.
 |
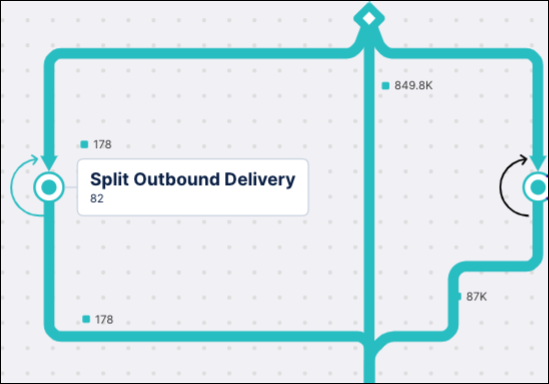
Loops
Loops are directly recurring events represented by a simple looping arrow next to the event. If the loop only occurs for one object, then the loop indicator is shown in the same color as the object. If the loop occurs for multiple objects, the loop indicator is displayed in black.
 |